Search results
From CASA Guides
Jump to navigationJump to search
Page title matches
- ...short) is a small set of Python source code files that provide a number of analysis and plotting utilities. The primary file is analysisUtils.py (108000 lines '''Step 1:''' Download Analysis Utilities8 KB (1,236 words) - 16:50, 29 April 2024
- 53 bytes (7 words) - 17:18, 12 October 2023
- == How to mask an image for further analysis (e.g. for moment analyses) == You may now use this image for further analysis, e.g. to create moment maps that are not contaminated by noise or sidelobes5 KB (810 words) - 10:54, 25 August 2021
File:Imaging-tutorial-analysis-mom0.png (889 × 1,023 (121 KB)) - 19:37, 19 February 2015
File:Imaging-tutorial-analysis-overlay.png (889 × 1,023 (74 KB)) - 19:37, 19 February 2015- <figure id="Imaging-tutorial-analysis-mom0.png"> [[File:Imaging-tutorial-analysis-mom0.png|thumb|<caption>The zero moment of the N2H+ image.</caption>]]5 KB (823 words) - 11:18, 5 March 2018
- #REDIRECT [[First Look at Image Analysis]]42 bytes (6 words) - 11:18, 5 March 2018
- <figure id="Imaging-tutorial-analysis-mom0.png"> [[File:Imaging-tutorial-analysis-mom0.png|thumb|<caption>The zero moment of the N2H+ image.</caption>]]9 KB (1,122 words) - 14:53, 29 May 2019
- [[File:Imaging-tutorial-analysis-mom0_5.7.png|thumb|<caption>The zero moment of the N2H+ image.</caption>]] [[File:Imaging-tutorial-analysis-overlay_5.7.png|thumb|<caption>The N2H+ moment zero map as contours, overla9 KB (1,200 words) - 17:18, 12 October 2023
File:Imaging-tutorial-analysis-mom0 5.7.png (1,530 × 872 (723 KB)) - 09:30, 6 October 2020- [[File:Imaging-tutorial-analysis-mom0_6.1.png|thumb|<caption>Figure 1: The zero moment of the N2H+ image.</c [[File:Imaging-tutorial-analysis-overlay_6.1.png|thumb|<caption>Figure 2: The N2H+ moment zero map as contou10 KB (1,203 words) - 14:28, 6 April 2022
File:Imaging-tutorial-analysis-overlay 5.7.png (1,532 × 869 (478 KB)) - 09:30, 6 October 2020
File:Imaging-tutorial-analysis-mom0 6.1.png (1,531 × 868 (689 KB)) - 12:55, 6 October 2020
File:Imaging-tutorial-analysis-overlay 6.1.png (1,534 × 866 (465 KB)) - 12:55, 6 October 2020- [[File:Imaging-tutorial-analysis-mom0_6.1.png|thumb|<caption>Figure 1: The zero moment of the N2H+ image.</c [[File:Imaging-tutorial-analysis-overlay_6.1.png|thumb|<caption>Figure 2: The N2H+ moment zero map as contou10 KB (1,203 words) - 14:46, 25 October 2022
- [[File:Imaging-tutorial-analysis-mom0_6.5.4.jpg|thumb|<caption>Figure 1: The zero moment of the N2H+ image.< [[File:Imaging-tutorial-analysis-overlay_6.5.4.jpg|thumb|<caption>Figure 2: The N2H+ moment zero map as cont12 KB (1,674 words) - 10:15, 8 February 2024
File:Imaging-tutorial-analysis-mom0 6.5.4.jpg (887 × 691 (202 KB)) - 14:36, 10 October 2023
File:Imaging-tutorial-analysis-overlay 6.5.4.jpg (1,584 × 992 (199 KB)) - 14:37, 10 October 2023
File:Imaging-tutorial-analysis-velocityfield 6.5.4.jpg (874 × 677 (114 KB)) - 14:37, 10 October 2023- ==Image Analysis and Viewing== This analysis suggests that the rms noise on one baseline, one 10 second integration is a21 KB (3,516 words) - 16:03, 2 September 2011


Page text matches
- == Analysis == [[File:N891d.analysis.png]]813 bytes (125 words) - 11:18, 2 November 2012

File:Complist only.alma.cycle5.1.analysis.png Analysis components only(817 × 617 (130 KB)) - 13:36, 14 March 2018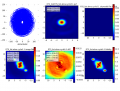
File:FITS list.alma.cycle5.1.analysis.png Analysis image simanalyze(817 × 617 (149 KB)) - 13:28, 14 March 2018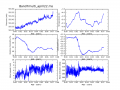
File:Band7multi april22.ms.weather.png Analysis Utilities plotWeather output.(800 × 600 (84 KB)) - 16:53, 16 December 2011- #REDIRECT [[First Look at Image Analysis]]42 bytes (6 words) - 11:18, 5 March 2018
File:Antcont Northall.ms.pointings.png Analysis Utilities plotmosaic output, with absolute coordinates.(812 × 612 (109 KB)) - 16:42, 16 December 2011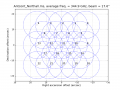
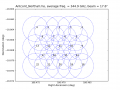
File:Antcont Northall.ms.pointings.relative.png Analysis Utilities plotmosaic output, with relative coordinates.(800 × 600 (116 KB)) - 16:45, 16 December 2011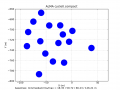
File:ALMA.cycle0.compact.png Analysis Utilities plotconfig output for ALMA Cycle 0 compact configuration.(812 × 612 (47 KB)) - 16:42, 11 April 2013
File:Init.py An example init.py file to import Analysis Utilities upon CASA startup(235 bytes) - 14:25, 12 September 2017- ...nrao.edu/opportunities/courses/casa-caltech-winter2012/ Caltech CASA Radio Analysis Workshop]: * Image analysis3 KB (383 words) - 14:22, 16 January 2012
- === Analysis ===1 KB (178 words) - 15:37, 26 February 2014
- '''Return to [[Analysis Utilities]]''' This page documents the plotSunDuringTrack function of Python module [[Analysis Utilities|analysisUtils]].942 bytes (156 words) - 01:04, 27 January 2013
- ** Data Imaging and Analysis: [[EVLA Spectral Line Imaging Analysis IRC+10216]]775 bytes (114 words) - 13:26, 5 October 2010
- ...s Utilities (python module)]] --- A Python module containing utilities for analysis and plotting.2 KB (235 words) - 23:43, 17 August 2012
- === Analysis === * [[Masking images for analysis]]2 KB (287 words) - 15:49, 20 August 2012
- ** [[Analysis Utilities]] -- a Python module containing utilities for analysis and plotting.1 KB (168 words) - 16:34, 30 July 2012
- ...mean that in practice it has a lot of similarities to other commonly used analysis packages like IDL or MatLab. ...r then you will also find some of the tools to integrate your astronomical analysis, observation problem, and data reduction.2 KB (308 words) - 14:05, 13 September 2013
- '''Return to [[Analysis Utilities]]''' This page documents the '''plotWeather''' function of Python module [[Analysis Utilities|analysisUtils]].1 KB (189 words) - 12:16, 18 January 2013
- ** Data Imaging and Analysis: [[EVLA Spectral Line Imaging Analysis IRC+10216]]1 KB (164 words) - 17:01, 30 November 2017
- '''Return to [[Analysis Utilities]]''' This page documents the '''plotPWV''' function of Python module [[Analysis Utilities|analysisUtils]].1 KB (208 words) - 13:17, 14 April 2014
- '''Return to [[Analysis Utilities]]''' This page documents the editIntents function of Python module [[Analysis Utilities|analysisUtils]].2 KB (220 words) - 18:26, 27 June 2013
- ** [[Analysis Utilities]] -- a Python module containing utilities for analysis and plotting.1 KB (192 words) - 19:07, 28 November 2017
- '''Return to [[Analysis Utilities]]''' This page documents the gjincBeam function of the Python module [[Analysis Utilities|analysisUtils]].2 KB (215 words) - 18:30, 27 June 2013
- === Analysis === * [[Masking images for analysis]]3 KB (447 words) - 16:38, 30 October 2017
- '''Return to [[Analysis Utilities]]''' This page documents the getBaselineLengths function of Python module [[Analysis Utilities|analysisUtils]].3 KB (330 words) - 15:50, 16 December 2011
- This guide features [https://cartavis.org/ CARTA], the “Cube Analysis and Rendering Tool for Astronomy,” which is the new NRAO visualization to721 bytes (114 words) - 20:05, 2 January 2024
- ...k at imaging in CASA]] This guide gives a first look at imaging and image analysis in CASA. ...nalysis in CASA]] This guide demonstrates moment creation and basic image analysis.6 KB (859 words) - 16:29, 8 January 2018
- '''Return to [[Analysis Utilities]]''' ...documents the '''angularSeparationOfFields''' function of Python module [[Analysis Utilities|analysisUtils]].3 KB (301 words) - 01:03, 27 January 2013
- '''Return to [[Analysis Utilities]]''' This page documents the lstrange function of Python module [[Analysis Utilities|analysisUtils]].2 KB (265 words) - 11:50, 1 March 2012
- ...es. Common uses of regions include defining clean boxes, performing image analysis, and cutting out subimages. Additionally, the region format includes annot A CRTF can also be given to methods in the CASA image analysis (ia) toolkit, but not directly. This is because the lattice region format5 KB (880 words) - 18:29, 4 October 2011
- ...ials to guide new ALMA users through some common types of data imaging and analysis using example ALMA datasets. In addition, we provide detailed guides to the ...rst look at imaging]]: This guide gives a first look at imaging and image analysis in CASA.8 KB (1,160 words) - 16:55, 13 May 2024
- ...tasets resulting from these new telescopes: from data calibration to image analysis. Detailed information is available in the CASA Cookbook, which you can down == Analysis ==6 KB (862 words) - 17:03, 27 March 2013
- '''Return to [[Analysis Utilities]]''' This page documents the '''plotWVRSolutions''' function of Python module [[Analysis Utilities|analysisUtils]].2 KB (343 words) - 09:51, 6 April 2017
- '''Return to [[Analysis Utilities]]''' This page documents the '''planetPlots''' function of Python module [[Analysis Utilities|analysisUtils]].3 KB (477 words) - 12:36, 6 September 2013
- ...ials to guide new ALMA users through some common types of data imaging and analysis using example ALMA datasets. In addition, we provide detailed guides to the ...at imaging in CASA]]: This guide gives a first look at imaging and image analysis in CASA.8 KB (1,075 words) - 21:06, 14 December 2017
- '''Return to [[Analysis Utilities]]''' This page documents the obslist function of Python module [[Analysis Utilities|analysisUtils]].3 KB (499 words) - 16:45, 4 January 2012
- '''Return to [[Analysis Utilities]]''' This page documents the buildConfigurationFile function of Python module [[Analysis Utilities|analysisUtils]].6 KB (1,030 words) - 16:45, 24 March 2013
- ....php?title=EVLA_Advanced_Topics_3C391-CASA4.3 3C391 Tutorial Part 2: Image Analysis, Polarization, Self-calibration (CASA 4.3)] ...dex.php?title=Advanced_Topics_3C391_-_CASA4.2 3C391 Tutorial Part 2: Image Analysis, Polarization, Self-calibration]21 KB (2,724 words) - 12:03, 1 March 2024
- == Obtaining Analysis Utilities == ...de use the [https://casaguides.nrao.edu/index.php?title=Analysis_Utilities Analysis Utilities] package. If you wish to use any of these tasks, follow the link7 KB (1,100 words) - 19:50, 12 September 2023
- == Obtaining Analysis Utilities == ...de use the [https://casaguides.nrao.edu/index.php?title=Analysis_Utilities Analysis Utilities] package. If you wish to use any of these tasks, follow the link7 KB (1,132 words) - 16:55, 28 February 2024
- '''Return to [[Analysis Utilities]]''' This page documents the '''searchFlux''' function of Python module [[Analysis Utilities|analysisUtils]].4 KB (421 words) - 14:16, 18 April 2014
- ...es (python module)]]'''</big> --- A Python module containing utilities for analysis and plotting, including (among many others):5 KB (804 words) - 16:14, 28 September 2016
- '''Return to [[Analysis Utilities]]''' This page documents the '''plotconfig''' function of Python module [[Analysis Utilities|analysisUtils]].4 KB (325 words) - 11:47, 3 July 2013
- '''Return to [[Analysis Utilities]]''' This page documents the '''plotmosaic''' function of Python module [[Analysis Utilities|analysisUtils]].3 KB (468 words) - 09:47, 12 April 2014
- ...a set, especially if the type of observations, quality of data, or imaging analysis are particularly different or complicated. More details about CASA and its ...utorials are meant to guide the observer through some common types of data analysis, using example datasets, and including explanations of the individual steps13 KB (1,866 words) - 17:24, 25 March 2024
- * A first look at image analysis: [[First_Look_at_Image_Analysis_4.4 | CASA 4.4]] [[First_Look_at_Image_Anal2 KB (320 words) - 17:19, 12 October 2023
- '''Return to [[Analysis Utilities]]'''2 KB (354 words) - 17:25, 13 November 2012
- == How to mask an image for further analysis (e.g. for moment analyses) == You may now use this image for further analysis, e.g. to create moment maps that are not contaminated by noise or sidelobes5 KB (810 words) - 10:54, 25 August 2021
- <figure id="Imaging-tutorial-analysis-mom0.png"> [[File:Imaging-tutorial-analysis-mom0.png|thumb|<caption>The zero moment of the N2H+ image.</caption>]]5 KB (823 words) - 11:18, 5 March 2018
- ...short) is a small set of Python source code files that provide a number of analysis and plotting utilities. The primary file is analysisUtils.py (108000 lines '''Step 1:''' Download Analysis Utilities8 KB (1,236 words) - 16:50, 29 April 2024


