ALMA Tutorials: Difference between revisions
mNo edit summary |
|||
| (44 intermediate revisions by 2 users not shown) | |||
| Line 1: | Line 1: | ||
== Introduction == | == Introduction == | ||
This page contains tutorials to guide ALMA users through some common types of data imaging and analysis using CASA with example ALMA datasets. | This page contains tutorials to guide ALMA users through some common types of data imaging and analysis using CASA with example ALMA datasets. Here are some links to get started: | ||
* [[How To Use A CASAGuide]] | |||
* [[Extracting scripts from these tutorials]] | |||
{| class="wikitable" | |||
! [[File:Alma_logo.jpg|75px|link=https://almascience.org/]] | |||
| | |||
* [https://almascience.org/ ALMA Science homepage] | |||
! [[File:CARTA_logo_text.png|100px|link=https://cartavis.org/]] | |||
| | |||
* [https://cartavis.org/ CARTA website] | |||
* [https://casadocs.readthedocs.io/en/v6.6.1/notebooks/carta.html CARTA section of the CASA docs] | |||
|- | |||
* [ | ! [[File:Casa_logo_full-200wide.png|75px|link=https://casa.nrao.edu]] | ||
* {{casadocs_6. | | style="vertical-align:bottom;" | | ||
* [https://casa.nrao.edu CASA homepage]: includes download and installation information | |||
* {{casadocs_6.6.1}} | |||
* [[CASA Tips]] | |||
* [[Getting Started in CASA]] | * [[Getting Started in CASA]] | ||
To cite CASA, please use:<br>[https://ui.adsabs.harvard.edu/abs/2022PASP..134k4501C/abstract \bibitem<nowiki>[CASA Team et al.(2022)]</nowiki>{2022PASP..134k4501C} CASA Team, Bean, B., Bhatnagar, S., et al.\ 2022, PASP, 134, 114501. doi:10.1088/1538-3873/ac9642] | |||
Production version for Cycle 11: '''CASA 6.6.1''' | |||
! <font size = 4> [https://almascience.nrao.edu/processing/science-pipeline/ Pipeline] <!--[[File:pipeline_logo.png|75px|link=https://almascience.nrao.edu/processing/science-pipeline/]]--> | |||
| style="vertical-align:bottom;" | | |||
* [https://almascience.nrao.edu/processing/science-pipeline ALMA Pipeline webpage] | |||
* [[ALMA Pipeline Known Issues]] | |||
To cite the ALMA pipeline, please use:<br>[https://ui.adsabs.harvard.edu/abs/2023PASP..135g4501H/abstract \bibitem<nowiki>[Hunter et al.(2023)]</nowiki>{2023PASP..135g4501H} Hunter, T.~R., Indebetouw, R., Brogan, C.~L., et al.\ 2023, PASP, 135, 074501. doi:10.1088/1538-3873/ace216] | |||
Production version for Cycle 11: '''Pipeline 2024.1.0.8''' | |||
|} | |||
<!-- | |||
;ALMA | |||
* [https://almascience.org/ ALMA Science homepage] | |||
;CASA | |||
* [https://casa.nrao.edu CASA homepage]: includes download and installation information | |||
* {{casadocs_6.6.1}} | |||
* [[CASA Tips]] | * [[CASA Tips]] | ||
* [[ | * [[Getting Started in CASA]] | ||
* [[How To Use A CASAGuide]] | * [[How To Use A CASAGuide]] | ||
* [[Extracting scripts from these tutorials]] | * [[Extracting scripts from these tutorials]] | ||
To cite CASA, please use:<br>[https://ui.adsabs.harvard.edu/abs/2022PASP..134k4501C/abstract \bibitem<nowiki>[CASA Team et al.(2022)]</nowiki>{2022PASP..134k4501C} CASA Team, Bean, B., Bhatnagar, S., et al.\ 2022, PASP, 134, 114501. doi:10.1088/1538-3873/ac9642] | |||
;Pipeline | |||
* [https://almascience.nrao.edu/processing/science-pipeline ALMA Pipeline webpage] | |||
* [[ALMA Pipeline Known Issues]] | |||
To cite the ALMA pipeline, please use:<br>[https://ui.adsabs.harvard.edu/abs/2023PASP..135g4501H/abstract \bibitem<nowiki>[Hunter et al.(2023)]</nowiki>{2023PASP..135g4501H} Hunter, T.~R., Indebetouw, R., Brogan, C.~L., et al.\ 2023, PASP, 135, 074501. doi:10.1088/1538-3873/ace216] | |||
;CARTA | |||
* [https://cartavis.org/ CARTA website] | |||
* [https://casadocs.readthedocs.io/en/v6.6.1/notebooks/carta.html CARTA section of the CASA docs] | |||
--> | |||
== | == Basic Imaging and Analysis == | ||
ALMA data are delivered to users with calibrations applied and they are ready for imaging. The following "First Look" tutorials provide short examples of common next steps a user may take with their calibrated data. These guides use an example ALMA observation of TW Hydra. | ALMA data are delivered to users with calibrations applied and they are ready for imaging. The following "First Look" tutorials provide short examples of common next steps a user may take with their calibrated data. These guides use an example ALMA observation of TW Hydra. | ||
{| class="wikitable" | |||
! [[First Look at Imaging]] (continuum) | |||
| | |||
This guide discusses '''continuum imaging''' and demonstrates both '''interactive and non-interactive tclean''' usage. Also discusses primary beam corrections. | |||
| style="text-align:center;" rowspan=4 | [[File:TWHya.png|150px]] | |||
|- | |||
! [[First Look at Self Calibration]] | |||
| | |||
This guide is the second in sequence. It is an in-depth exploration of '''self-calibration''', which discusses motivations and model creation, and follows a detailed step-by-step process for both '''phase self-calibration''' and '''amplitude self-calibration'''. | |||
|- | |||
! [[First Look at Line Imaging]] | |||
| | |||
This guide picks up where the self-calibration guide leaves off and demonstrates continuum range determination, '''continuum subtraction''', and imaging the molecular line. | |||
|- | |||
! [[First Look at Image Analysis]] | |||
| | |||
This guide uses the images created by the line imaging guide, and demonstrates '''image inspection''', statistics generation, moment maps, and file exporting. | |||
|- | |||
|} | |||
Older versions of these guides are archived here: [[ | Older versions of these guides are archived here: [[ALMA First Look]] | ||
<!-- | <!-- | ||
Community Day Tutorials: | Community Day Tutorials: | ||
| Line 34: | Line 92: | ||
--> | --> | ||
== Imaging == | == Advanced Imaging == | ||
{| class="wikitable" | |||
! [[ALMA Imaging Pipeline Reprocessing | Customized Pipeline Imaging]] | |||
| | |||
This guide describes how to use ALMA pipeline tasks to restore & modify images. | |||
|- | |||
! [[Guide to the NA Imaging Template | NA Manual Imaging Templates]] | |||
| This guide describes the template scripts used to manually image data for quality assurance by the North American ALMA Science Center (NAASC). | |||
|- | |||
! [[Automasking Guide | Automasking]] | |||
| This guide describes how to automatically mask clean regions during non-interactive cleaning. | |||
|- | |||
|} | |||
'''Jump to special imaging topics from the End to End guides:''' | |||
* [[AntennaeBand7_Imaging | AntennaeBand7 > Mosaic Imaging]] | |||
* [[IRAS16293_Band9_-_Imaging | IRAS16293 Band9 > Mosaic Imaging]] | |||
* [[M100_Band3_Combine | M100 Band3 > Data Combination]] | |||
* [[3C286_Band6Pol_Imaging | 3C286 Band6 > Full Polarization Imaging]] | |||
* [[Sunspot_Band6_Feathering | Sunspot Band6 > Data Combination]] | |||
== End to End Guides (Manual Calibration) == | |||
These guides are useful tools for those who would like to learn the process of calibration and imaging in detail. They use publicly-available [https://almascience.org/alma-data/science-verification ALMA Science Verification] data that illustrate several different ALMA capabilities. The links below lead to overview pages for each observation. The guides themselves are linked from the overview pages. | |||
{| class="wikitable" | |||
= | ! [[AntennaeBand7]] | ||
| | |||
Discusses full calibration of '''standard 12m interferometry data''' in Band 7 (345 GHz, 0.87mm), using an extended workflow to '''calibrate multiple ASDMs''' simultaneously. Primarily focuses on inspection of the data for flagging, and plotms commands to recreate plots typically included in a QA2 weblog. Also discusses imaging of '''mosaic data''' across two separate regions, including '''continuum subtraction''', '''self-calibration''', and generation of '''image cubes''' for the CO (3-2) spectral line. It concludes with image analysis via '''moment maps''' and '''file exporting'''. | |||
| style="text-align:center;" | [[File:604px-Antennae_galaxies_xl.jpg|100px]] | |||
|- | |||
! [[IRAS16293Band9]] | |||
| | |||
Discusses full calibration of 12m interferometry Band 9 ('''high frequency''', 650 GHz, 0.46 mm) data of a protostellar cluster, including inspection of the data for flagging, and plotms commands to recreate plots typically included in a QA2 weblog. Also discusses imaging of '''mosaic data''', including '''self-calibration''' and generation of '''image cubes''' and '''moment maps'''. | |||
| style="text-align:center;" | [[File:Intro.jpg|200px]] | |||
|- | |||
= | ! [[M100 Band3]] | ||
| | |||
Band 3 (100 GHz, 3 mm) on M100 demonstrates '''Single Dish''' (Total Power) data reduction and 12m, 7m, Total Power '''data combination''' procedures. | |||
| style="text-align:center;" | [[File:M100_NASA.jpg|100px]] | |||
|- | |||
! [[3C286 Polarization]] | |||
| | |||
Standard calibrations and '''polarization calibration''' (XX, XY, YX, YY) of 3c286 in Band 6 (230 GHz, 1.3 mm), a quasar frequently used as a flux calibrator source. '''Full Stokes imaging''' (IQUV), '''self-calibration''', and analysis of '''polarization intensity''' and '''polarization angle''' using both CARTA and numerical methods. | |||
| style="text-align:center;" | [[File:VLA_3c286.png|200px]] | |||
|- | |||
= | ! [[Sunspot Band6]] | ||
| | |||
Using Band 6 data (230 GHz, 1.3 mm) from a sunspot observation, this guide discusses '''solar observing techniques.''' Calibration and Imaging guides walk though the unique challenges presented by ALMA solar data. The Single Dish guide covers this process for the ALMA total power array. Finally, the Feathering guide covers '''combining interferometric images with single dish images'''. | |||
| style="text-align:center;" | [[File:Sunspot_SolarMonitor.png|150px]] | |||
|} | |||
== | == Special Topics == | ||
* [[ADMIT Products and Usage]]: This guide discusses how to use the ALMA Data-Mining Toolkit (ADMIT) and customize it for your data. | |||
* [[Analysis Utilities]]: A Python module containing utilities for analysis and plotting. | |||
* [[ | * [[ALMA Renormalization Correction | Renormalization]]: A fix for amplitude calibration issues caused by the ALMA normalization strategy for sources with strong line emission. | ||
* [[DataWeightsAndCombination | Data Weights]]: A guide to CASA data weights and how to ensure they are correct for data combination. Relevant for data from Cycles 0, 1, and 2. | |||
* [[ | * [[Guide To Simulating ALMA Data]]: An overview of simulation as it pertains to ALMA. | ||
* [[ | * [[Simulating Observations in CASA]]: All simulation guides (for ALMA, VLA, ngVLA, etc.) | ||
* [[ | |||
* [[Guide To | |||
* | |||
== Resources == | == Resources == | ||
* [ | * [[Archived ALMA CASAguides]] | ||
* [https://almascience. | * [https://almascience.org/about-alma/proposing/sensitivity-calculator ALMA Sensitivity Calculator] | ||
* [[Karl G. Jansky VLA Tutorials]] | * [[Karl G. Jansky VLA Tutorials]] | ||
* [[Past MM/Submm Guides]]: | * [[Past MM/Submm Guides]]: Old CASA guides for non-NRAO telescopes. | ||
<!-- | |||
[[ALMAguides_old_homepage]] | |||
[[ALMA_Tutorials_draft]] | |||
--> | |||
{| style="width: 100%; valign: top; background-color:#CCFFFF; border:1px solid #3366FF;" cellpadding=1 | {| style="width: 100%; valign: top; background-color:#CCFFFF; border:1px solid #3366FF;" cellpadding=1 | ||
Latest revision as of 21:54, 22 November 2024
Introduction
This page contains tutorials to guide ALMA users through some common types of data imaging and analysis using CASA with example ALMA datasets. Here are some links to get started:

|
|||
|---|---|---|---|

|
To cite CASA, please use: Production version for Cycle 11: CASA 6.6.1 |
Pipeline |
To cite the ALMA pipeline, please use: Production version for Cycle 11: Pipeline 2024.1.0.8 |
Basic Imaging and Analysis
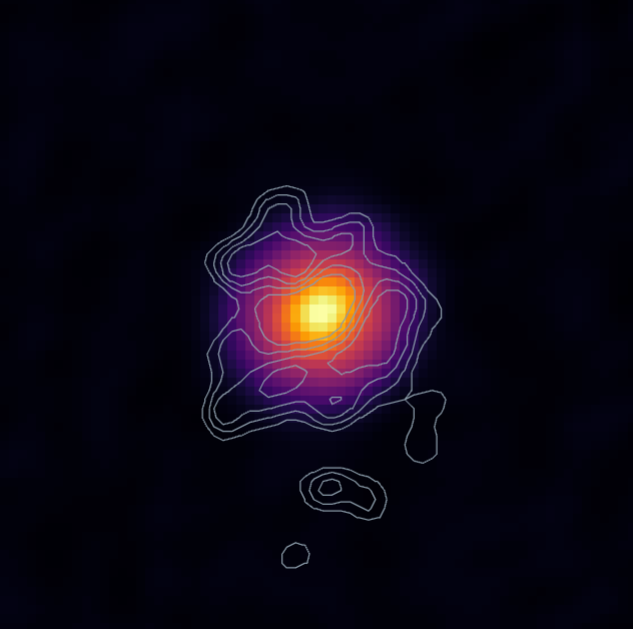
ALMA data are delivered to users with calibrations applied and they are ready for imaging. The following "First Look" tutorials provide short examples of common next steps a user may take with their calibrated data. These guides use an example ALMA observation of TW Hydra.
| First Look at Imaging (continuum) |
This guide discusses continuum imaging and demonstrates both interactive and non-interactive tclean usage. Also discusses primary beam corrections. |
|
|---|---|---|
| First Look at Self Calibration |
This guide is the second in sequence. It is an in-depth exploration of self-calibration, which discusses motivations and model creation, and follows a detailed step-by-step process for both phase self-calibration and amplitude self-calibration. | |
| First Look at Line Imaging |
This guide picks up where the self-calibration guide leaves off and demonstrates continuum range determination, continuum subtraction, and imaging the molecular line. | |
| First Look at Image Analysis |
This guide uses the images created by the line imaging guide, and demonstrates image inspection, statistics generation, moment maps, and file exporting. |
Older versions of these guides are archived here: ALMA First Look
Advanced Imaging
| Customized Pipeline Imaging |
This guide describes how to use ALMA pipeline tasks to restore & modify images. |
|---|---|
| NA Manual Imaging Templates | This guide describes the template scripts used to manually image data for quality assurance by the North American ALMA Science Center (NAASC). |
| Automasking | This guide describes how to automatically mask clean regions during non-interactive cleaning. |
Jump to special imaging topics from the End to End guides:
- AntennaeBand7 > Mosaic Imaging
- IRAS16293 Band9 > Mosaic Imaging
- M100 Band3 > Data Combination
- 3C286 Band6 > Full Polarization Imaging
- Sunspot Band6 > Data Combination
End to End Guides (Manual Calibration)
These guides are useful tools for those who would like to learn the process of calibration and imaging in detail. They use publicly-available ALMA Science Verification data that illustrate several different ALMA capabilities. The links below lead to overview pages for each observation. The guides themselves are linked from the overview pages.
| AntennaeBand7 |
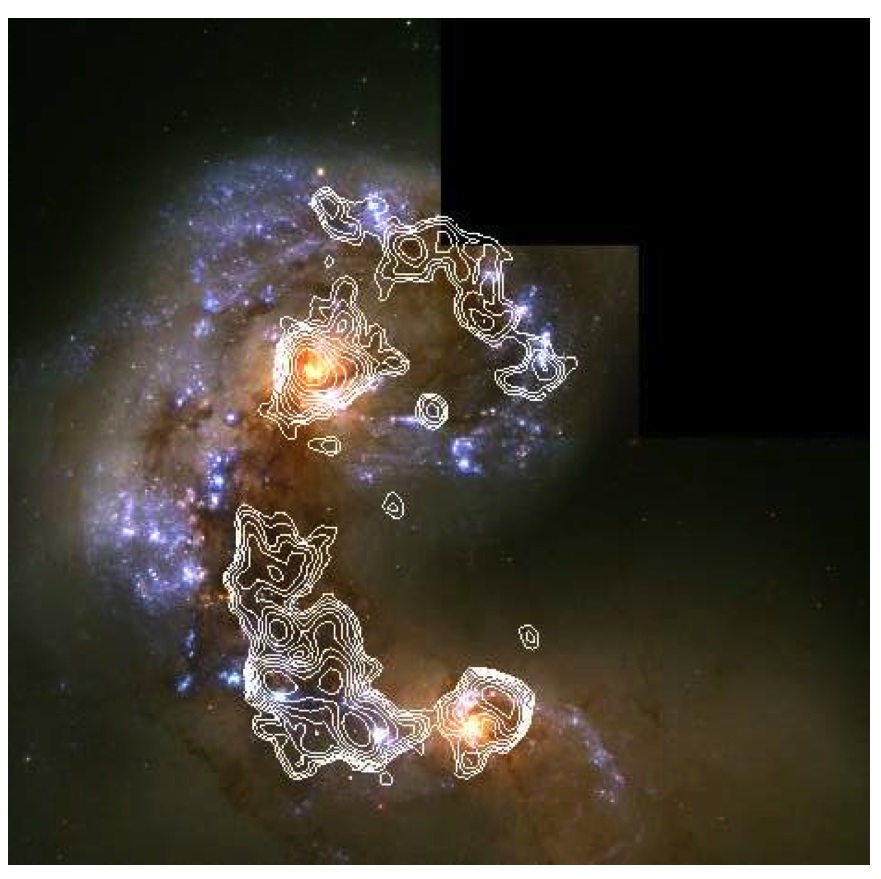
Discusses full calibration of standard 12m interferometry data in Band 7 (345 GHz, 0.87mm), using an extended workflow to calibrate multiple ASDMs simultaneously. Primarily focuses on inspection of the data for flagging, and plotms commands to recreate plots typically included in a QA2 weblog. Also discusses imaging of mosaic data across two separate regions, including continuum subtraction, self-calibration, and generation of image cubes for the CO (3-2) spectral line. It concludes with image analysis via moment maps and file exporting. |
|
|---|---|---|
| IRAS16293Band9 |
Discusses full calibration of 12m interferometry Band 9 (high frequency, 650 GHz, 0.46 mm) data of a protostellar cluster, including inspection of the data for flagging, and plotms commands to recreate plots typically included in a QA2 weblog. Also discusses imaging of mosaic data, including self-calibration and generation of image cubes and moment maps. |

|
| M100 Band3 |
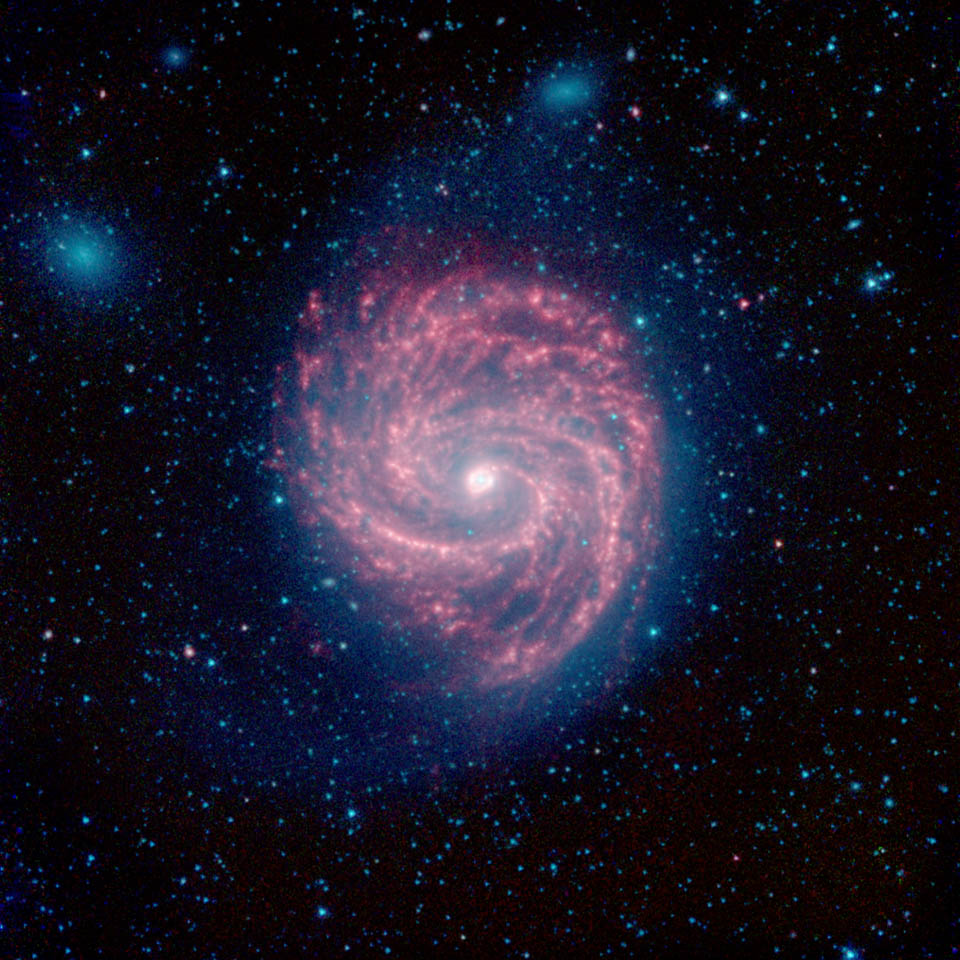
Band 3 (100 GHz, 3 mm) on M100 demonstrates Single Dish (Total Power) data reduction and 12m, 7m, Total Power data combination procedures. |
|
| 3C286 Polarization |
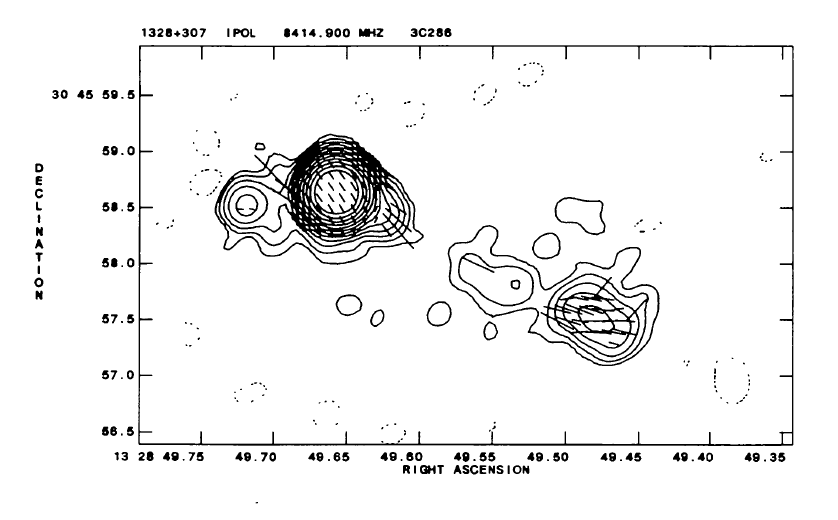
Standard calibrations and polarization calibration (XX, XY, YX, YY) of 3c286 in Band 6 (230 GHz, 1.3 mm), a quasar frequently used as a flux calibrator source. Full Stokes imaging (IQUV), self-calibration, and analysis of polarization intensity and polarization angle using both CARTA and numerical methods. |
|
| Sunspot Band6 |
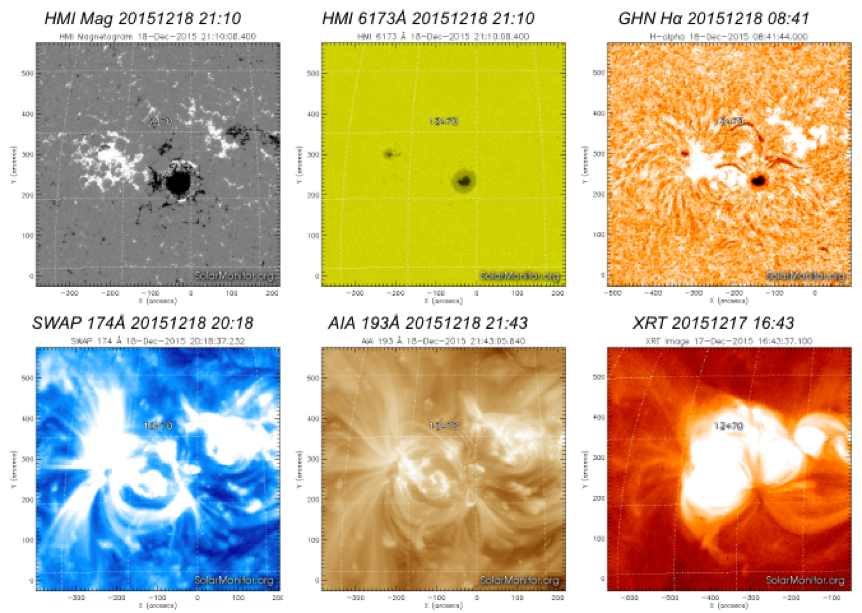
Using Band 6 data (230 GHz, 1.3 mm) from a sunspot observation, this guide discusses solar observing techniques. Calibration and Imaging guides walk though the unique challenges presented by ALMA solar data. The Single Dish guide covers this process for the ALMA total power array. Finally, the Feathering guide covers combining interferometric images with single dish images. |
|
Special Topics
- ADMIT Products and Usage: This guide discusses how to use the ALMA Data-Mining Toolkit (ADMIT) and customize it for your data.
- Analysis Utilities: A Python module containing utilities for analysis and plotting.
- Renormalization: A fix for amplitude calibration issues caused by the ALMA normalization strategy for sources with strong line emission.
- Data Weights: A guide to CASA data weights and how to ensure they are correct for data combination. Relevant for data from Cycles 0, 1, and 2.
- Guide To Simulating ALMA Data: An overview of simulation as it pertains to ALMA.
- Simulating Observations in CASA: All simulation guides (for ALMA, VLA, ngVLA, etc.)
Resources
- Archived ALMA CASAguides
- ALMA Sensitivity Calculator
- Karl G. Jansky VLA Tutorials
- Past MM/Submm Guides: Old CASA guides for non-NRAO telescopes.
 |
 |
 |
|
