EVLA high frequency spectral line tutorial - IRC+10216 - imaging
This tutorial picks up where EVLA high frequency spectral line tutorial - IRC+10216 - calibration leaves off.
Imaging
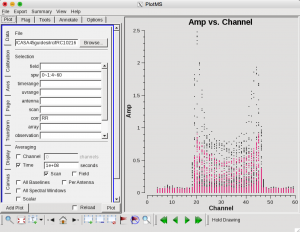
The continuum-subtracted spectral line data is contained in IRC10216_spls.ms. Use plotms to plot the lines.
plotms(vis='IRC10216_spls.ms', xaxis='channel', yaxis='amp',
       avgtime='1e8', avgscan=T, coloraxis='spw')
Now it is time to image the visibility data using clean. For illustration, we will clean channel 22 of the SiS line.
# In CASA
clean(vis='IRC10216_spls.ms', imagename='ch22', spw='1:22~22',
      mode='channel', nchan=1, start='', width=1, niter=100000,
      gain=0.1, threshold='3.0mJy', psfmode='clark', imagermode='csclean',
      interactive=T, npercycle=100, imsize=300, cell=['0.4arcsec', '0.4arcsec'],
      stokes='I', weighting='briggs', robust=0.5)
After running the above command, make a region in the CASA viewer. Double-click inside the region and clean by clicking the green circular arrow. After each cycle, click the green circular arrow again if the flux inside the region is brighter than the flux peaks outside the region. When you are finished cleaning, click the red 'STOP' button.
Open the resulting image using the viewer.
# In CASA
viewer("ch22.image")
In the viewer, make a region and click inside it to get statistics about the portion of the image in the region.
Analyze the Image Cubes
Open the HC3N image cube in the viewer.
# In CASA
viewer("IRC10216_HC3N.image")
Click the 'Play' button to view all channels in the cube. Select Tool --> Spectral profile... from the pull down menu. Create a region on the image to view the spectrum within the region.
Open the SiS image cube in the viewer.
# In CASA
viewer("IRC10216_SiS.image")
Determine what channels in the cube have emission. Then make moment maps using immoments.
# In CASA
immoments(imagename="IRC10216_SiS.image", moments=[0], axis="spectral",
          chans="12~40", outfile="IRC10216_Sis.mom0")
Open the moment map in the viewer.
# In CASA
viewer("IRC10216_Sis.mom0")
Overlay contours by selecting Data --> Open from the pull down menu, selecting the moment-0 map, and clicking 'contour map'.
--Crystal Brogan --additions:Juergen Ott
Last checked on CASA Version 3.3.0.
