Data flagging with plotms
Casaplotms is (currently) a standalone tool to inspect and edit measurement sets. This tutorial demonstrates how to use casaplotms to edit a multisource continuum data set: VLA program AU079, which consists of L-band (20 cm) continuum observations of galaxies and calibrator sources. It is the same data set used in the Imaging Flanking Fields tutorial, as well as the Data flagging with viewer tutorial.
Loading the Measurement Set into Casaplotms
As described in the Imaging Flanking Fields tutorial, the data may be loaded into CASA using the importvla command. The following commands import the data into the measurement set au079.ms and exit CASA to the command line.
# import the glob command for filename searching with wildcards
from glob import glob

# Define the list of files for reading. Use glob to perform wildcard matching with VLA archive filenames.
fileList = glob('AU079_*.xp?')

importvla(archivefiles=fileList,vis='au079.ms')
exit()
Now start up casaplotms from the command line.
# in bash
casaplotms
|
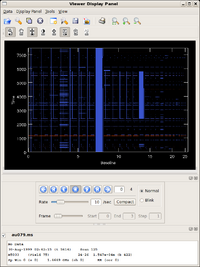
The figure at right shows the default viewer display for a measurement set. The axes are (y) time and (x) baseline, or antenna pair, enumerated by the common antenna number of the pair. Flagged data are highlighted in pale blue. Another window, titled Data Display Options, will also appear, allowing you to alter the display and flagging options. |
|
|
--Jack Gallimore 14:38, 1 December 2009 (UTC)
