Uploads by Rminchin
From CASA Guides
Jump to navigationJump to search
This special page shows all uploaded files.
| Date | Name | Thumbnail | Size | Description | Versions |
|---|---|---|---|---|---|
| 23:42, 31 January 2023 | Spectrum plot colors 6.5.2.png (file) | 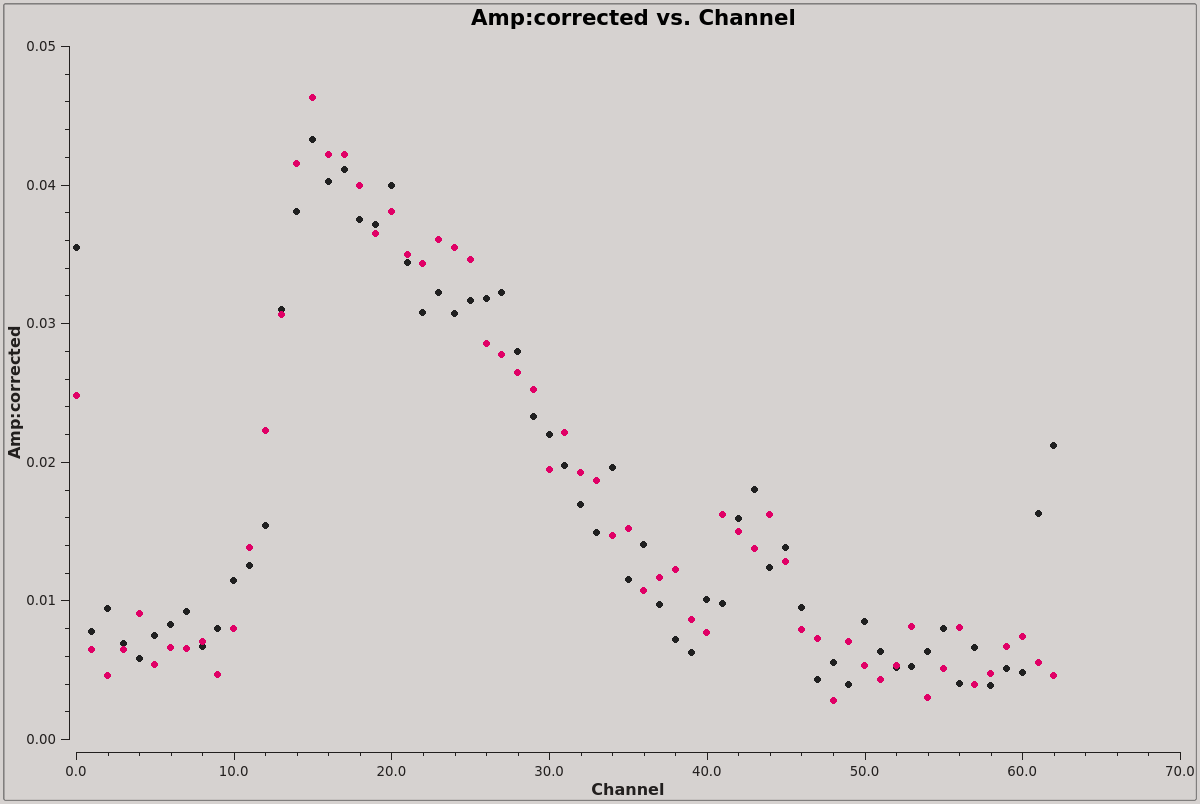 |
26 KB | Integrated spectrum plotted with colors showing the two polarizations | 1 |
| 23:19, 31 January 2023 | Gainphase vs channel 6.5.2.png (file) | 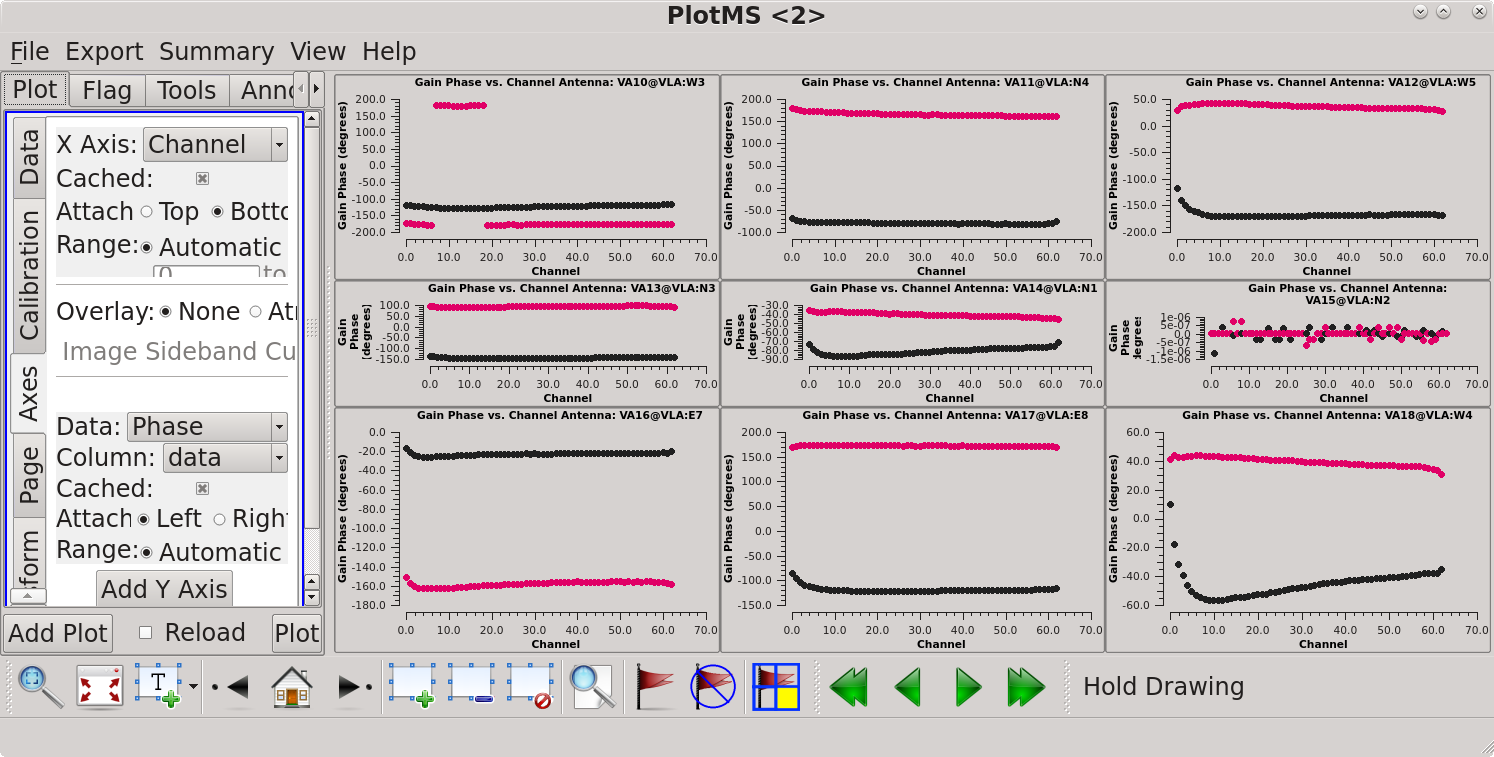 |
208 KB | Gain phase vs channel in plotms | 1 |
| 23:19, 31 January 2023 | Gainamp vs channel 6.5.2.png (file) | 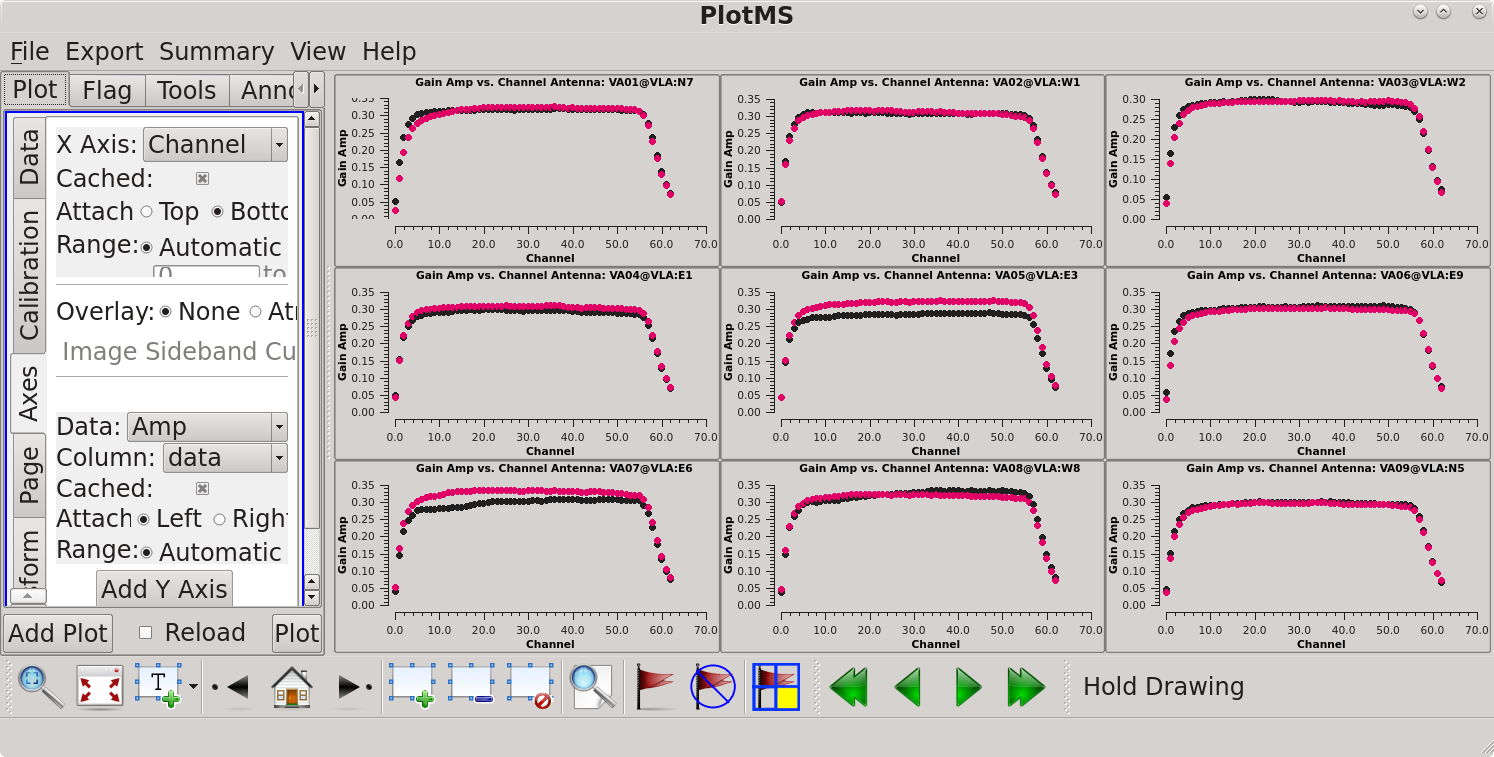 |
196 KB | Gain amp vs channel in plotms | 1 |
| 23:11, 31 January 2023 | Amp vs time 6.5.2.png (file) | 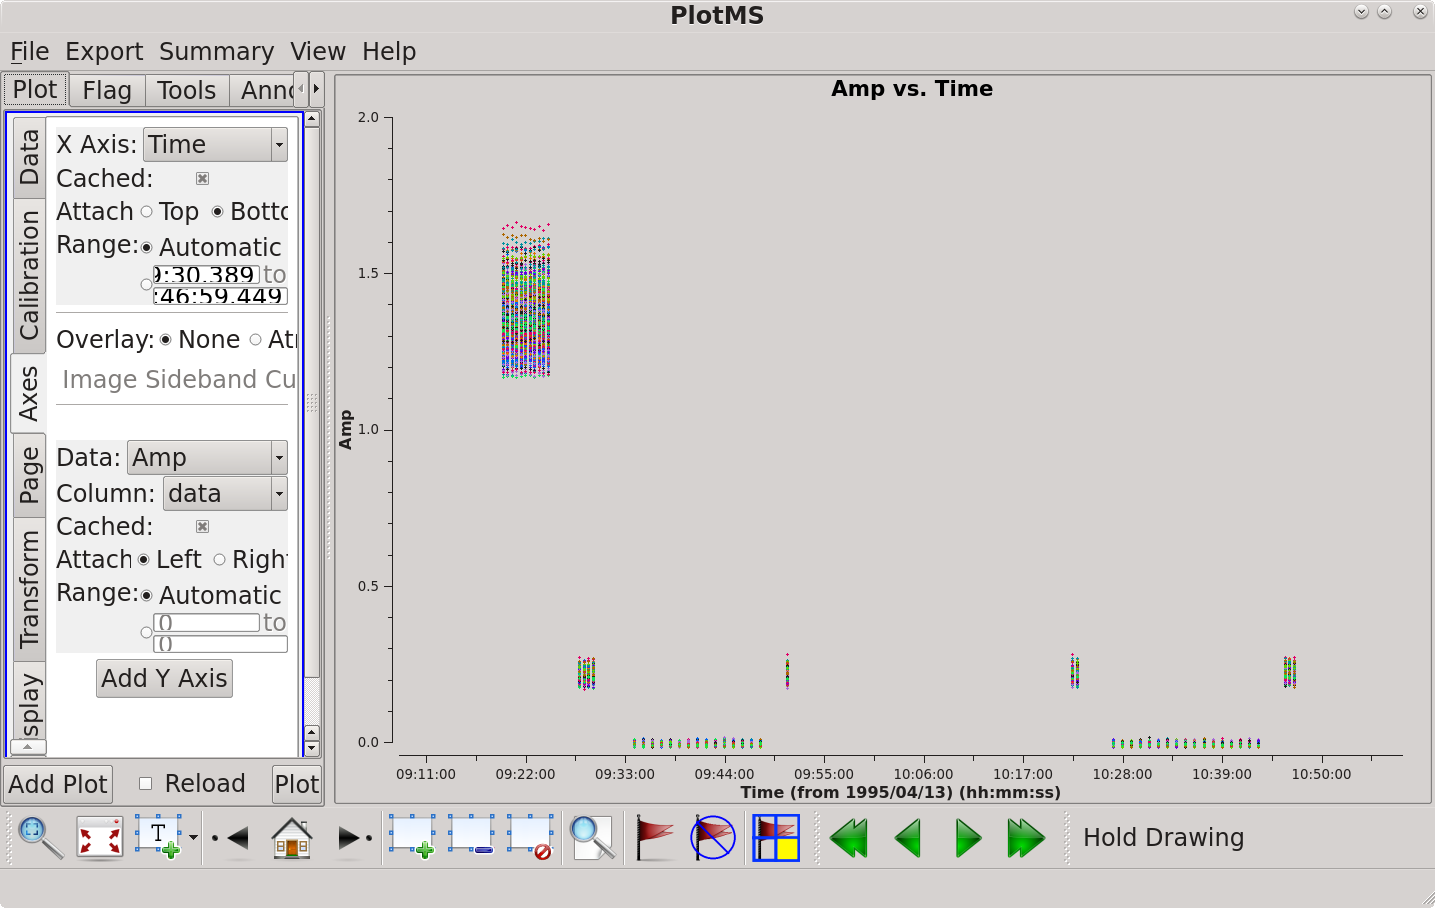 |
171 KB | Amplitude vs time in plotms | 1 |
| 23:04, 31 January 2023 | Amp vs channel 6.5.2.png (file) | 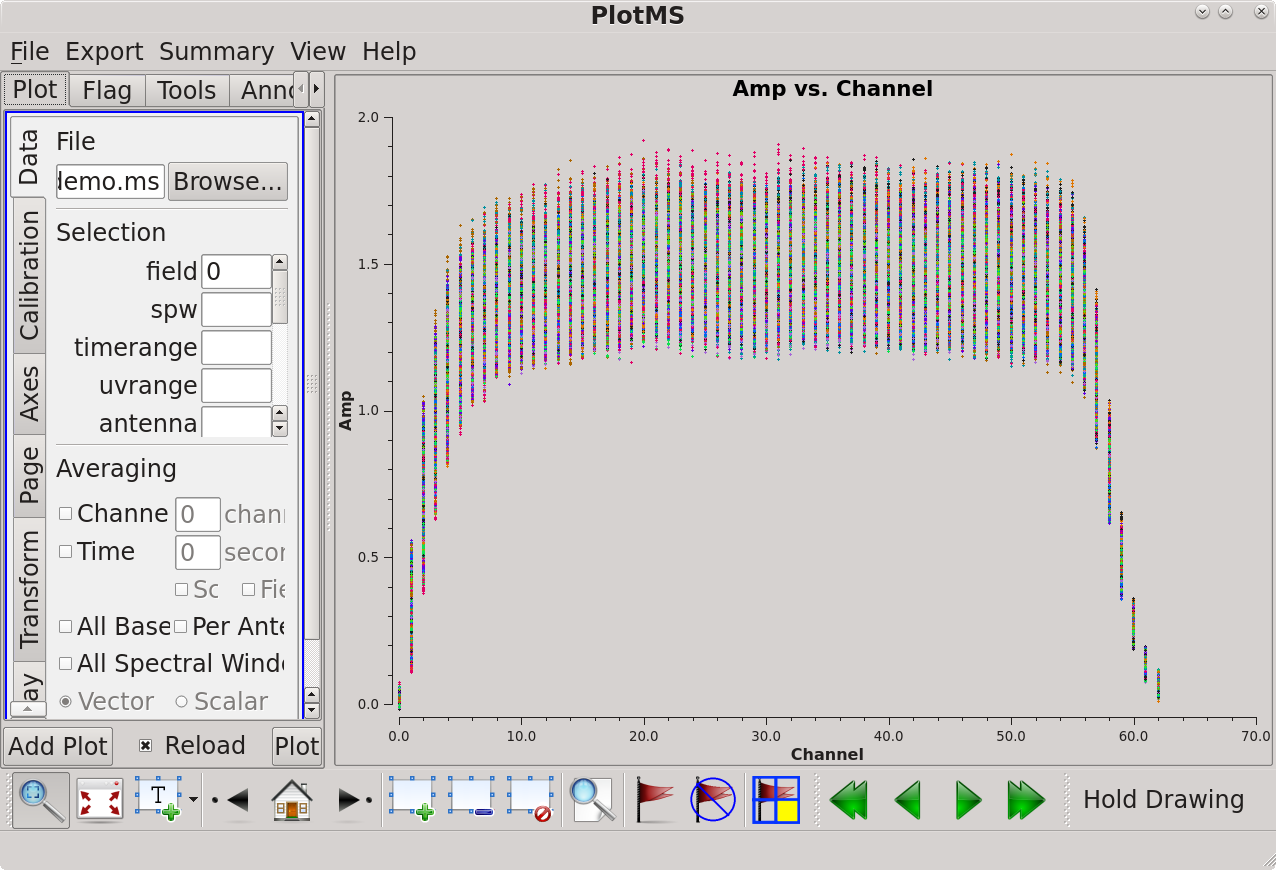 |
202 KB | Amplitude vs channel shown in plotms | 1 |
| 22:59, 31 January 2023 | CARTA dirty cube 6.5.2.png (file) | 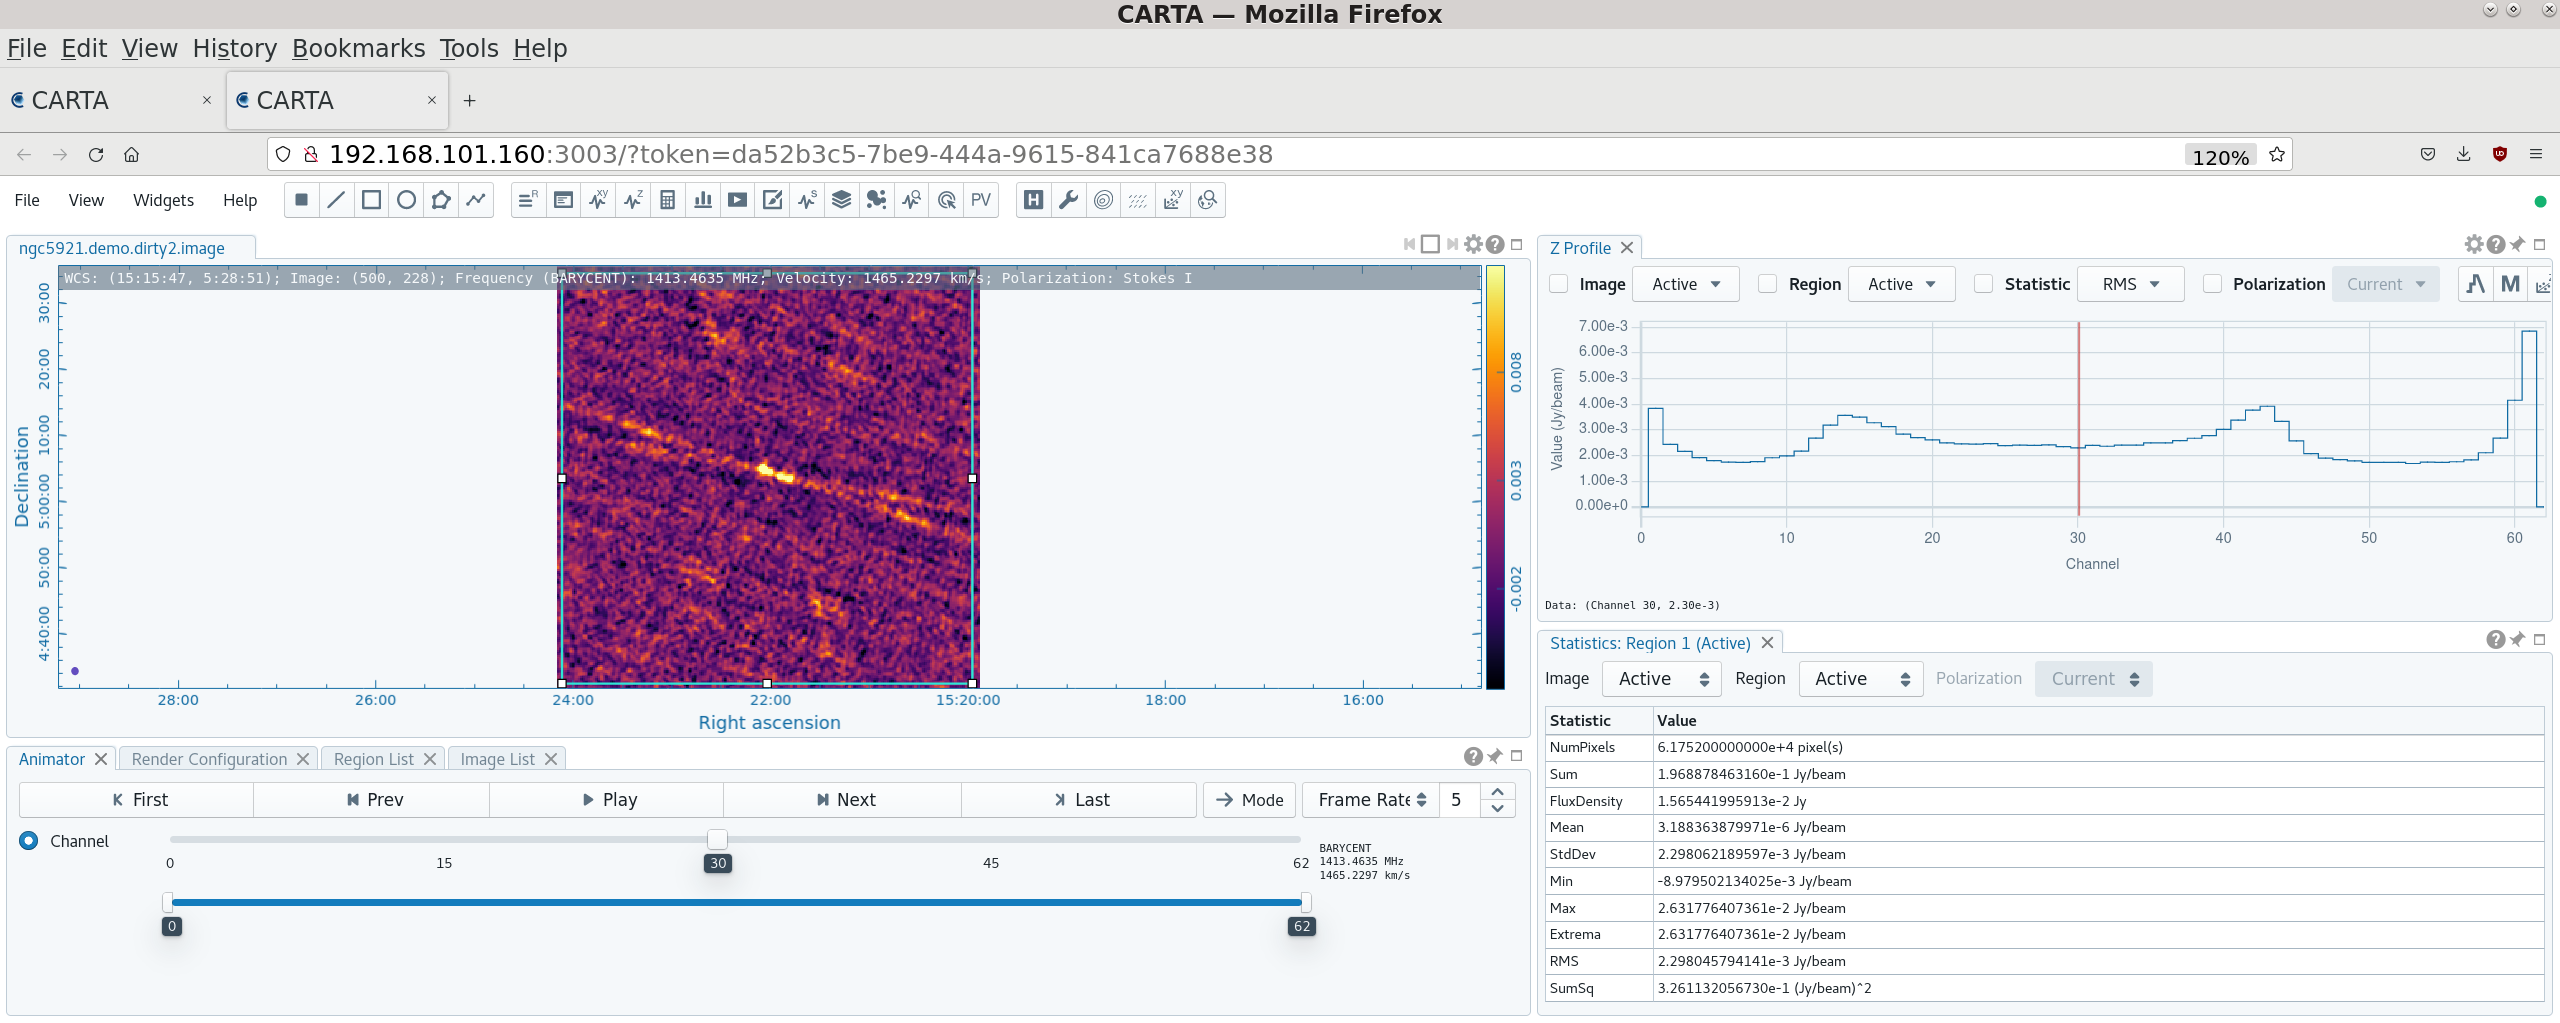 |
462 KB | Single channel of a dirty cube shown in CARTA | 1 |
| 22:46, 31 January 2023 | Plotants 6.5.2.png (file) | 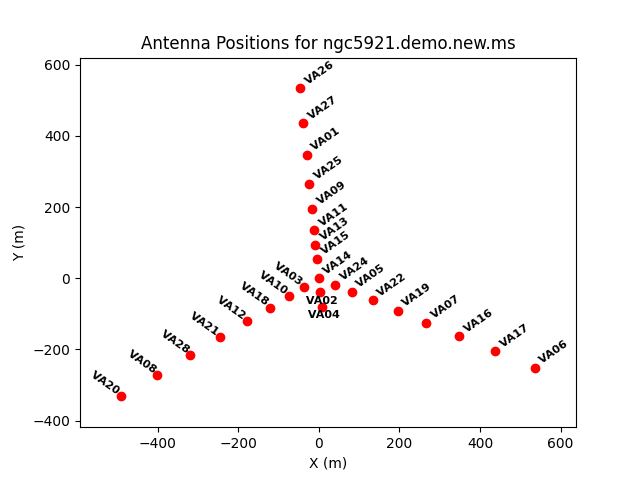 |
45 KB | Output of the plotants task | 1 |
| 22:25, 31 January 2023 | Spectrum-integrated 6.5.2.png (file) | 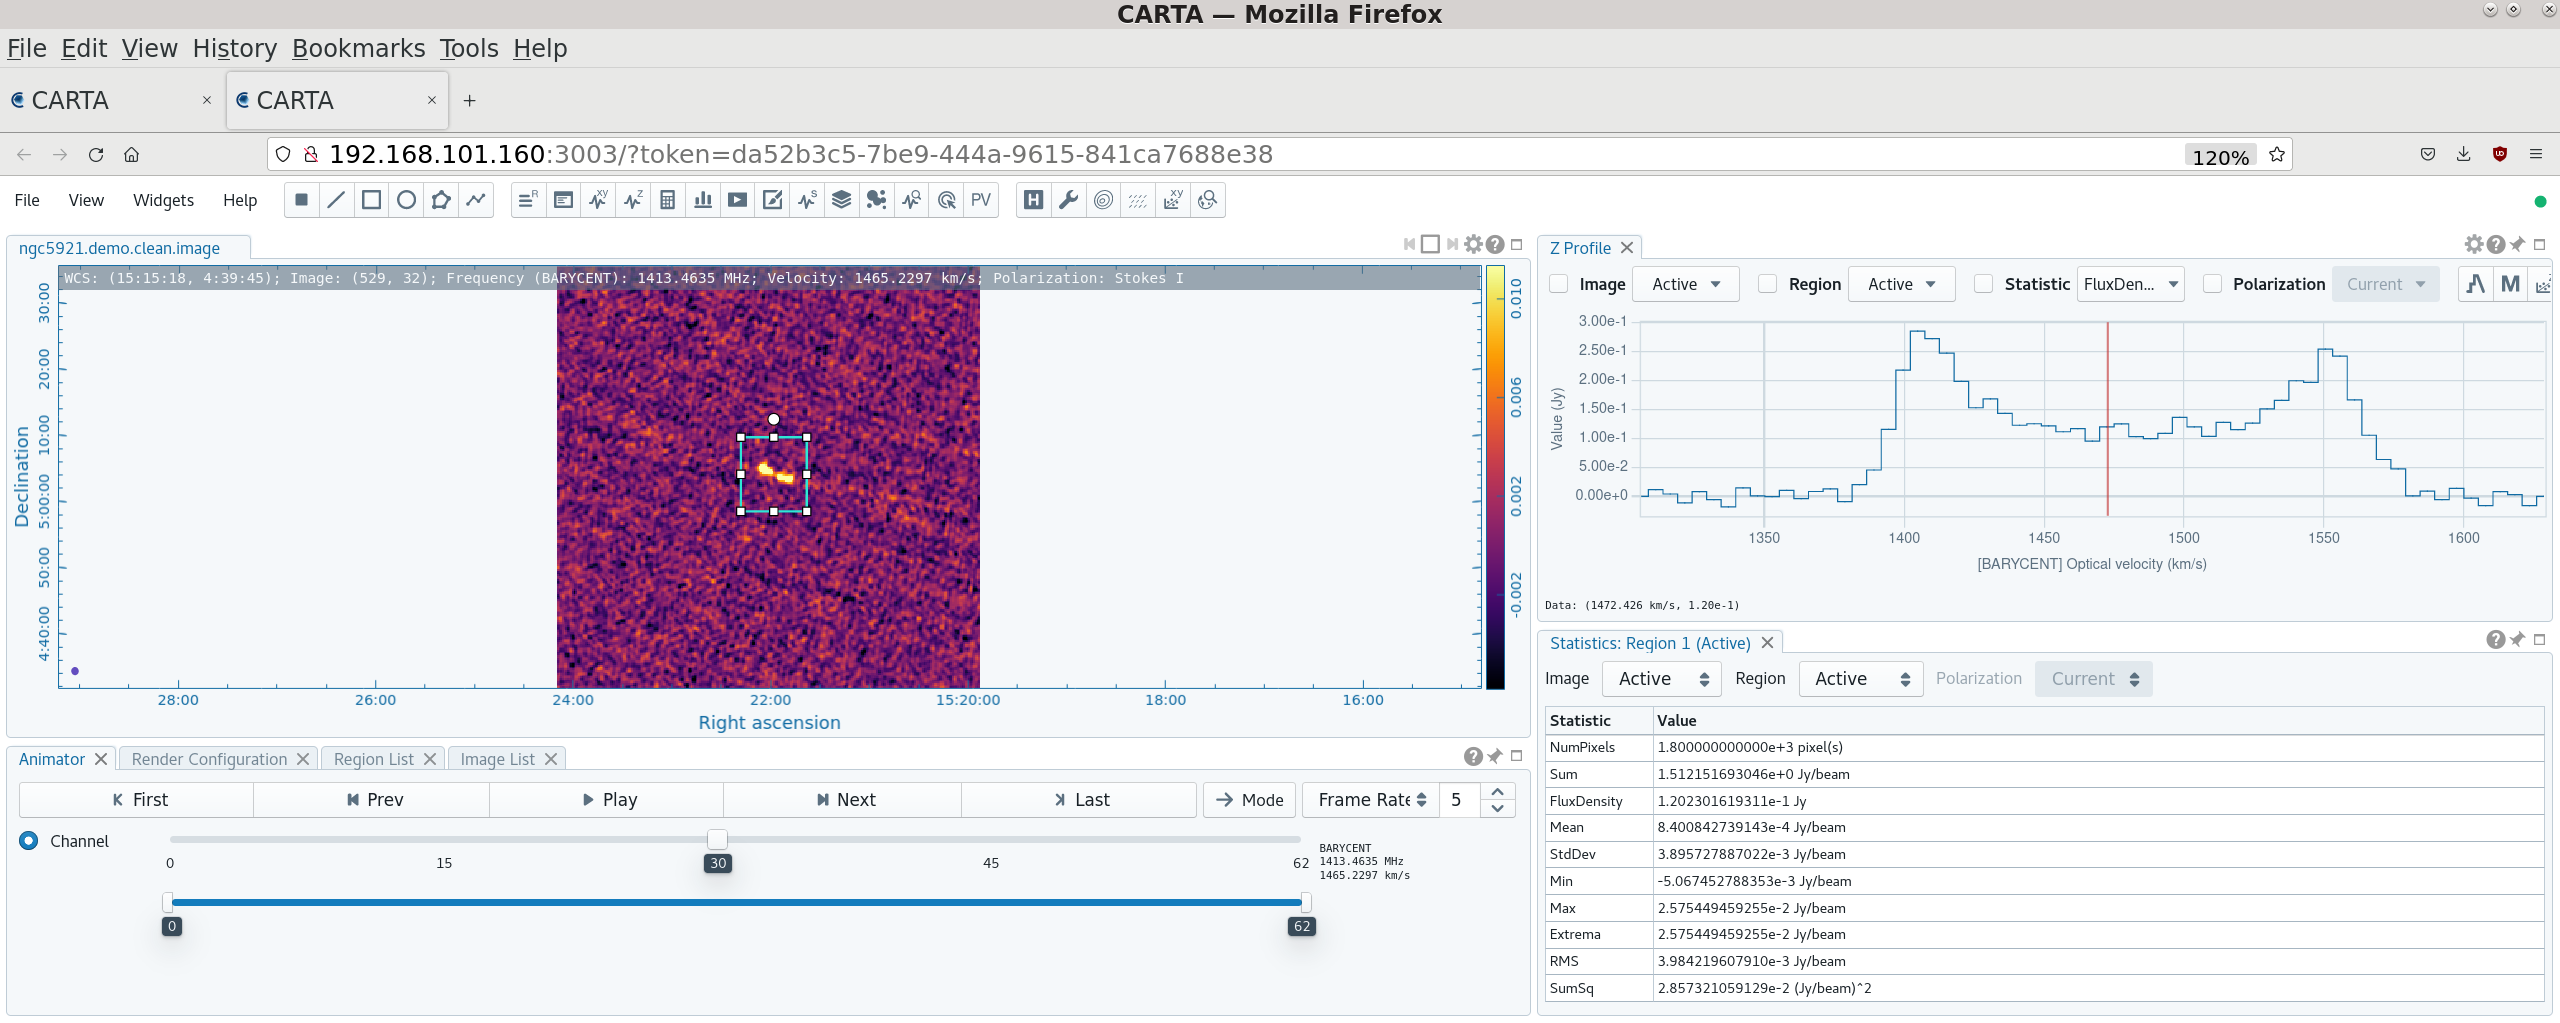 |
464 KB | CARTA image plane with rectangular region window and spectrum display within the region | 1 |
| 22:23, 31 January 2023 | Mom0 mom1 casa6 5 2.png (file) | 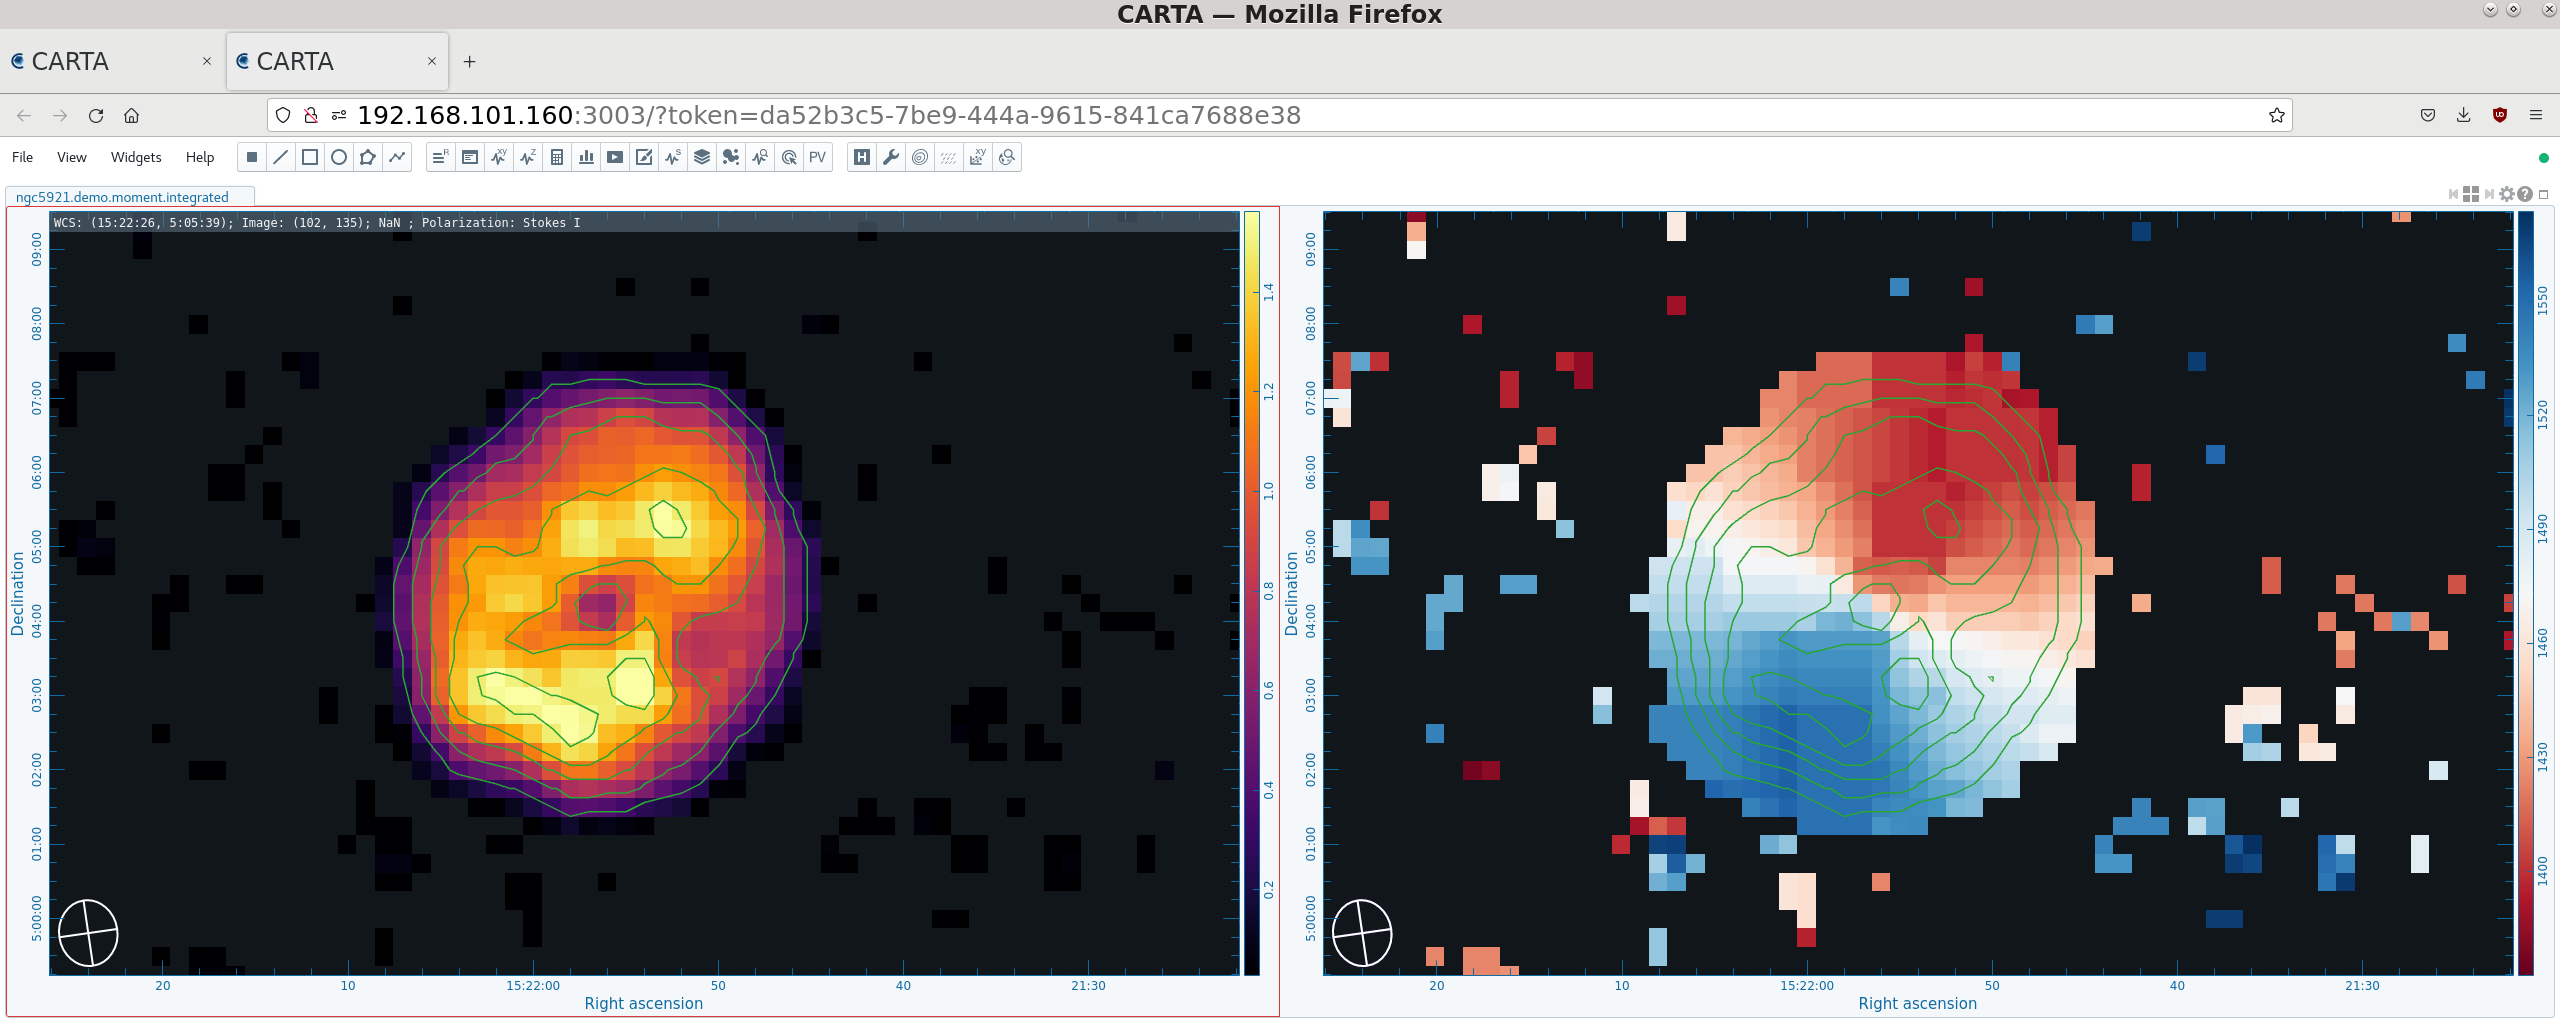 |
177 KB | Moment 0 and Moment 1 maps in CARTA | 1 |