Uploads by Aleroy
From CASA Guides
Jump to navigationJump to search
This special page shows all uploaded files.
| Date | Name | Thumbnail | Size | Description | Versions |
|---|---|---|---|---|---|
| 18:50, 4 August 2011 | Uid A002 X1ff7b0 X1c8.tsys vs time.png (file) |  |
40 KB | Tsys vs. time for uid_A002_X1ff7b0_X1c8 spw 1, channel 1200. Separate plots for each antenna. | 1 |
| 19:08, 4 August 2011 | Uid A002 X1ff7b0 X1c8.tsys vs time.page1.png (file) |  |
51 KB | Tsys vs. time for first 8 antennas. | 1 |
| 19:09, 4 August 2011 | Uid A002 X1ff7b0 X1c8.tsys vs time.page2.png (file) |  |
25 KB | Tsys vs. time for remaining antennas. | 1 |
| 19:40, 4 August 2011 | Uid A002 X1ff7b0 X1c8.tsys vs freq.page2.png (file) |  |
28 KB | Tsys vs. frequency for first data set. | 1 |
| 19:43, 4 August 2011 | Uid A002 X1ff7b0 X1c8.tsys vs freq.page1.png (file) |  |
70 KB | Tsys vs. frequency for first data set. | 1 |
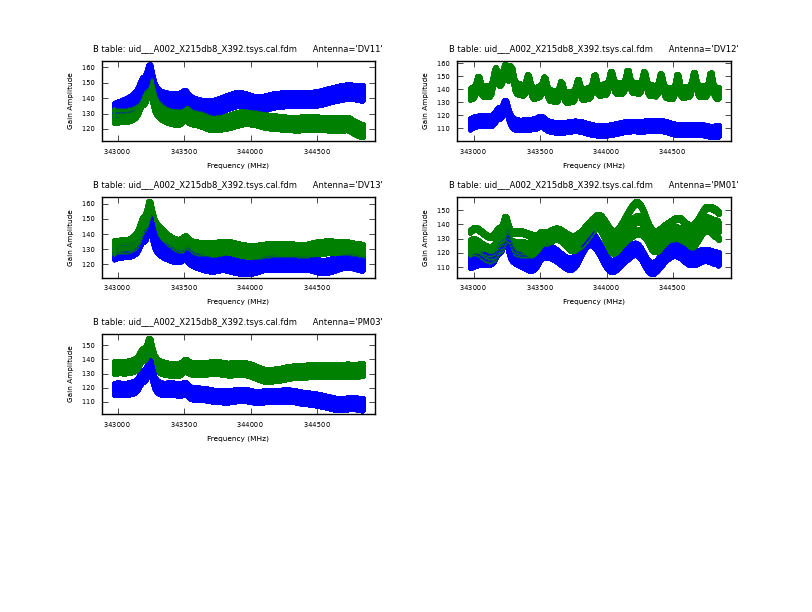
| 14:08, 24 August 2011 | Uid A002 X215db8 X392.tsys vs freq.page2.png (file) |  |
45 KB | 1 | |
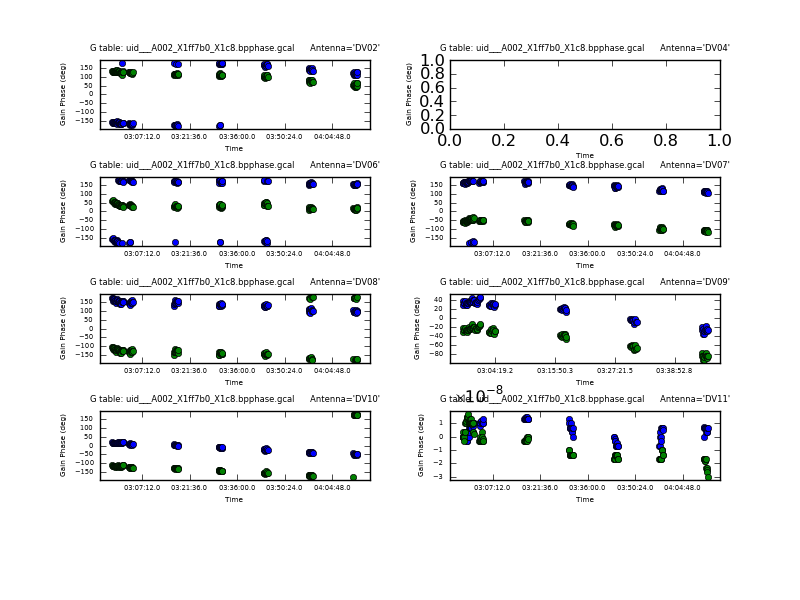
| 16:08, 24 August 2011 | Uid A002 X1ff7b0 X1c8.bpphase.page1.png (file) |  |
75 KB | 2 | |
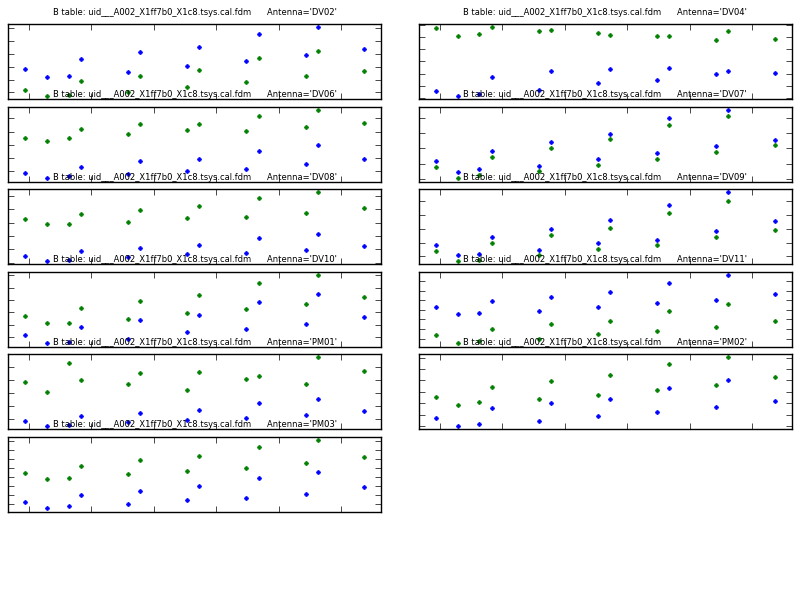
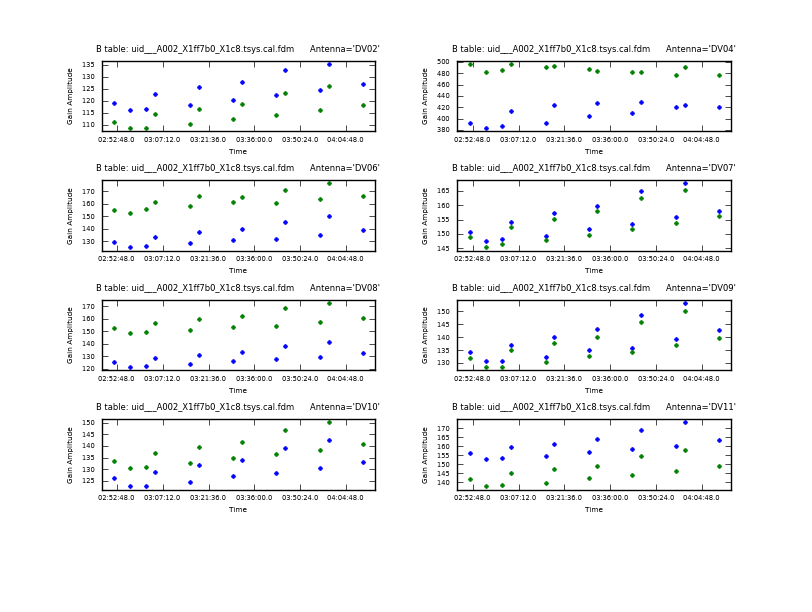
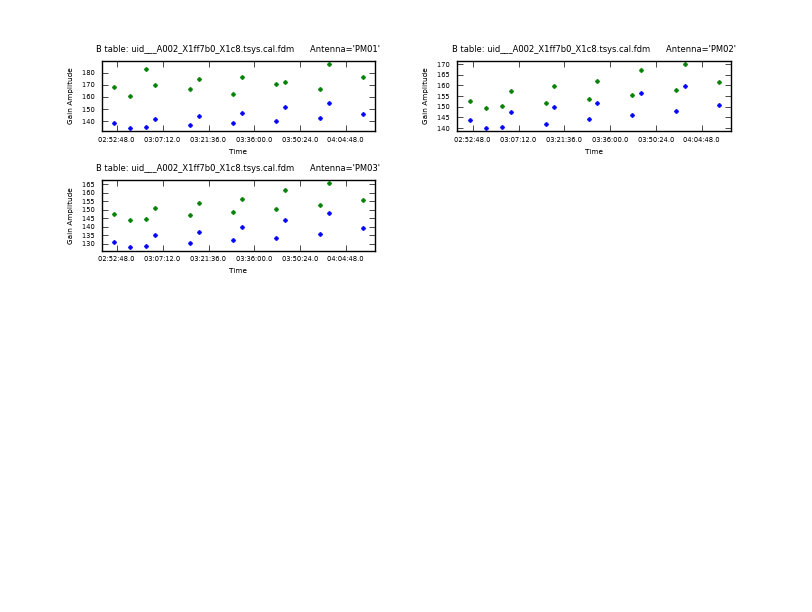
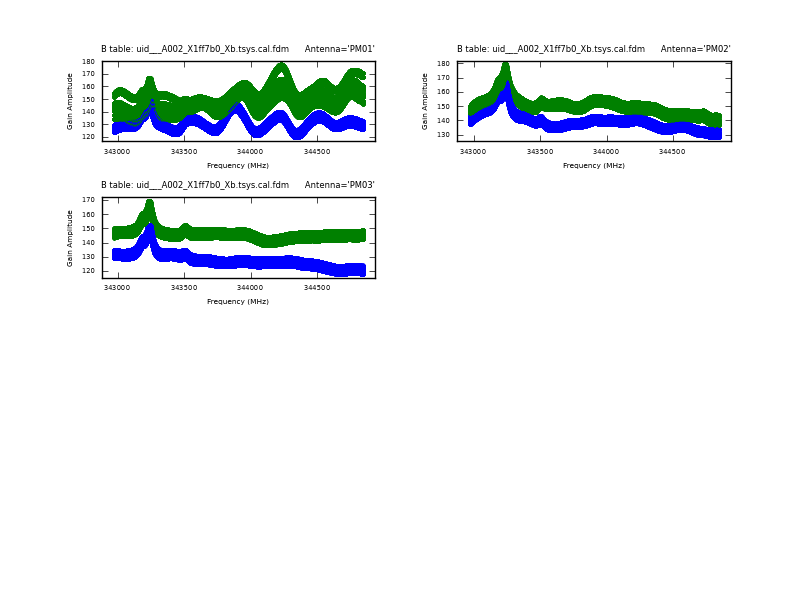
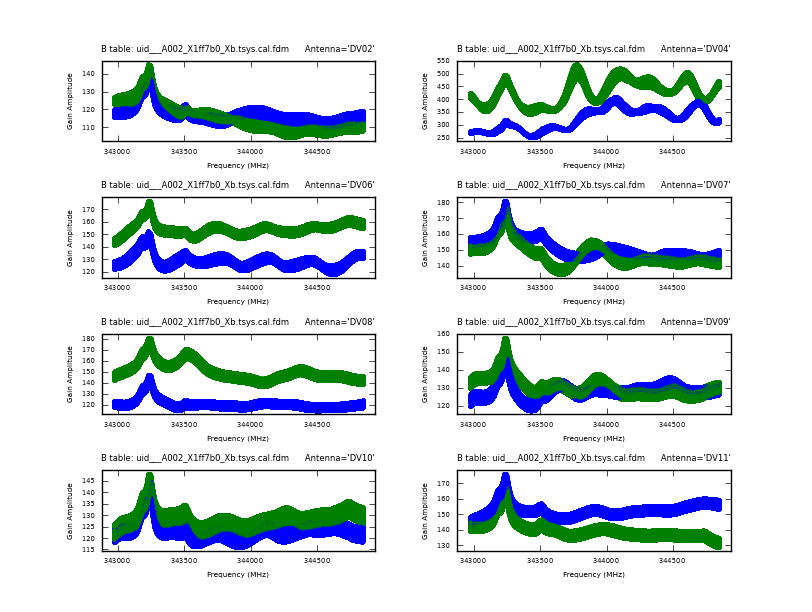
| 16:09, 24 August 2011 | Uid A002 X1ff7b0 Xb.bcal amp.page1.png (file) |  |
167 KB | 2 | |
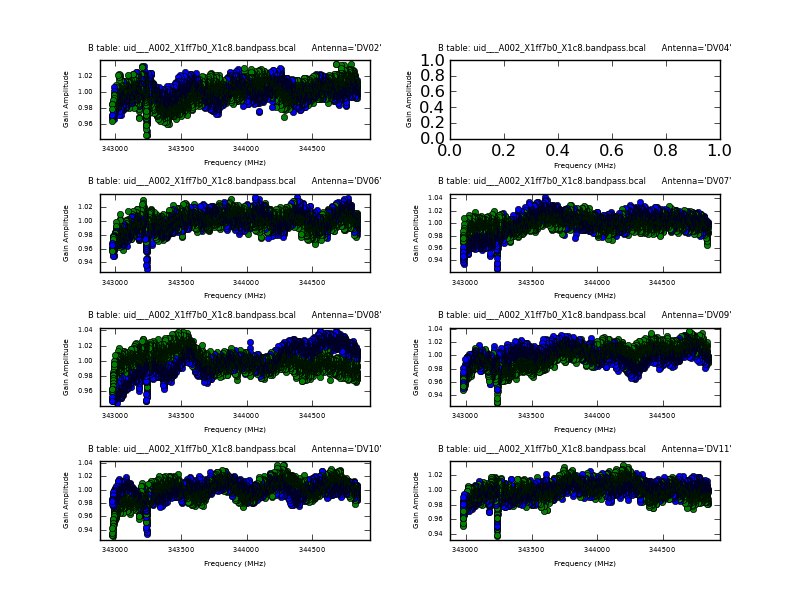
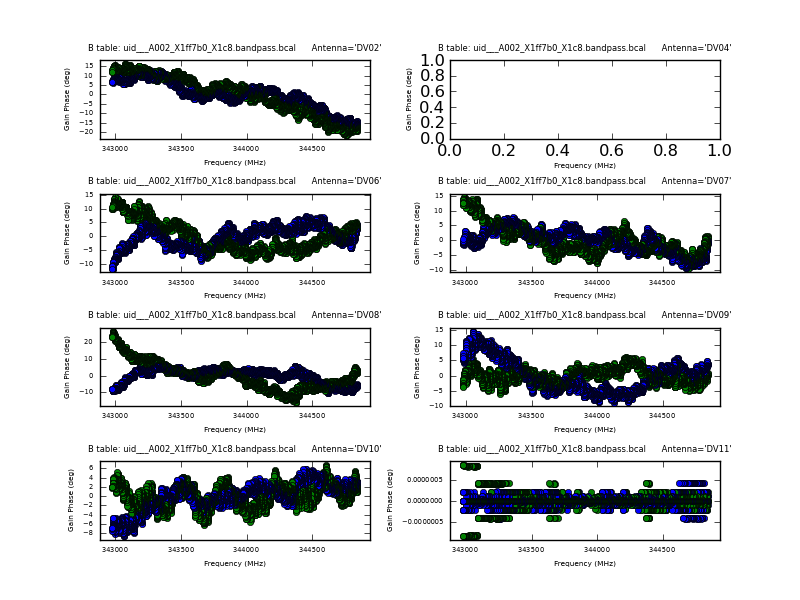
| 16:10, 24 August 2011 | Uid A002 X1ff7b0 Xb.bcal phase.page1.png (file) |  |
139 KB | 2 | |
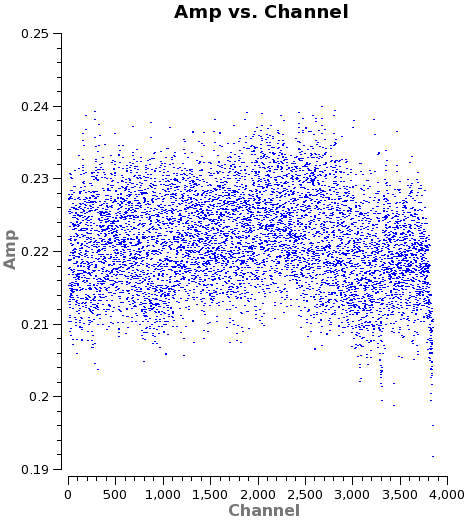
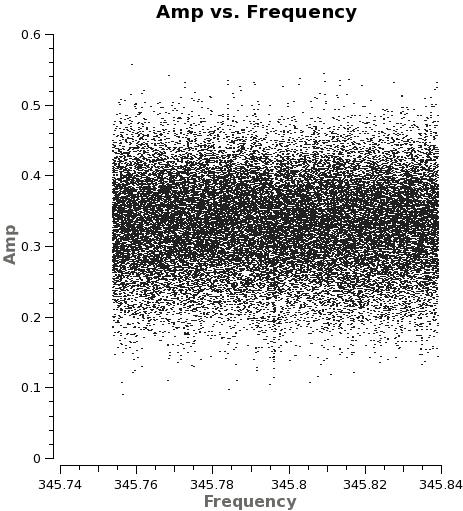
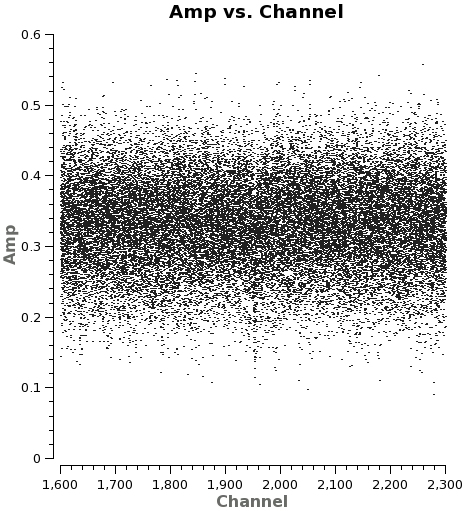
| 11:05, 25 August 2011 | Amp vs channel example.png (file) |  |
22 KB | 1 | |
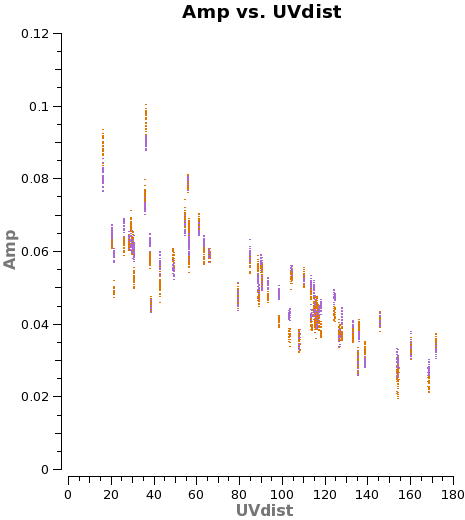
| 11:21, 25 August 2011 | Amp vs uv titan obs.png (file) |  |
14 KB | 1 | |
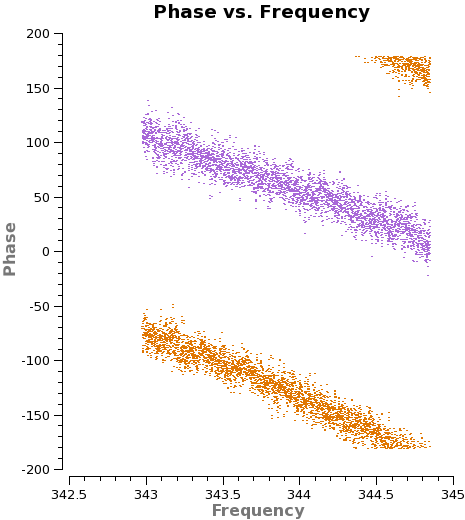
| 11:37, 25 August 2011 | Phase vs freq DV13.png (file) |  |
19 KB | 1 | |
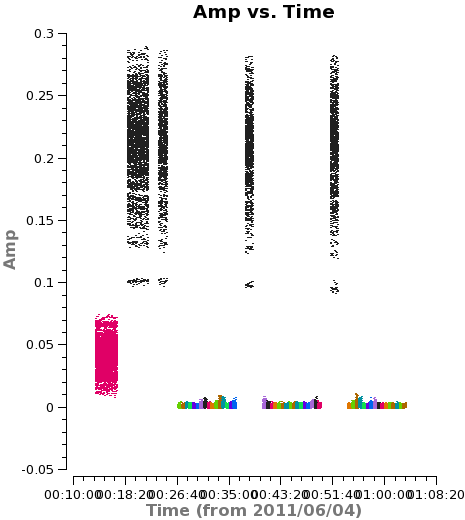
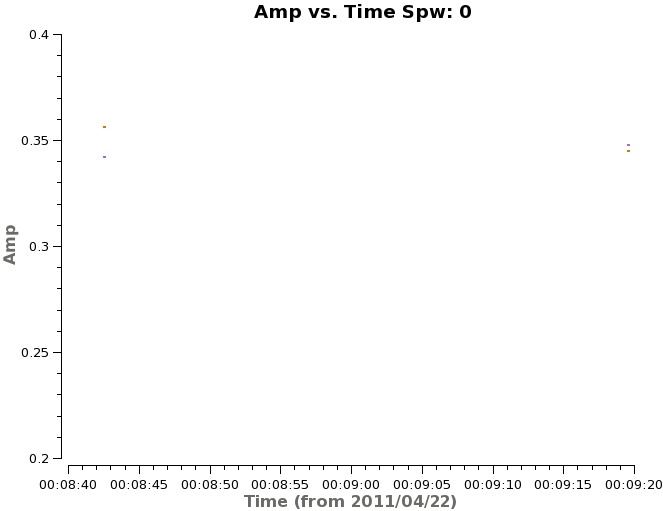
| 11:41, 25 August 2011 | Amp vs time missing scans.png (file) |  |
17 KB | Amplitude vs. time with data colorized by field for one of the data sets missing a final visit to the phase calibrator. We flag a time range that covers the last visit to the source so that we include only source data flanked in time by visits to the cali | 1 |
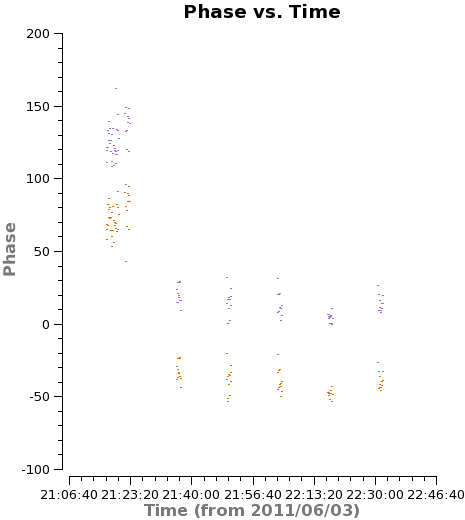
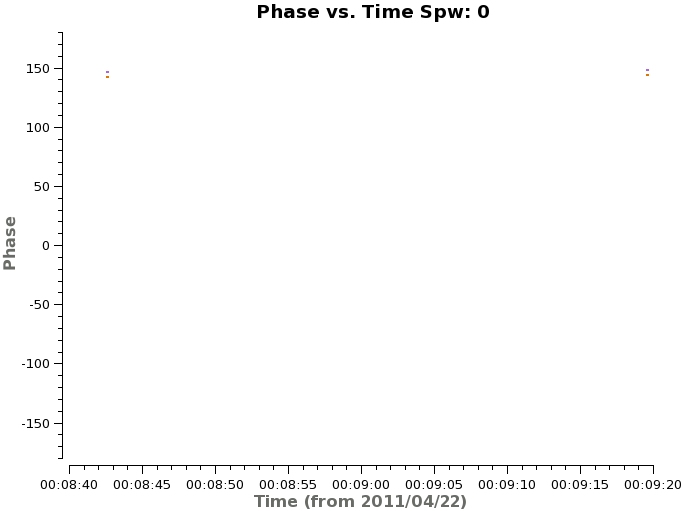
| 13:02, 25 August 2011 | Phase vs time DV09.png (file) |  |
13 KB | Phase vs. time for one baseline with DV09 in uid___A002_X207fe4_X3a. Note the big jump in phase between the first phase calibrator observation and the next. We do not have a good way to interpolate to a reasonable phase between these two points and so fla | 1 |
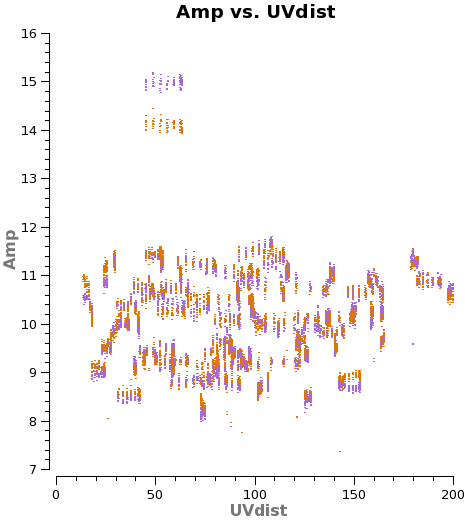
| 16:29, 25 August 2011 | Amp vs uvdist outliers.png (file) |  |
20 KB | 1 | |
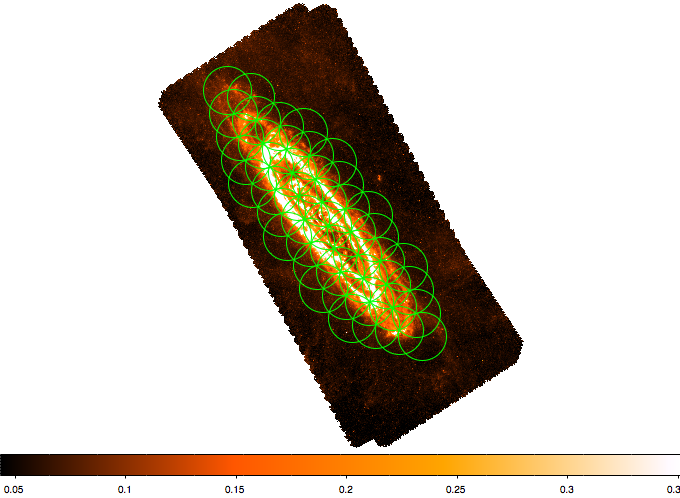
| 10:10, 13 October 2011 | Ds9 m31 1.png (file) |  |
166 KB | 1 | |
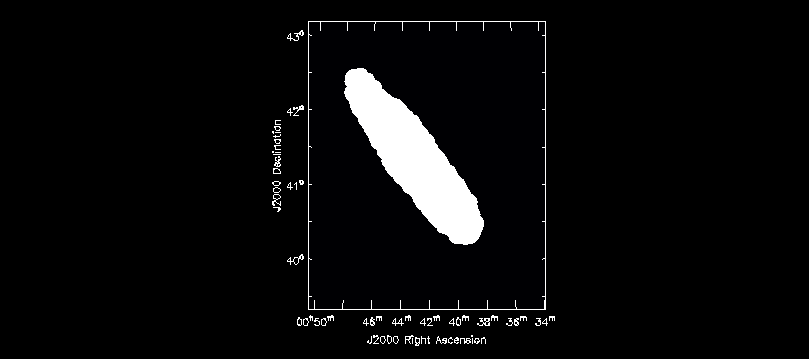
| 10:40, 13 October 2011 | M31 mask.png (file) |  |
4 KB | 1 | |
| 11:01, 13 October 2011 | Buildmosaic.py (file) | 6 KB | A script to write mosaic files for use with EVLA or other radio telescopes. | 1 | |
| 11:04, 13 October 2011 | Buildfluxmap.py (file) | 4 KB | Parse an input mosaic pattern and write a predicted signal-to-noise ratio image on a supplied template astrometry. | 1 | |
| 11:05, 13 October 2011 | Axisutils.py (file) | 10 KB | Axis handling utility for CASA. Make sure this is in your path to run "buildmosaic" or "buildfluxmap". | 1 | |
| 11:07, 13 October 2011 | Constutils.py (file) | 6 KB | Constants utility file. Place this in your path to run "buildmosaic" or "buildfluxmap." | 1 | |
| 11:11, 13 October 2011 | Geoutils.py (file) | 3 KB | Geometry utilities needed in path to run "buildmosaic" or "buildfluxmap". | 1 | |
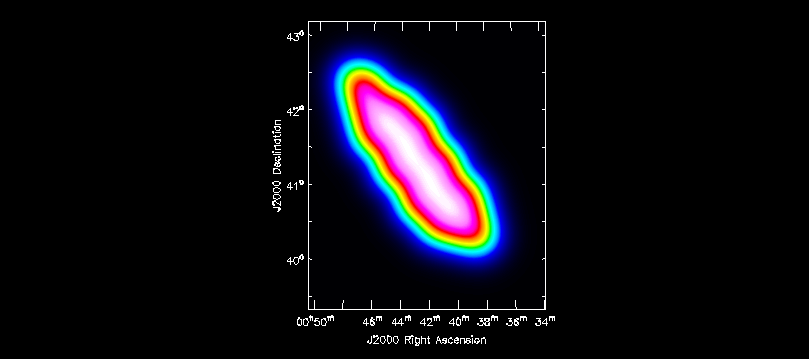
| 11:15, 13 October 2011 | M31 snr.png (file) |  |
30 KB | 1 | |
| 11:32, 13 October 2011 | Alignbyvel.xml (file) | 2 KB | 1 | ||
| 11:32, 13 October 2011 | Alignbyvel.py (file) | 1 KB | 1 | ||
| 11:33, 13 October 2011 | Task alignbyvel.py (file) | 4 KB | 1 | ||
| 15:01, 13 October 2011 | Intro script.py (file) | 355 bytes | 1 | ||
| 15:02, 13 October 2011 | Intro script 2.py (file) | 1 KB | 1 | ||
| 09:22, 2 November 2011 | Example file.txt (file) | 45 bytes | 1 | ||
| 08:53, 2 December 2011 | Line selfcal.py (file) | 5 KB | 2 | ||
| 12:33, 30 March 2012 | BR1202 SV Band7 Calibration notes.pdf (file) | 355 KB | 1 | ||
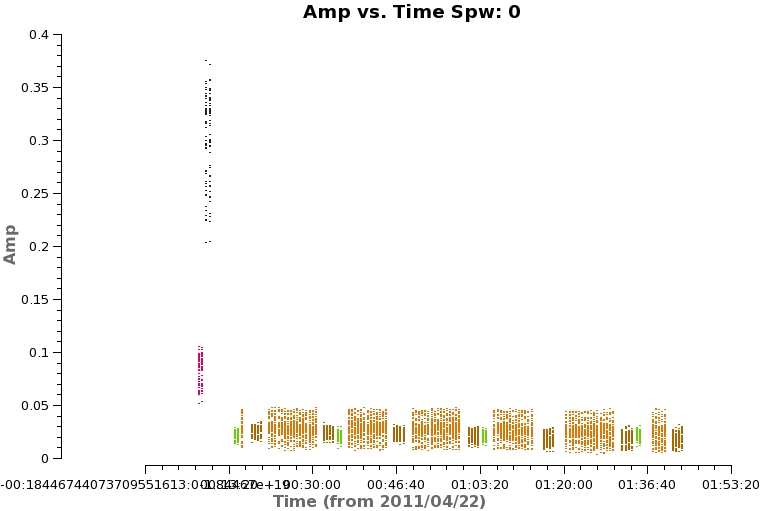
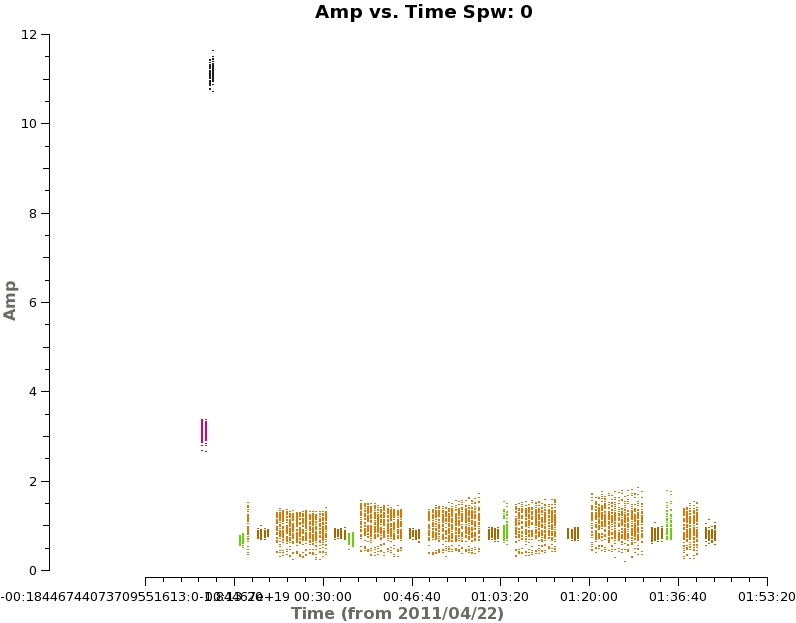
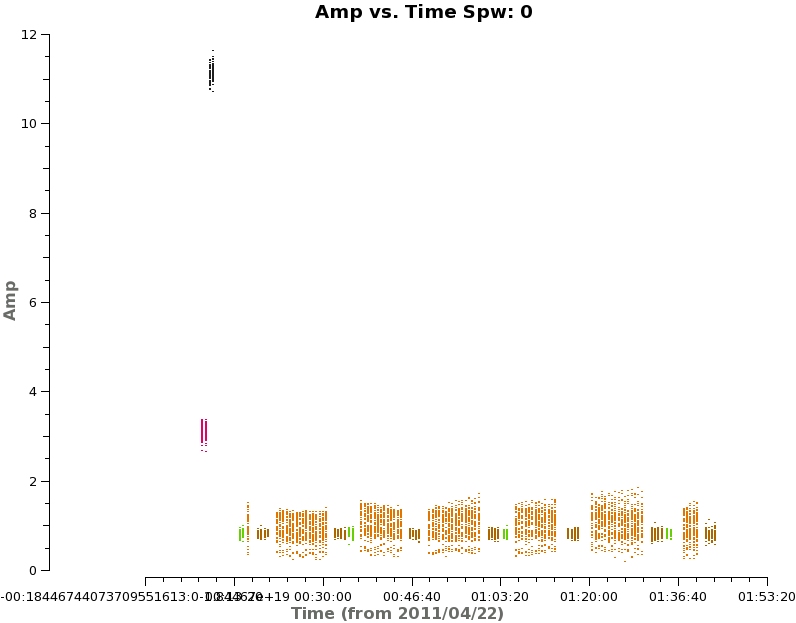
| 11:14, 23 May 2012 | Figure5.jpg (file) |  |
80 KB | Amplitude as a function of time for X3c1_wvrtsys.ms, spw=0 | 1 |
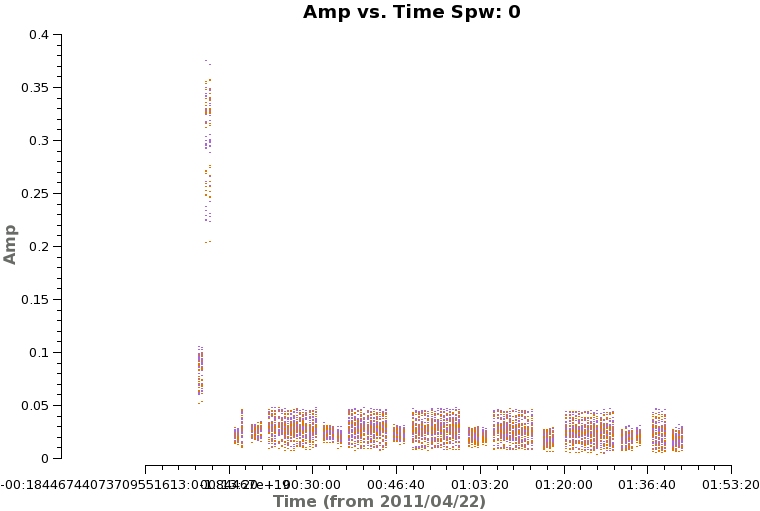
| 11:17, 23 May 2012 | Figure6.jpg (file) |  |
80 KB | Amplitude as a function of time for X3x1_wvrtsys.ms, spw=2 with colorize='corr'. Figure 6 in the TWHydra Band 7 tutorial for the 2012 summer school. | 1 |
| 11:22, 23 May 2012 | Figure8.jpg (file) |  |
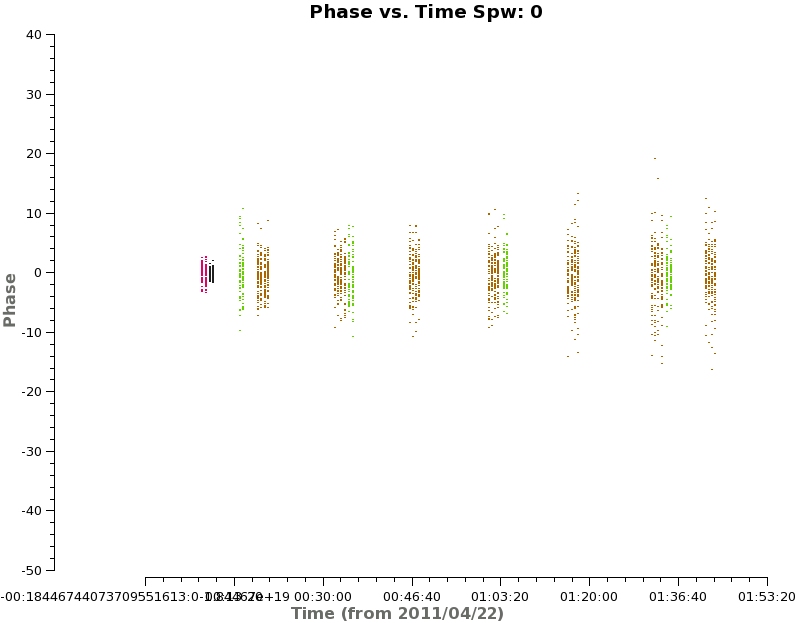
59 KB | Figure 8: Phase calibrators (brown and green) and TW Hya (orange) showing only weak birdie spectral features in spw=3. Figure 8 for the TWHydra Band 7 Summer School 2012 | 1 |
| 11:23, 23 May 2012 | Figure10.jpg (file) |  |
155 KB | Figure 10: Zoomed spectral plot of 3C279 showing mesospheric absorption of CO(3-2) in frequency space. Figure 10 of the TWHydraBand 7 Summer School 2012 | 1 |
| 11:24, 23 May 2012 | Figure11.jpg (file) |  |
178 KB | Zoomed spectral plot of 3C279 showing mesospheric absorption of CO(3-2) in channel space. TWHydraBand 7 for the summer school 2012 | 1 |
| 11:24, 23 May 2012 | Figure15.jpg (file) |  |
38 KB | Amplitude variation 3C279, spw 0 (for one representative baseline). | 1 |
| 11:25, 23 May 2012 | Figure16.jpg (file) |  |
41 KB | Phase variation for 3C279, spw 0 (for one representative baseline). | 1 |
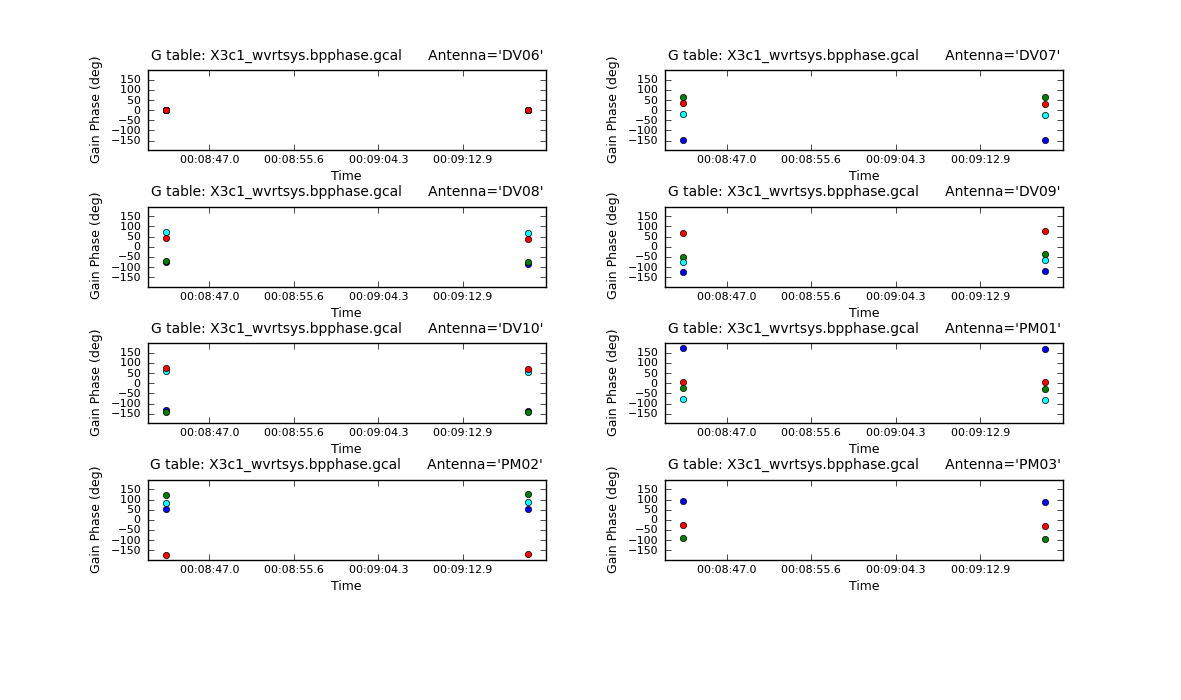
| 11:26, 23 May 2012 | Figure17.png (file) |  |
72 KB | Phase only solutions for correlation X of the bandpass calibrator 3C279. | 1 |
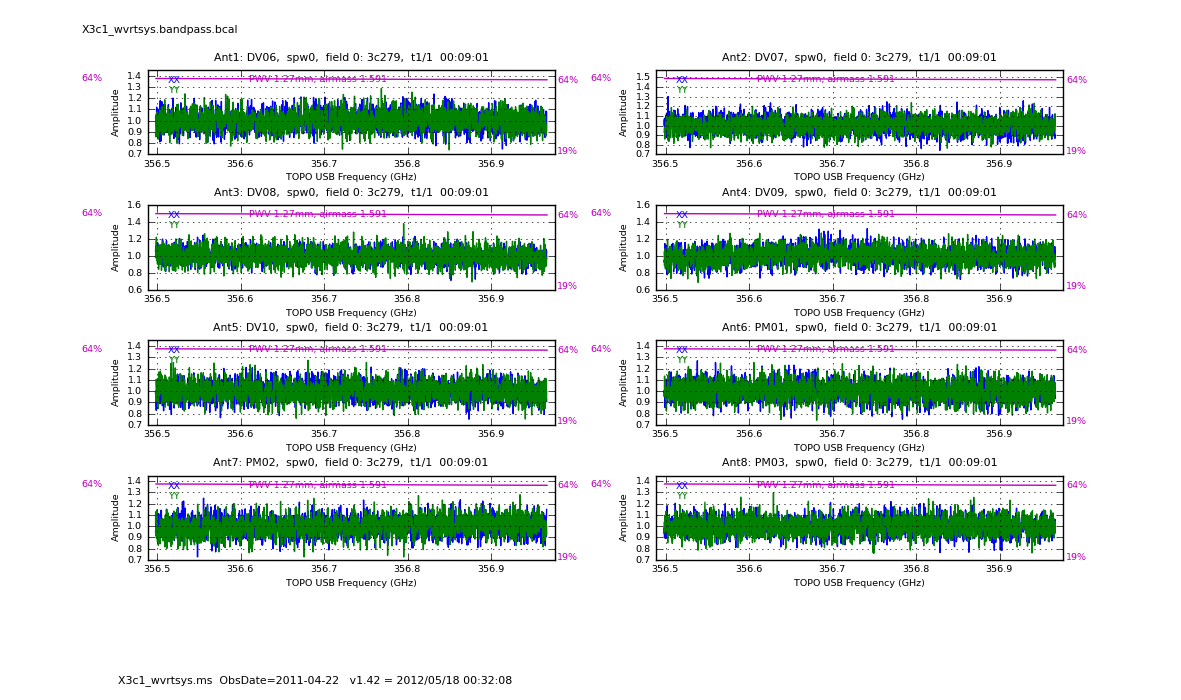
| 11:27, 23 May 2012 | Figure18.png (file) |  |
211 KB | Bandpass amplitude solution plots | 1 |
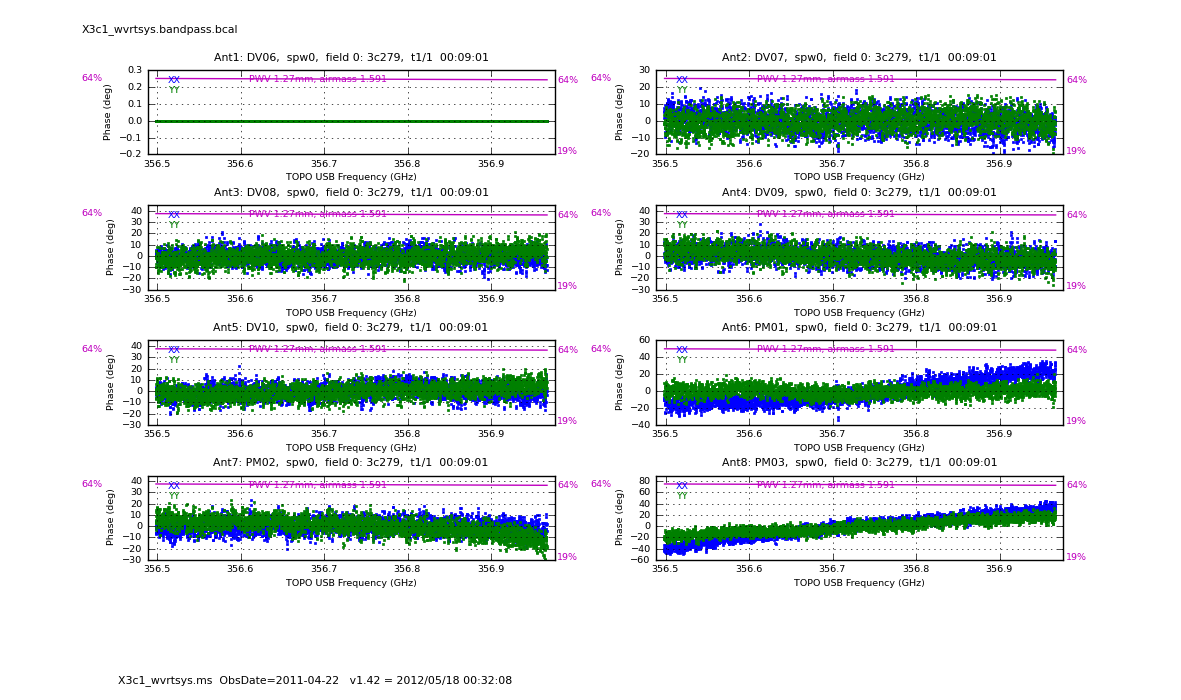
| 11:27, 23 May 2012 | Figure19.png (file) |  |
219 KB | Bandpass phase solution plots | 1 |
| 11:29, 23 May 2012 | Figure20a.png (file) |  |
112 KB | Phase solutions for the X polarization for every integration time of the first dataset. | 1 |
| 11:30, 23 May 2012 | Figure21.png (file) |  |
91 KB | Phase solutions for the X polarization for each scan of the first dataset. | 1 |
| 11:30, 23 May 2012 | Figure22.png (file) |  |
84 KB | Residual phase after applying intphase.gcal for both correlations in the first dataset. | 1 |
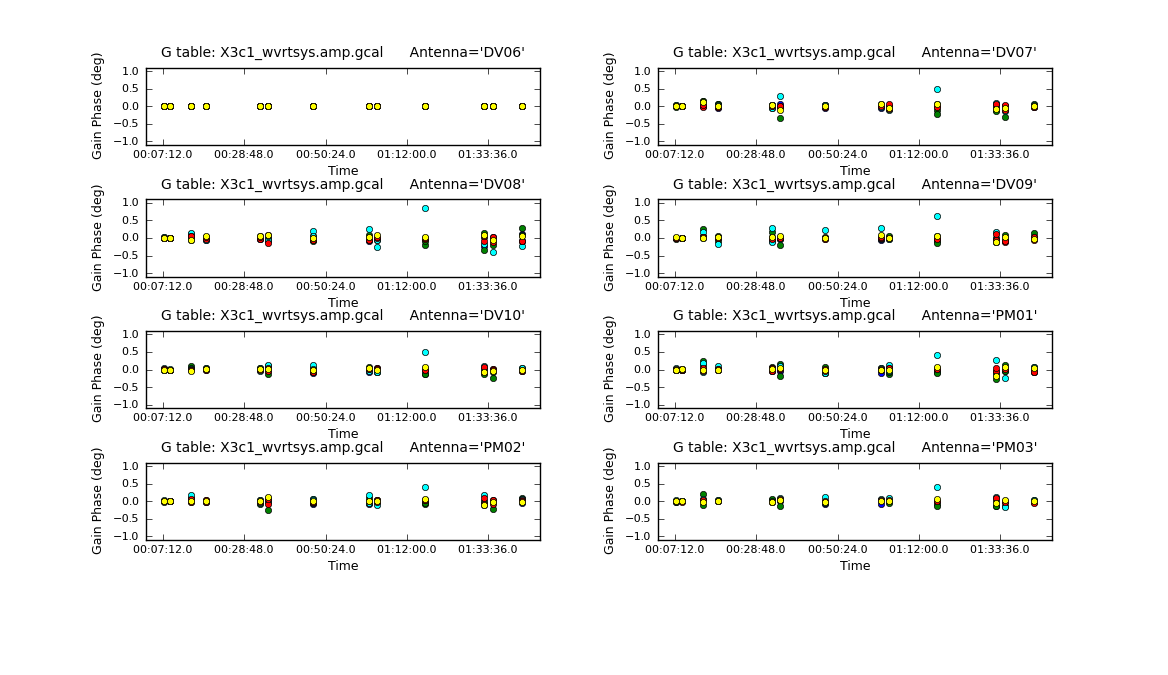
| 11:31, 23 May 2012 | Figure23.png (file) |  |
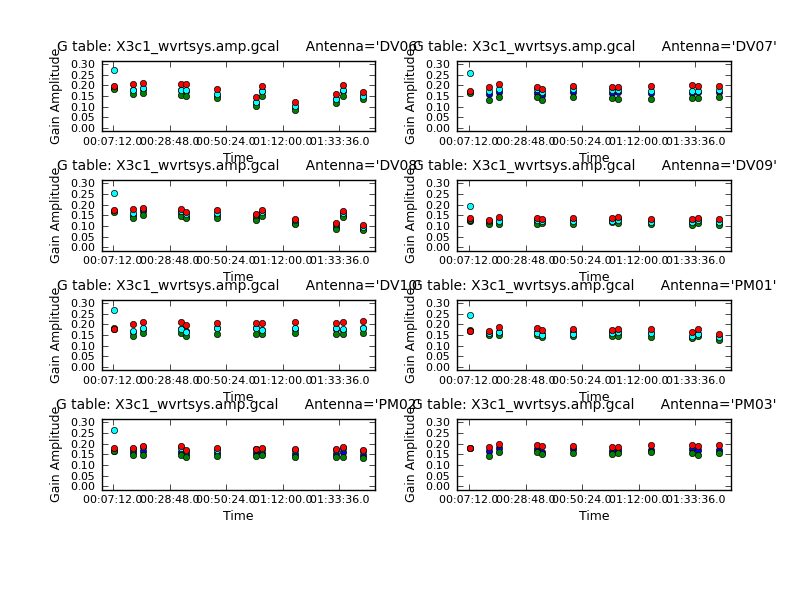
77 KB | Amplitude solutions on a scan interval for correlation X in the first dataset. | 1 |
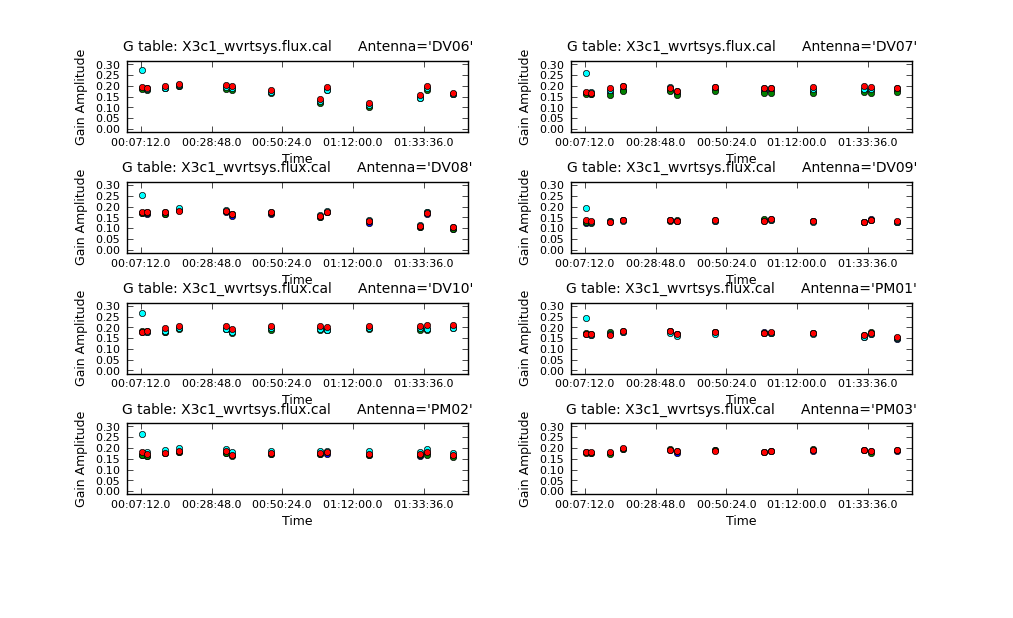
| 11:31, 23 May 2012 | Figure24.png (file) |  |
78 KB | Absolute flux calibration solutions for correlation X for the first dataset. | 1 |
| 11:31, 23 May 2012 | Figure25.jpg (file) |  |
83 KB | The calibrated data for the first dataset (amplitude vs. time). | 1 |
| 11:32, 23 May 2012 | Figure27.jpg (file) |  |
82 KB | The calibrated data for the first dataset (amplitude vs. time), but now with field 3, the secondary phase calibrator, calibrated with itself. | 1 |
| 11:33, 23 May 2012 | Figure28.jpg (file) |  |
80 KB | Figure 28: The calibrated data from the first dataset (phase vs. time), but now with field 3, the secondary phase calibrator, calibrated with itself. | 1 |
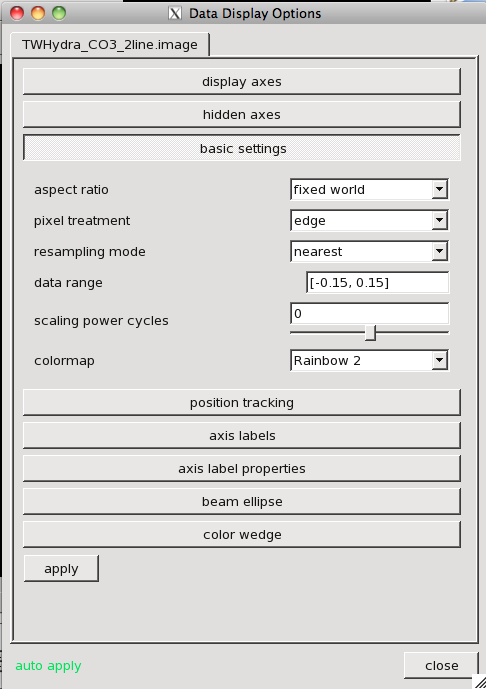
| 11:21, 27 November 2012 | DataDisplayPanelStretch.png (file) |  |
44 KB | 1 |