Search results
From CASA Guides
Jump to navigationJump to search
Page title matches

File:Spectral line picker.png (2,001 × 909 (118 KB)) - 10:47, 2 May 2018
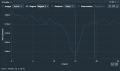
File:Spectral Profile-MG0414 d1 line sc3ap vel R03 5.5.0.png (1,408 × 728 (71 KB)) - 15:37, 2 July 2019
File:Screenshot-Spectral Profile - MG0414 d1 line sc3ap vel R03.image-raster.png (1,417 × 989 (74 KB)) - 10:25, 4 May 2018


Page text matches
File:MKN6 SpectralProfile.png ...profile for MKN 6 in the 2nd spectral window, spw = 1. The weak absorption line can be seen around channel 15.(881 × 522 (138 KB)) - 17:23, 25 January 2023
File:MG0414 Plotants.png Plotants plot for MG0414 data set P-band spectral line CASA guide(869 × 620 (31 KB)) - 17:39, 24 April 2018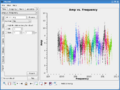
File:AmpVfreq colorspw.png .../submm guide: SMA line data. To demonstrate that there is overlap between spectral windows. Plotms of amplitude vs frequency, averaged over time, scan, basel(869 × 649 (87 KB)) - 17:30, 14 October 2010
File:MG0414 d1 Plotants zoomedin.png Plotants plot of MG0414 data set P-band spectral line CASA guide zoomed in to show center of Y w/ location of the refant ea04(622 × 461 (20 KB)) - 17:40, 24 April 2018
File:MKN6 Viewer and HI Line.png ...ws the channel containing the strongest absorption (at 5479 km/s), and the spectral profile window shows the average spectrum around the position of the strong(2,200 × 960 (1.2 MB)) - 18:00, 25 January 2023


