Search results
From CASA Guides
Jump to navigationJump to search
Page title matches

File:M100.7m.CO1 0 Line.Clean.image.mom0.png (638 × 505 (26 KB)) - 16:58, 16 June 2013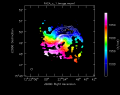
File:M100.7m.CO1 0 Line.Clean.image.mom1.png (638 × 505 (25 KB)) - 16:58, 16 June 2013
File:M100 CO1 0 vel.png (465 × 520 (18 KB)) - 16:44, 16 June 2013


Page text matches
File:UvBconfig CASA5.4.0.png Field 0(772 × 507 (29 KB)) - 13:05, 11 October 2018
File:UvCconfig CASA5.4.0.png Field 0(783 × 542 (34 KB)) - 13:07, 11 October 2018
File:Result-Titan-uid A002 X1d54a1 X5 cont map.png Map of Titan, measurement set 0(583 × 388 (32 KB)) - 09:06, 10 May 2012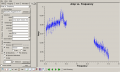
File:PlotSN2010FZ plotms appliedflags fld0 ampavg.png Field 0 cal applied and flagged amp average(1,077 × 646 (90 KB)) - 19:38, 9 January 2012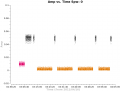
File:Amp vs time ms0.png Amplitude vs. time, measurement set 0(948 × 718 (25 KB)) - 17:22, 9 May 2012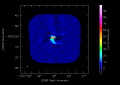
File:Antennae North.CO3 2Line.Clean.selfcal1.pbcorimage.mom0.png moment 0 image north mosaic(794 × 560 (52 KB)) - 19:11, 29 May 2012
File:PlotSN2010FZ plotms ea02fld0.png plotms field 0 ea02 amp vs frequency(1,142 × 878 (76 KB)) - 13:45, 26 August 2011
File:Bandpass ms0.png Bandpass solutions (amplitude and phase) for measurement set 0(1,133 × 775 (116 KB)) - 18:21, 9 May 2012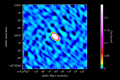
File:Result-calibrator-uid A002 X1d5a20 X330 contfaint map.png map of calibrator, measurement set 0; faint structures(583 × 388 (34 KB)) - 08:23, 10 May 2012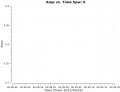
File:Figure15.jpg Amplitude variation 3C279, spw 0 (for one representative baseline).(663 × 511 (38 KB)) - 11:24, 23 May 2012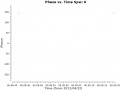
File:Figure16.jpg Phase variation for 3C279, spw 0 (for one representative baseline).(682 × 511 (41 KB)) - 11:25, 23 May 2012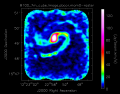
File:7m pbcor.png Primary beam corrected moment 0 for the 7m only data.(1,112 × 867 (54 KB)) - 16:07, 21 May 2015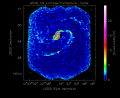
File:12m pbcor.png Primary beam corrected moment 0 image for the 12m only data.(1,116 × 914 (336 KB)) - 18:30, 19 May 2015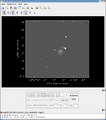
File:PlotSN2010FZ viewerfinal.png SN2010FZ Final mfs nterms=2 image spw 0~11(855 × 971 (56 KB)) - 20:00, 25 August 2011
File:Gain amp vs time XX ms0.png gain solution, amplitude vs. time, measurement set 0(1,133 × 775 (52 KB)) - 04:17, 10 May 2012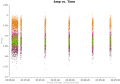
File:Amp vs time calibrator corr ms0.png Corrected amplitude versus time, calibrator, measurement set 0(994 × 699 (38 KB)) - 06:26, 10 May 2012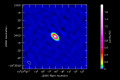
File:Result-calibrator-uid A002 X1d5a20 X330 cont map.png map of calibrator, measurement set 0; total dynamic range(583 × 388 (20 KB)) - 08:26, 10 May 2012
File:IRC10216 SiS mom0.png IRC+10216 SiS moment-0 map displayed in the CASA Viewer.(869 × 1,014 (102 KB)) - 13:30, 9 January 2012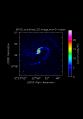
File:M100 combined CO.image.mom0.png Moment 0 image (integrated intensity) of M100.(642 × 921 (80 KB)) - 20:50, 5 May 2015
File:M100 combined CO.image.mom0.pbcor.png Primary beam corrected 7m+12m moment 0 image.(642 × 921 (88 KB)) - 21:05, 5 May 2015


