Search results
From CASA Guides
Jump to navigationJump to search
Page title matches

File:M100.7m.CO1 0 Line.Clean.image.mom0.png (638 × 505 (26 KB)) - 16:58, 16 June 2013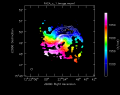
File:M100.7m.CO1 0 Line.Clean.image.mom1.png (638 × 505 (25 KB)) - 16:58, 16 June 2013
File:M100 CO1 0 vel.png (465 × 520 (18 KB)) - 16:44, 16 June 2013


Page text matches
File:UvBconfig CASA5.4.0.png Field 0(772 × 507 (29 KB)) - 13:05, 11 October 2018
File:UvCconfig CASA5.4.0.png Field 0(783 × 542 (34 KB)) - 13:07, 11 October 2018
File:Result-Titan-uid A002 X1d54a1 X5 cont map.png Map of Titan, measurement set 0(583 × 388 (32 KB)) - 09:06, 10 May 2012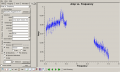
File:PlotSN2010FZ plotms appliedflags fld0 ampavg.png Field 0 cal applied and flagged amp average(1,077 × 646 (90 KB)) - 19:38, 9 January 2012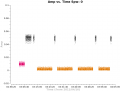
File:Amp vs time ms0.png Amplitude vs. time, measurement set 0(948 × 718 (25 KB)) - 17:22, 9 May 2012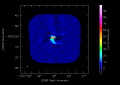
File:Antennae North.CO3 2Line.Clean.selfcal1.pbcorimage.mom0.png moment 0 image north mosaic(794 × 560 (52 KB)) - 19:11, 29 May 2012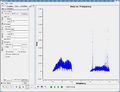
File:PlotSN2010FZ plotms ea02fld0.png plotms field 0 ea02 amp vs frequency(1,142 × 878 (76 KB)) - 13:45, 26 August 2011
File:Bandpass ms0.png Bandpass solutions (amplitude and phase) for measurement set 0(1,133 × 775 (116 KB)) - 18:21, 9 May 2012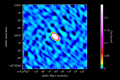
File:Result-calibrator-uid A002 X1d5a20 X330 contfaint map.png map of calibrator, measurement set 0; faint structures(583 × 388 (34 KB)) - 08:23, 10 May 2012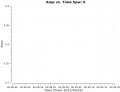
File:Figure15.jpg Amplitude variation 3C279, spw 0 (for one representative baseline).(663 × 511 (38 KB)) - 11:24, 23 May 2012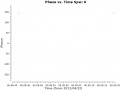
File:Figure16.jpg Phase variation for 3C279, spw 0 (for one representative baseline).(682 × 511 (41 KB)) - 11:25, 23 May 2012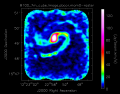
File:7m pbcor.png Primary beam corrected moment 0 for the 7m only data.(1,112 × 867 (54 KB)) - 16:07, 21 May 2015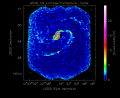
File:12m pbcor.png Primary beam corrected moment 0 image for the 12m only data.(1,116 × 914 (336 KB)) - 18:30, 19 May 2015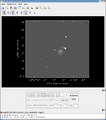
File:PlotSN2010FZ viewerfinal.png SN2010FZ Final mfs nterms=2 image spw 0~11(855 × 971 (56 KB)) - 20:00, 25 August 2011
File:Gain amp vs time XX ms0.png gain solution, amplitude vs. time, measurement set 0(1,133 × 775 (52 KB)) - 04:17, 10 May 2012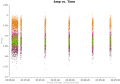
File:Amp vs time calibrator corr ms0.png Corrected amplitude versus time, calibrator, measurement set 0(994 × 699 (38 KB)) - 06:26, 10 May 2012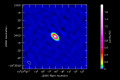
File:Result-calibrator-uid A002 X1d5a20 X330 cont map.png map of calibrator, measurement set 0; total dynamic range(583 × 388 (20 KB)) - 08:26, 10 May 2012
File:IRC10216 SiS mom0.png IRC+10216 SiS moment-0 map displayed in the CASA Viewer.(869 × 1,014 (102 KB)) - 13:30, 9 January 2012
File:M100 combined CO.image.mom0.png Moment 0 image (integrated intensity) of M100.(642 × 921 (80 KB)) - 20:50, 5 May 2015
File:M100 combined CO.image.mom0.pbcor.png Primary beam corrected 7m+12m moment 0 image.(642 × 921 (88 KB)) - 21:05, 5 May 2015
File:CompactCycle0.txt Cycle 0 compact configuration as of 5th April 2011(901 bytes) - 12:09, 5 April 2011File:ExtendedCycle0.txt Cycle 0 extended configuration as of 5th April 2011(880 bytes) - 12:10, 5 April 2011
File:7m mom0.png Moment 0 for 7m data alone (no primary beam correction).(1,115 × 877 (46 KB)) - 16:06, 21 May 2015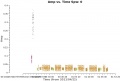
File:Figure5.jpg Amplitude as a function of time for X3c1_wvrtsys.ms, spw=0(760 × 511 (80 KB)) - 11:14, 23 May 2012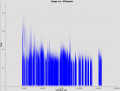
File:TWHydra corrected Spw2.png TW Hydra science spw 0 data inspection plot.(1,603 × 1,222 (90 KB)) - 09:13, 10 April 2017
File:12m.png Moment 0 image of the 12m only data (no primary beam correction).(1,113 × 892 (287 KB)) - 12:37, 19 May 2015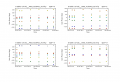
File:Gain phase vs time XX ms0.png Gain calibration, phase vs. time, X polarisation, measurement set 0(1,133 × 775 (52 KB)) - 04:20, 10 May 2012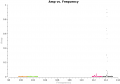
File:Amp vs freq NGC3256 corr ms0.png ...corrected amplitude versus frequency, averaged over time, measurement set 0(994 × 699 (16 KB)) - 06:03, 10 May 2012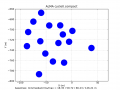
File:ALMA.cycle0.compact.png Analysis Utilities plotconfig output for ALMA Cycle 0 compact configuration.(812 × 612 (47 KB)) - 16:42, 11 April 2013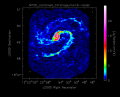
File:Combined.png Moment 0 image of the 12m+7m data (no primary beam correction).(1,114 × 899 (246 KB)) - 12:39, 19 May 2015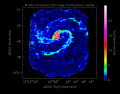
File:Combine pbcor.png Moment 0 image of the 12m+7m data with primary beam correction applied.(1,113 × 876 (274 KB)) - 12:40, 19 May 2015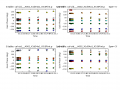
File:Cal-uid A002 X1d54a1 X5-phase vs time XX.BP.int.p.png ...ary phase only gaincal solutions vs. time, correlation XX, measurement set 0(812 × 612 (71 KB)) - 18:09, 9 May 2012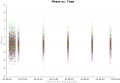
File:Phase vs time calibrator corr2 ms0.png ...ed phase vs time, calibrator, second round of calibration, measurement set 0(1,042 × 724 (51 KB)) - 07:19, 10 May 2012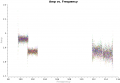
File:Amp vs freq calibrator corr2 ms0.png ...frequency, calibrator, after second round of calibration, measurement set 0(1,042 × 724 (48 KB)) - 07:14, 10 May 2012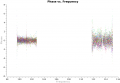
File:Phase vs freq calibrator corr2 ms0.png ...frequency, calibrator, after second round of calibration, measurement set 0(1,042 × 724 (48 KB)) - 07:00, 10 May 2012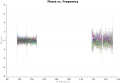
File:Phase vs freq calibrator corr2 ms4.png ...frequency, calibrator, after second round of calibration, measurement set 0(1,042 × 724 (52 KB)) - 07:01, 10 May 2012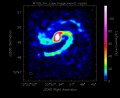
File:7m.png Moment 0 image of 7m only data (no primary beam correction).(1,114 × 908 (46 KB)) - 12:35, 19 May 2015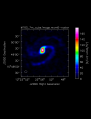
File:M100 7m cube.image.mom0.png Moment 0 image of the 7m data alone (no primary beam correction).(673 × 882 (21 KB)) - 12:24, 6 May 2015
File:ADMIT mom0.png A Moment 0 map of Antenna North created by ADMIT during CubeSum_AT.(1,861 × 1,568 (327 KB)) - 11:40, 26 November 2019
File:IRAS16293 Band9.AVG.ms uvamp f0 spw1 6.1.png Updated Fig. 2 amp v uvdistance for field 0 spw 1(683 × 510 (18 KB)) - 16:27, 1 June 2021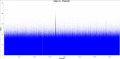
File:Calibrated final Field0 Spw0.png TW Hydra spw 0 amp vs channel plot can be used to identify continuum channels.(2,158 × 1,061 (139 KB)) - 09:10, 5 April 2017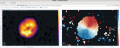
File:Mom0 mom1 casa6 5 2.png Moment 0 and Moment 1 maps in CARTA(2,560 × 1,023 (177 KB)) - 18:23, 31 January 2023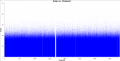
File:Calibrated final field0 spw0 LineChannelFlagged.png Line is flagged out in spw 0 in order to create continuum only image.(2,007 × 1,013 (125 KB)) - 09:18, 5 April 2017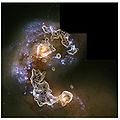
File:604px-Antennae galaxies xl.jpg ...clusters are formed. The contours show the molecular gas as traced by CO(1-0). Credit: NASA, ESA, and the Hubble Heritage Team STScI/AURA - ESA/Hubble C(881 × 879 (152 KB)) - 10:21, 5 August 2011


