Uploads by Avargas
From CASA Guides
Jump to navigationJump to search
This special page shows all uploaded files.
| Date | Name | Thumbnail | Size | Description | Versions |
|---|---|---|---|---|---|
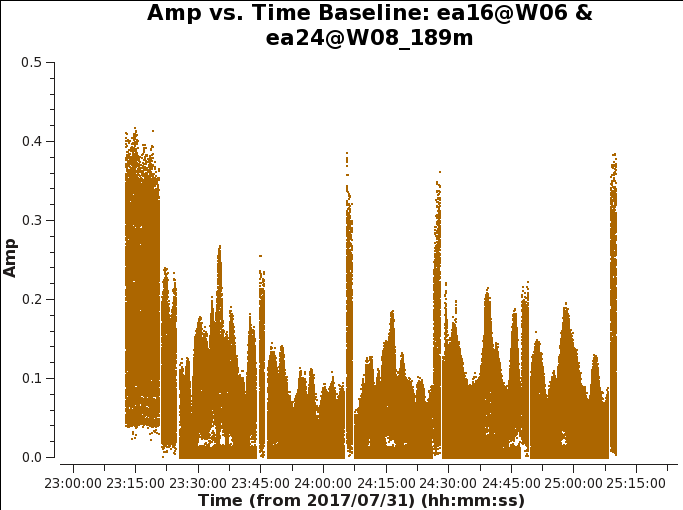
| 12:45, 1 May 2019 | Ampvstimeea16&ea24.png (file) |  |
25 KB | Amplitude versus time for ea16&ea24. | 1 |
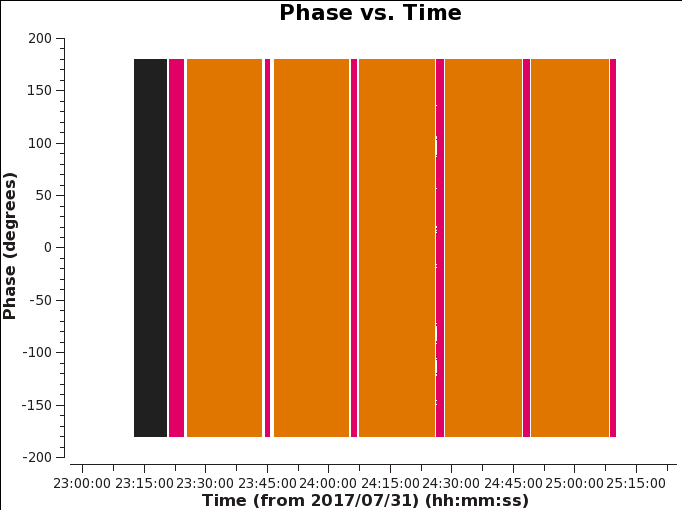
| 18:59, 11 April 2019 | Phasevstime.png (file) |  |
17 KB | phase versus time for all fields before flagging scan 21 | 5 |
| 18:34, 11 April 2019 | 3C286phasevstime.png (file) |  |
17 KB | Phase versus time after flagging beginning of scan 21 for complex gain calibrator. | 1 |
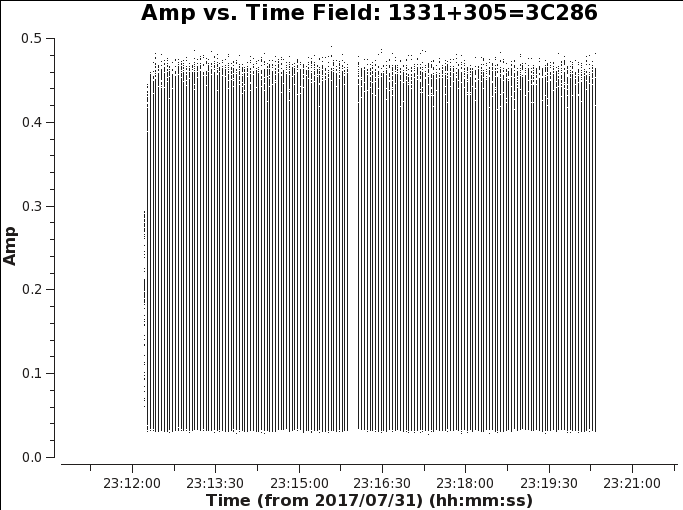
| 17:56, 11 April 2019 | 3C286ampvstime.png (file) |  |
19 KB | Amplitude versus time for 3C286, bandpass calibrator, after flagging ea16 and ea24. | 1 |
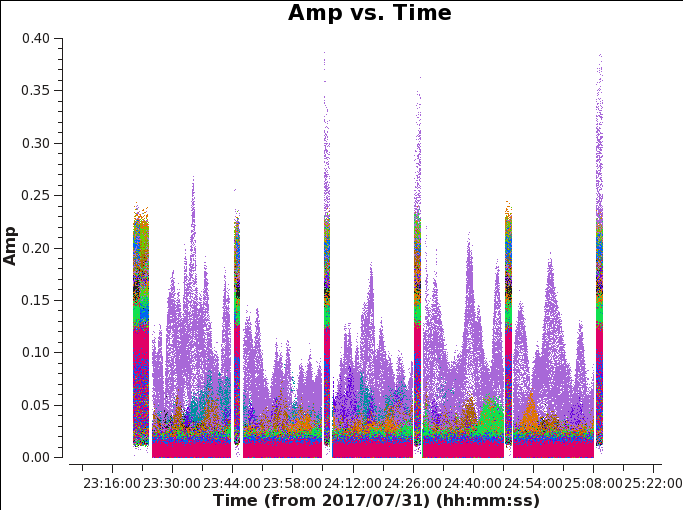
| 14:46, 10 April 2019 | Iniampvstimexea16ea24.png (file) |  |
46 KB | Excluding ea16 and ea24 in amp vs time for all sources. | 1 |
| 17:52, 3 April 2019 | Field1+2amptime.png (file) |  |
59 KB | Using plotms, we analyze amplitude versus time for the complex gain calibrator and the target per baselines to view antennas that may be noisy. | 1 |
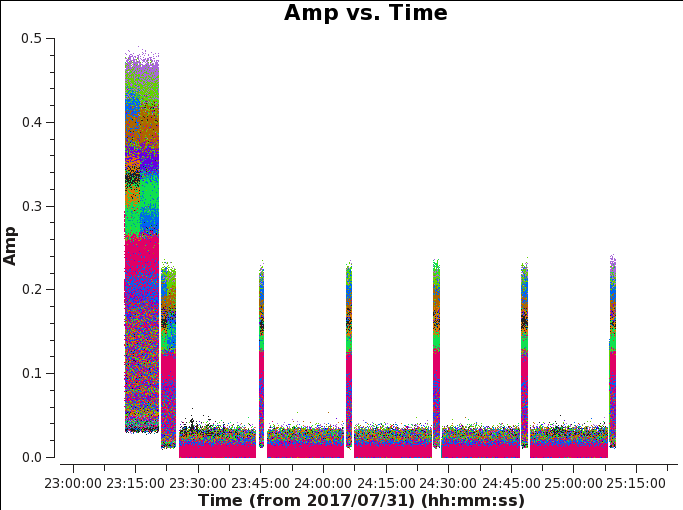
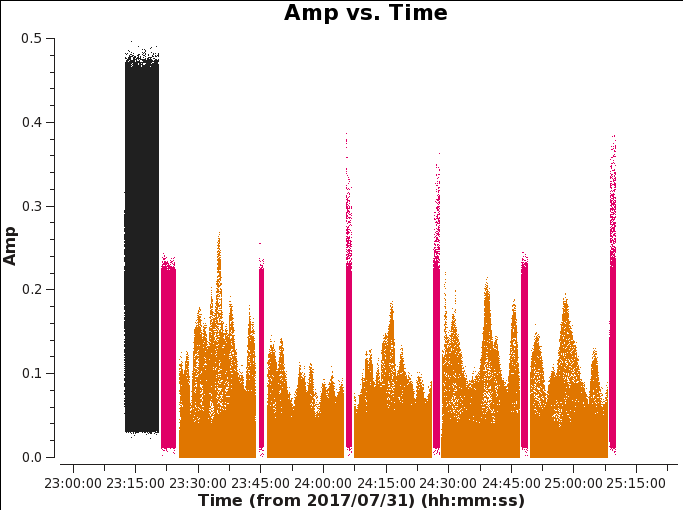
| 17:20, 3 April 2019 | Iniamptime.png (file) |  |
23 KB | Amplitude versus time colorized by field for all three fields: 3C286, J1330+2509 and, LEDA44055. | 1 |
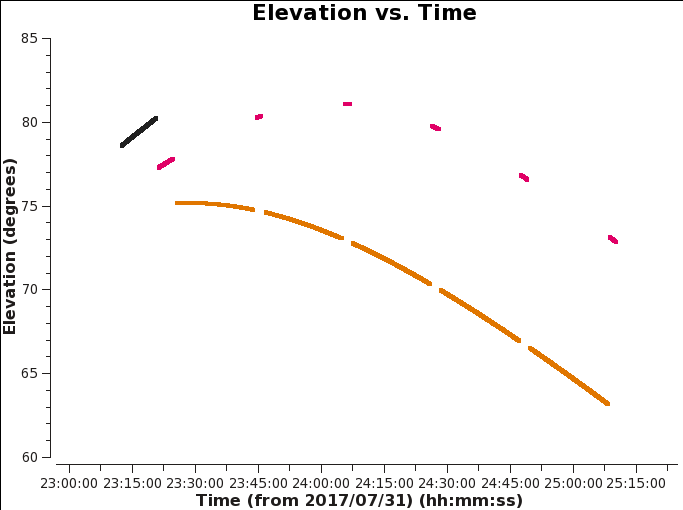
| 17:38, 25 March 2019 | TDEM0025 elevationvstime.png (file) |  |
17 KB | Using plotms, we create an elevation vs time plot where the black data points refer to 3C286 (flux calibrator), in orange LEDA44055 (target), and in red refers to J1330+2509 (complex gain calibrator). | 1 |
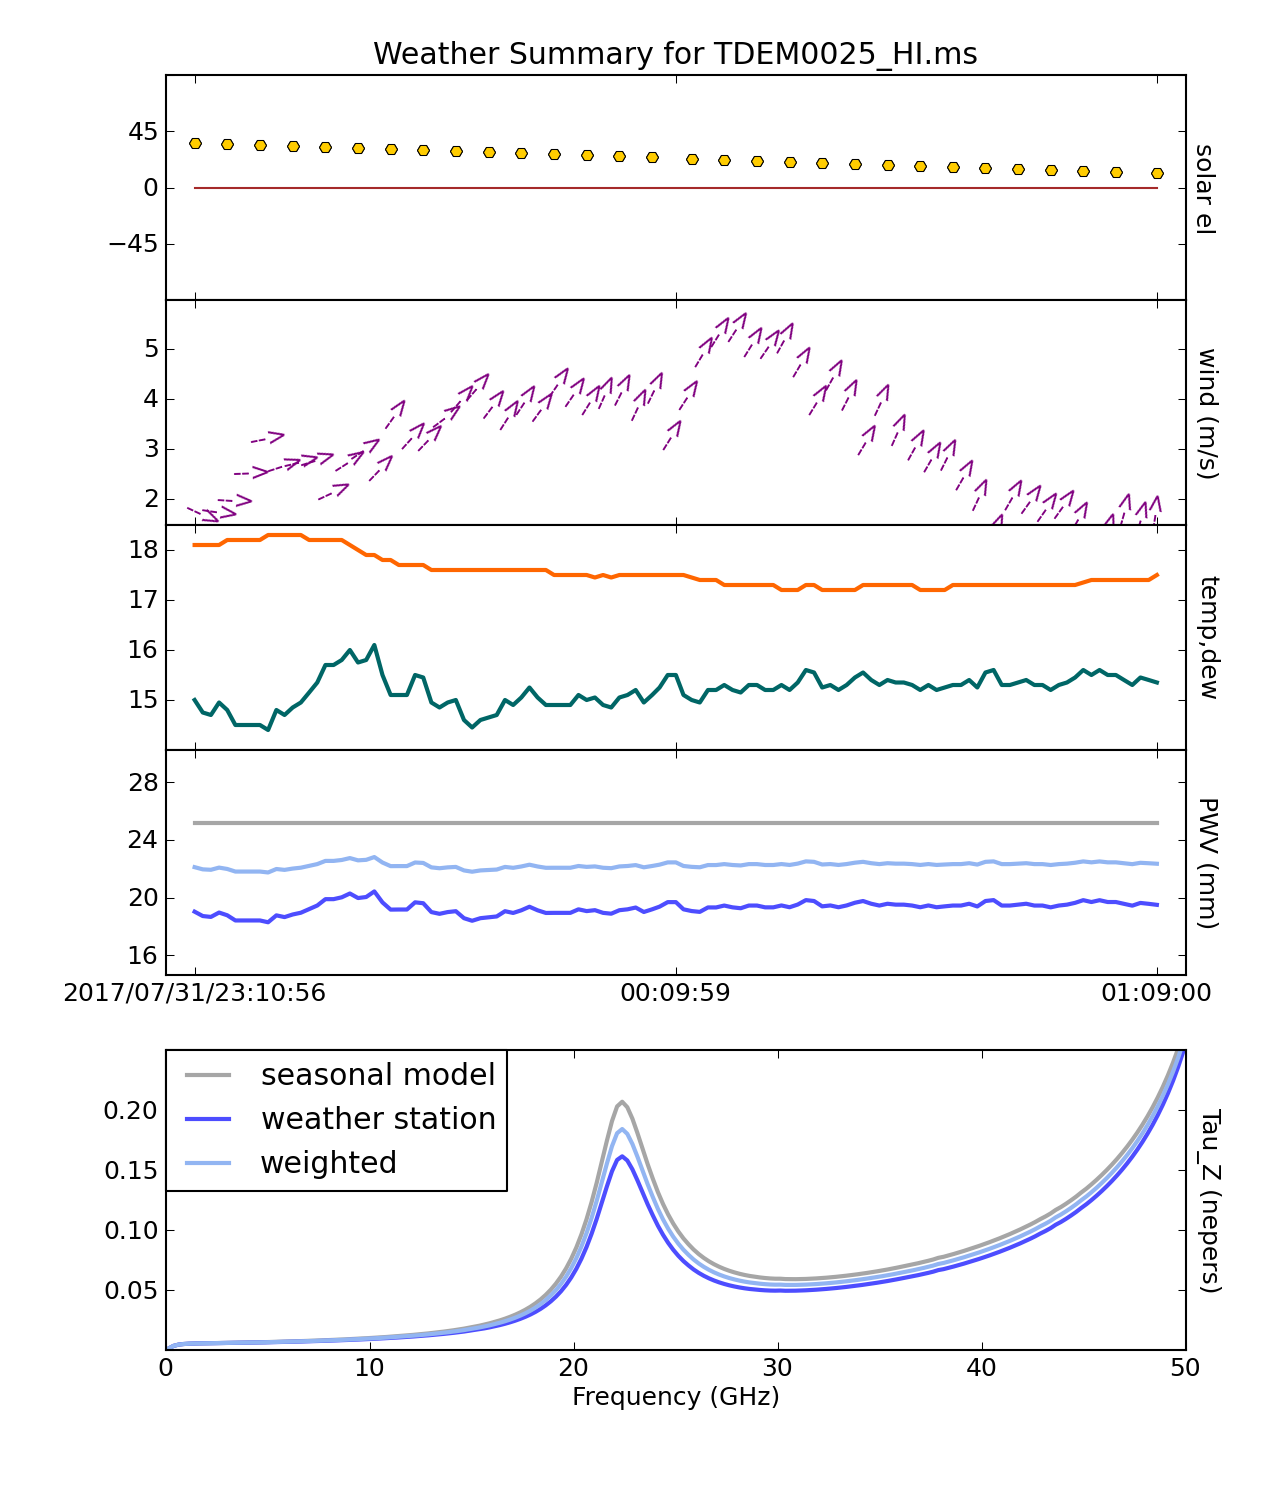
| 17:12, 25 March 2019 | TDEM0025weathercond.png (file) |  |
197 KB | Weather conditions for TDEM0025 | 1 |
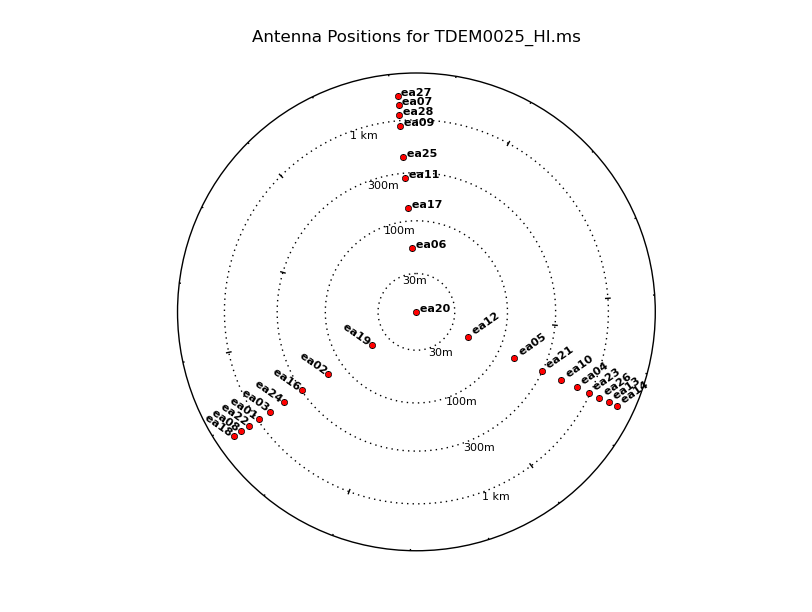
| 17:07, 25 March 2019 | Antlayout.png (file) |  |
68 KB | Antenna location for this observation which was observed in C configuration. | 1 |
| 12:07, 15 October 2018 | SgrA-ABCconfig-noPNT-statwt.png (file) |  |
71 KB | Following values were changed in Data Display Options. Scaling Power Cycles set to 0.2 Color Map set to Rainbow 2 Image Color Mapping values set Min: -0.001 Max: 0.06 Fiddled with the colormap icon on the viewer panel to create image. | 2 |
| 12:06, 15 October 2018 | SgrA-ABCconfig-noPNT-initwt.png (file) |  |
80 KB | Following values were changed in Data Display Options. Scaling Power Cycles set to 0.2 Color Map set to Rainbow 2 Image Color Mapping values set Min: -0.001 Max: 0.06 Fiddled with the colormap icon on the viewer panel to create image. | 2 |
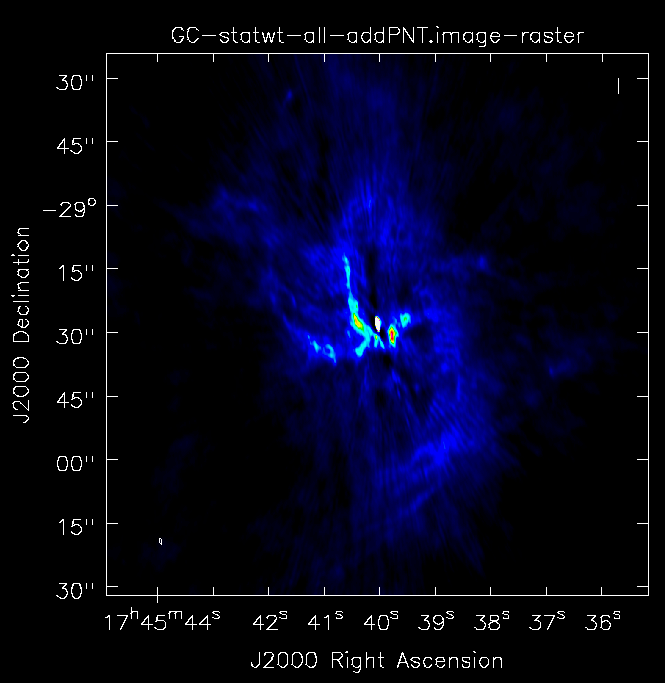
| 14:09, 12 October 2018 | SgrA-ABCconfig-addPNT-statwt.png (file) |  |
98 KB | Following values were changed in Data Display Options. Scaling Power Cycles set to 0.4 Color Map set to Rainbow 2 Image Color Mapping values set Min: -2e-06 Max: 0.05 Fiddled with the colormap icon on the viewer panel to create image. | 1 |
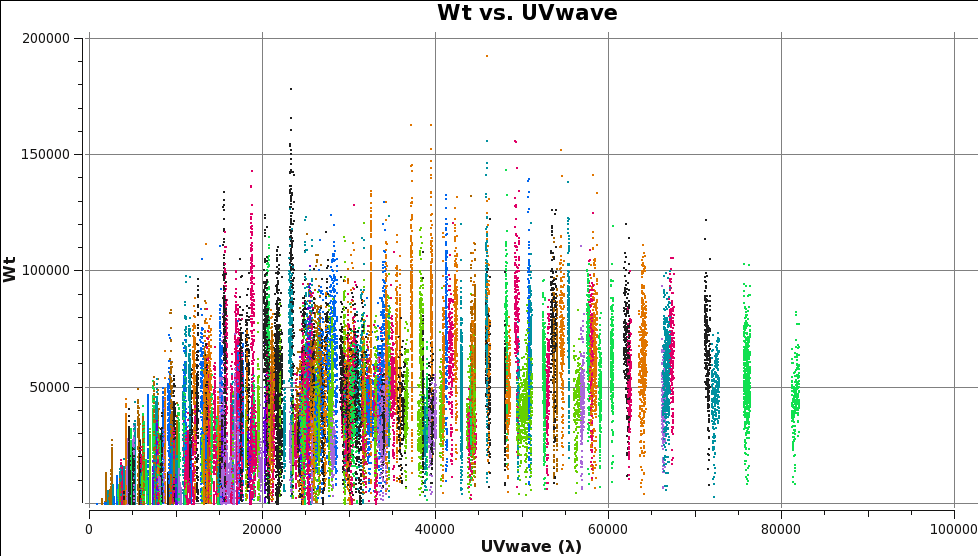
| 13:26, 12 October 2018 | Cstatwt CASA5.4.0.png (file) |  |
48 KB | 1 | |
| 13:26, 12 October 2018 | Bstatwt CASA5.4.0.png (file) |  |
64 KB | 1 | |
| 13:25, 12 October 2018 | Astatwt CASA5.4.0.png (file) |  |
54 KB | 1 | |
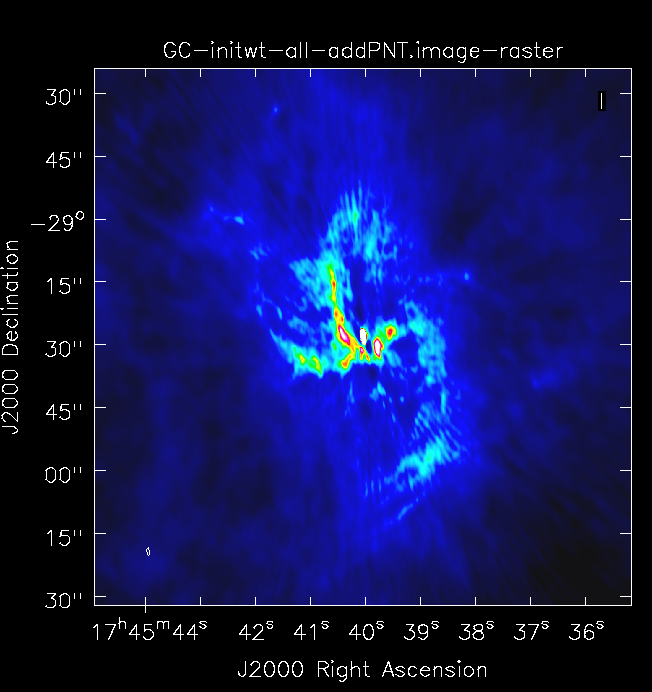
| 12:11, 12 October 2018 | SgrA-ABCconfig-addPNT-initwt1.png (file) |  |
132 KB | Following values were changed in Data Display Options. Scaling Power Cycles set to 0.4 Color Map set to Rainbow 2 Image Color Mapping values set Min: -2e106 Max: 0.05 Fiddled with the colormap icon on the viewer panel to create image. | 1 |
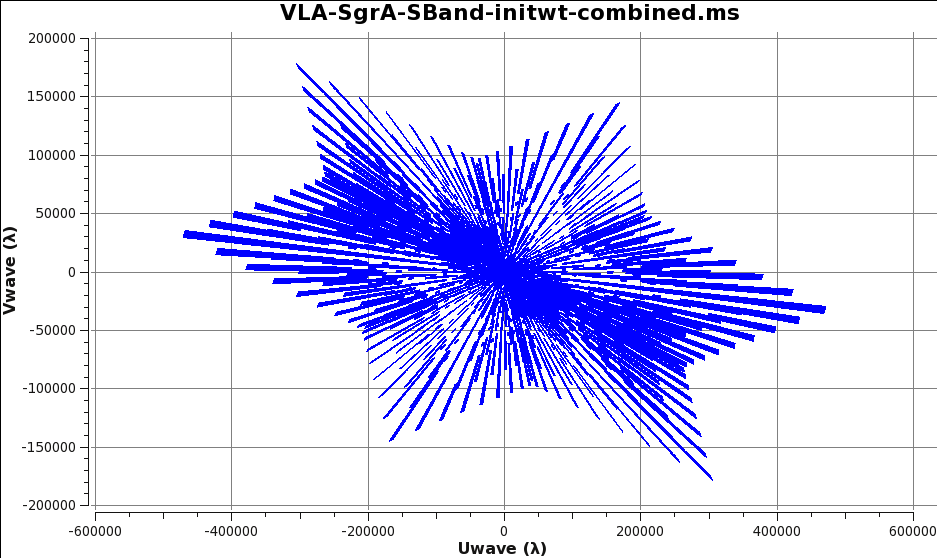
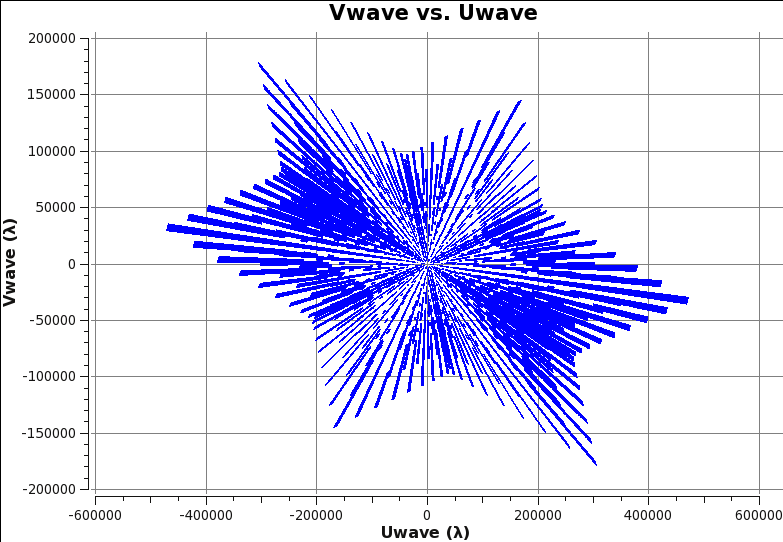
| 11:33, 12 October 2018 | CombABCuvcover CASA5.4.0.png (file) |  |
37 KB | 1 | |
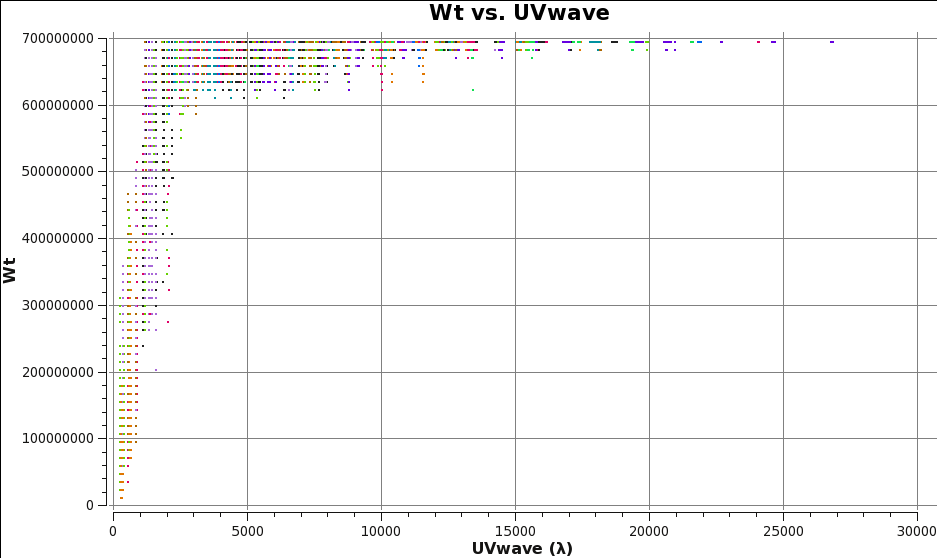
| 11:22, 12 October 2018 | InitwtCavg CASA5.4.0.png (file) |  |
20 KB | 1 | |
| 11:22, 12 October 2018 | InitwtBavg CASA5.4.0.png (file) |  |
21 KB | 1 | |
| 11:21, 12 October 2018 | InitwtAavg CASA5.4.0.png (file) |  |
19 KB | Updated for CASA5.4.0 and added grid lines | 1 |
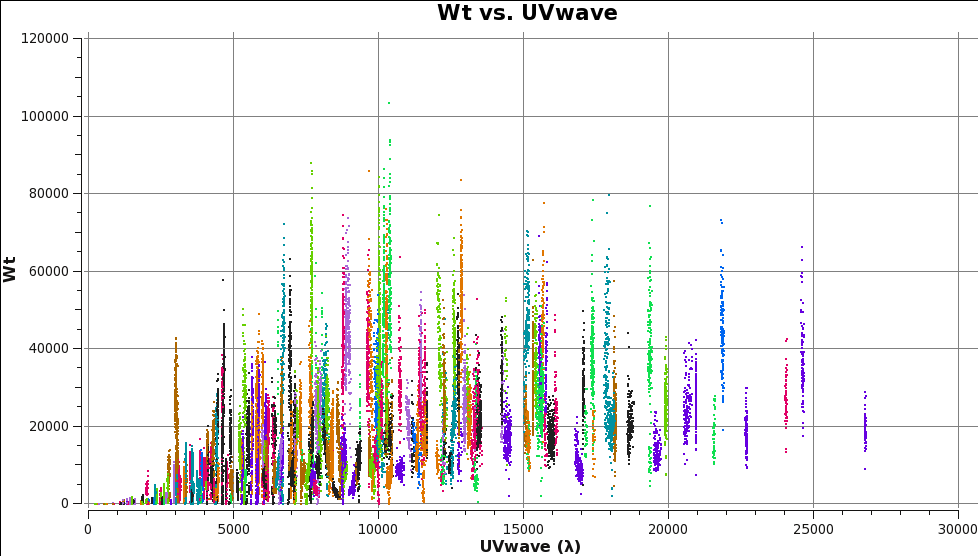
| 10:52, 12 October 2018 | Cwt CASA5.4.0.png (file) |  |
46 KB | 1 | |
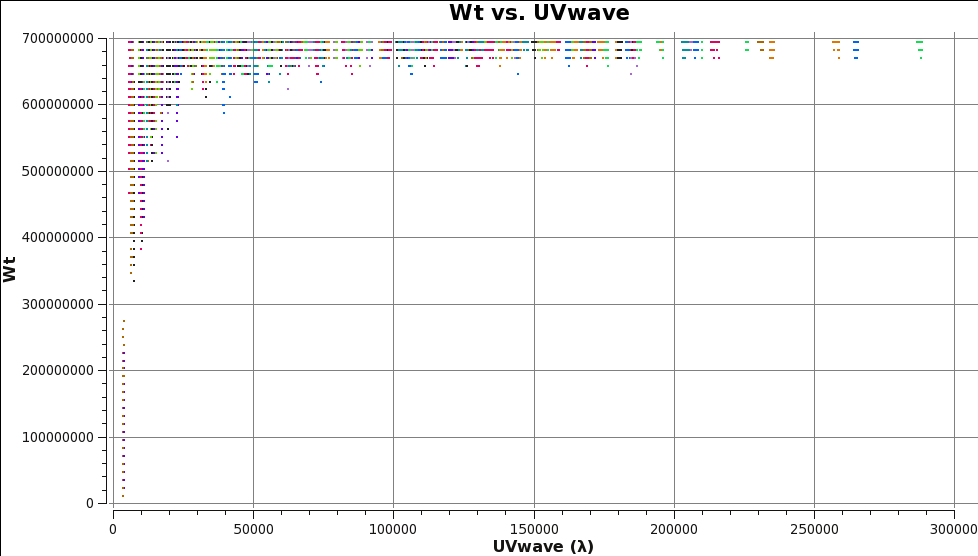
| 10:52, 12 October 2018 | Bwt CASA5.4.0.png (file) |  |
68 KB | 1 | |
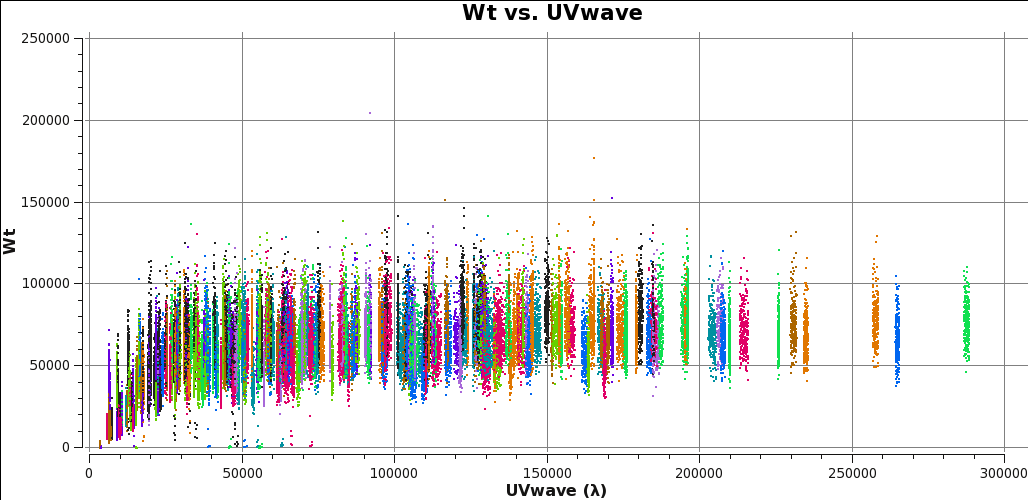
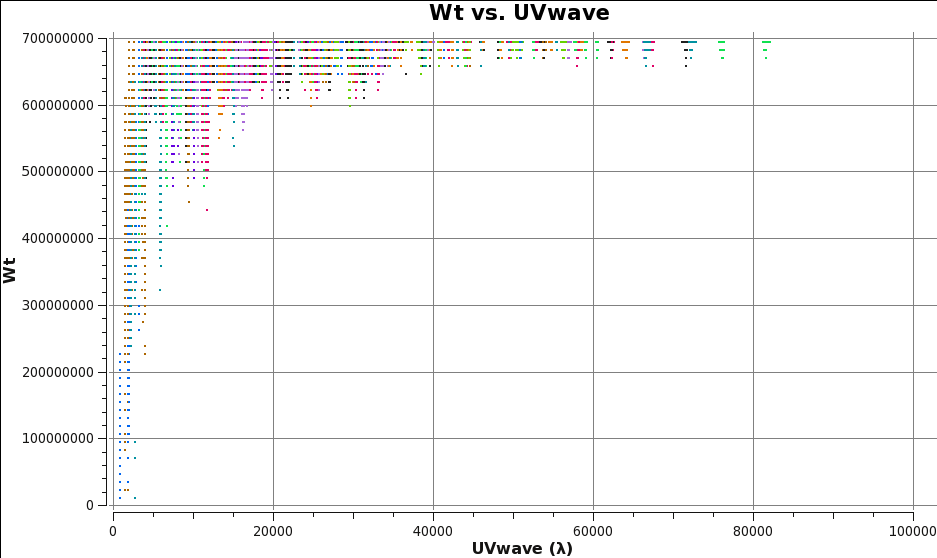
| 10:50, 12 October 2018 | Awt CASA5.4.0.png (file) |  |
58 KB | 1 | |
| 17:36, 11 October 2018 | SgrA-CconfignoPNT.png (file) |  |
70 KB | Following values were changed in Data Display Options. Scaling Power Cycles set to -0.1 Color Map set to Rainbow 2 Image Color Mapping values set Min: -0.04 Max: 0.6 Fiddled with the colormap icon on the viewer panel to create image. | 1 |
| 17:27, 11 October 2018 | SgrA-BconfignoPNT.png (file) |  |
106 KB | Following values were changed in Data Display Options. Scaling Power Cycles set to -0.8 Color Map set to Rainbow 2 Image Color Mapping values set Min: -0.02 Max: 0.3 Fiddled with the colormap icon on the viewer panel to create image. | 1 |
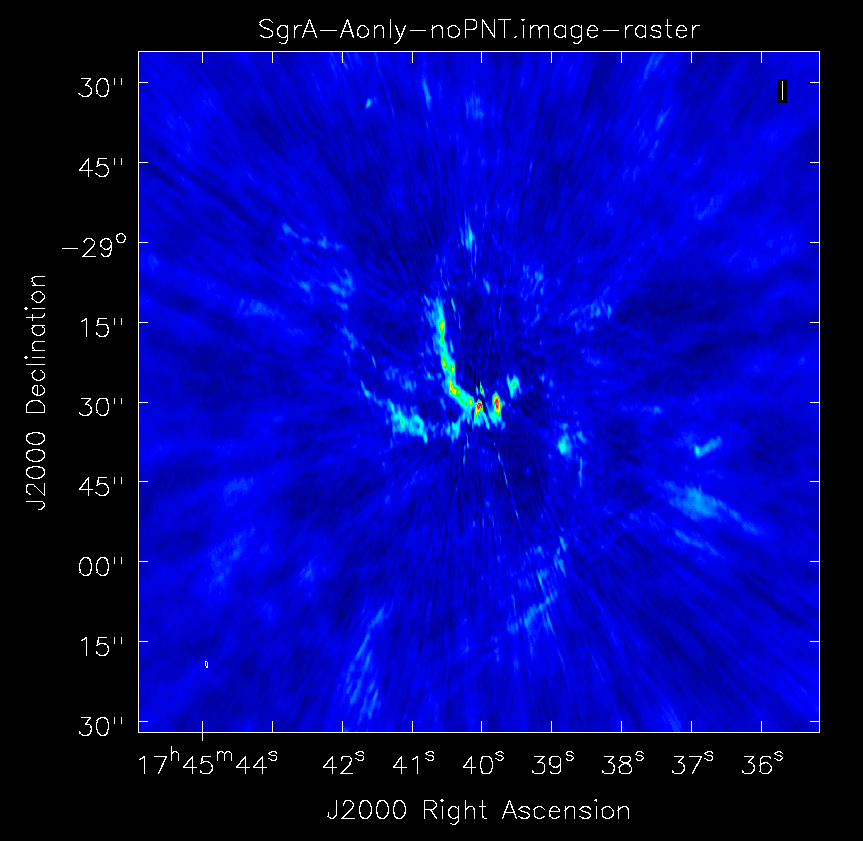
| 17:14, 11 October 2018 | SgrA-AconfignoPNT.png (file) |  |
170 KB | Following values were changed in Data Display Options. Scaling Power Cycles set to 0.5 Color Map set to Rainbow 2 Image Color Mapping values set Min: -0.009 Max: 0.019 Fiddled with the colormap icon on the viewer panel to create image. | 1 |
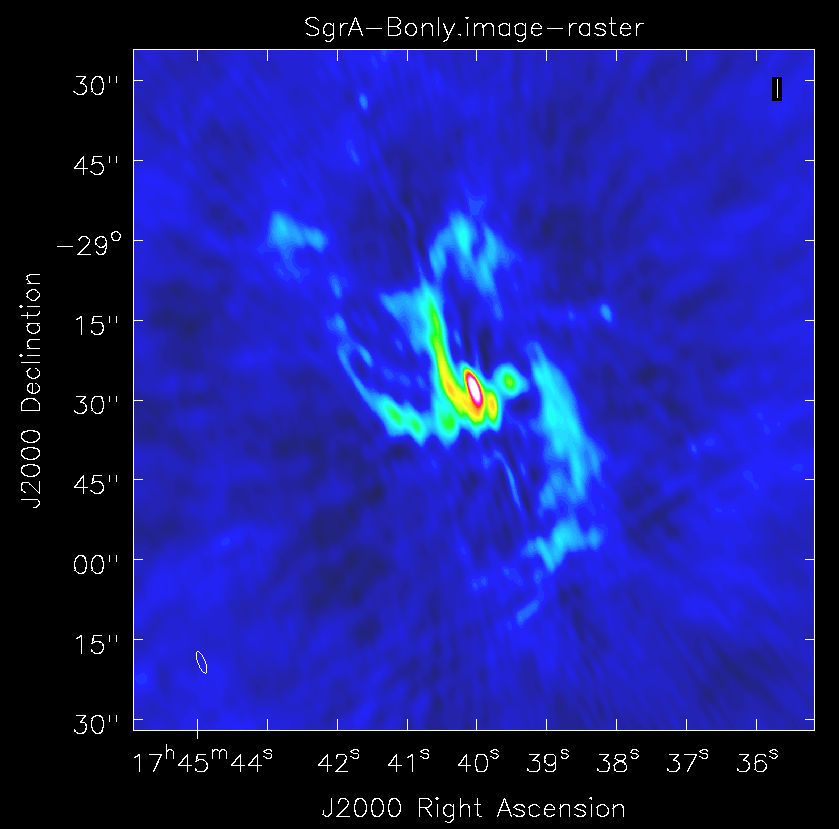
| 16:55, 11 October 2018 | SgrA-Bconfigonly.png (file) |  |
114 KB | Following values were changed in Data Display Options. Scaling Power Cycles set to -1.2 Color Map set to Rainbow 2 Image Color Mapping values set Min: -0.02 Max: 0.4 Fiddled with the colormap icon on the viewer panel to create image. | 1 |
| 15:57, 11 October 2018 | SgrA-Aconfigonly.png (file) |  |
249 KB | Following values were changed in Data Display Options. Scaling Power Cycles set to -3.4 Color Map set to Rainbow 2 Image Color Mapping values set Min: -0.002 Max: 1.1 Fiddled with the colormap icon on the viewer panel to create image. | 1 |
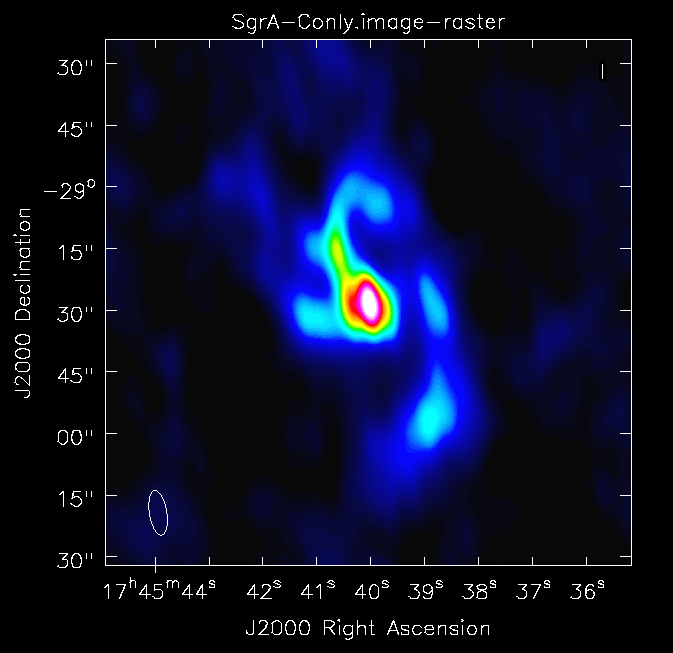
| 15:28, 11 October 2018 | SgrA-Cconfigonly.png (file) |  |
44 KB | Following values were changed in Data Display Options. Scaling Power Cycles set to -0.4 Color Map set to Rainbow 2 Image Color Mapping values set Min: -0.02 Max: 1.1 Fiddled with the colormap icon on the viewer panel to create image. | 1 |
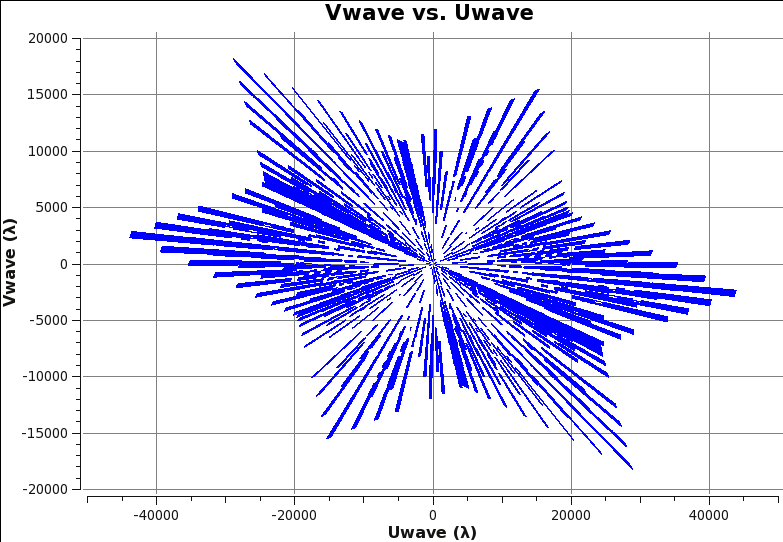
| 13:07, 11 October 2018 | UvCconfig CASA5.4.0.png (file) |  |
34 KB | Updated grid lines. | 2 |
| 13:05, 11 October 2018 | UvBconfig CASA5.4.0.png (file) |  |
29 KB | Updated grid lines. | 2 |
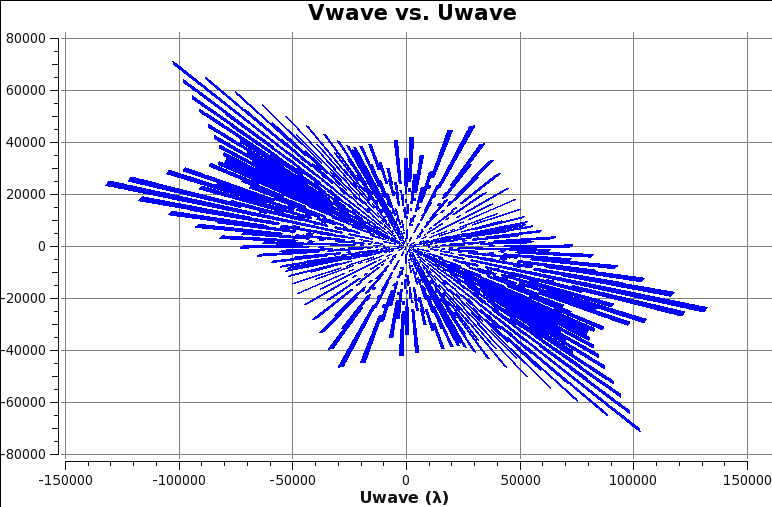
| 13:03, 11 October 2018 | UvAconfig CASA5.4.0.png (file) |  |
33 KB | Added grid lines for easier viewing. | 2 |
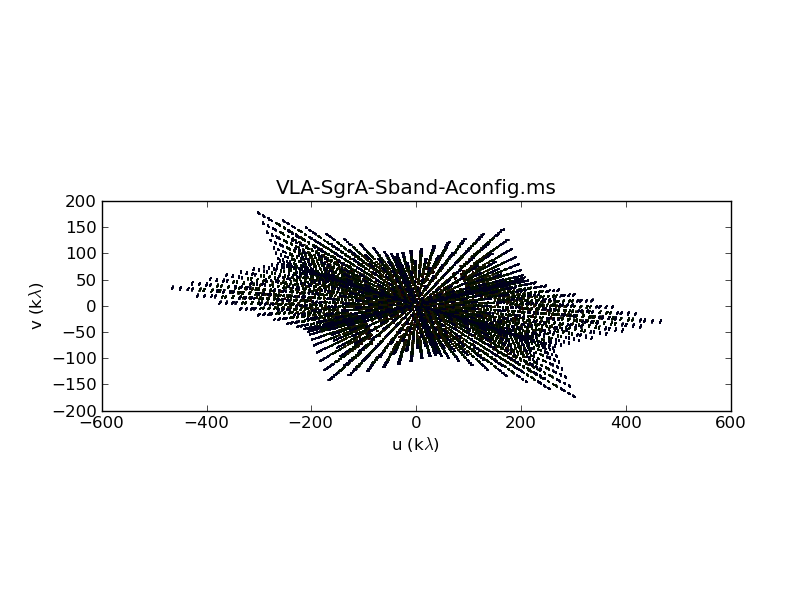
| 11:17, 9 October 2018 | VLA-comb-A-uvcover fld0.png (file) |  |
57 KB | Reverted to version as of 10:40, 18 August 2016 (EDT) | 3 |