Uploads by Alawson
From CASA Guides
Jump to navigationJump to search
This special page shows all uploaded files.
| Date | Name | Thumbnail | Size | Description | Versions |
|---|---|---|---|---|---|
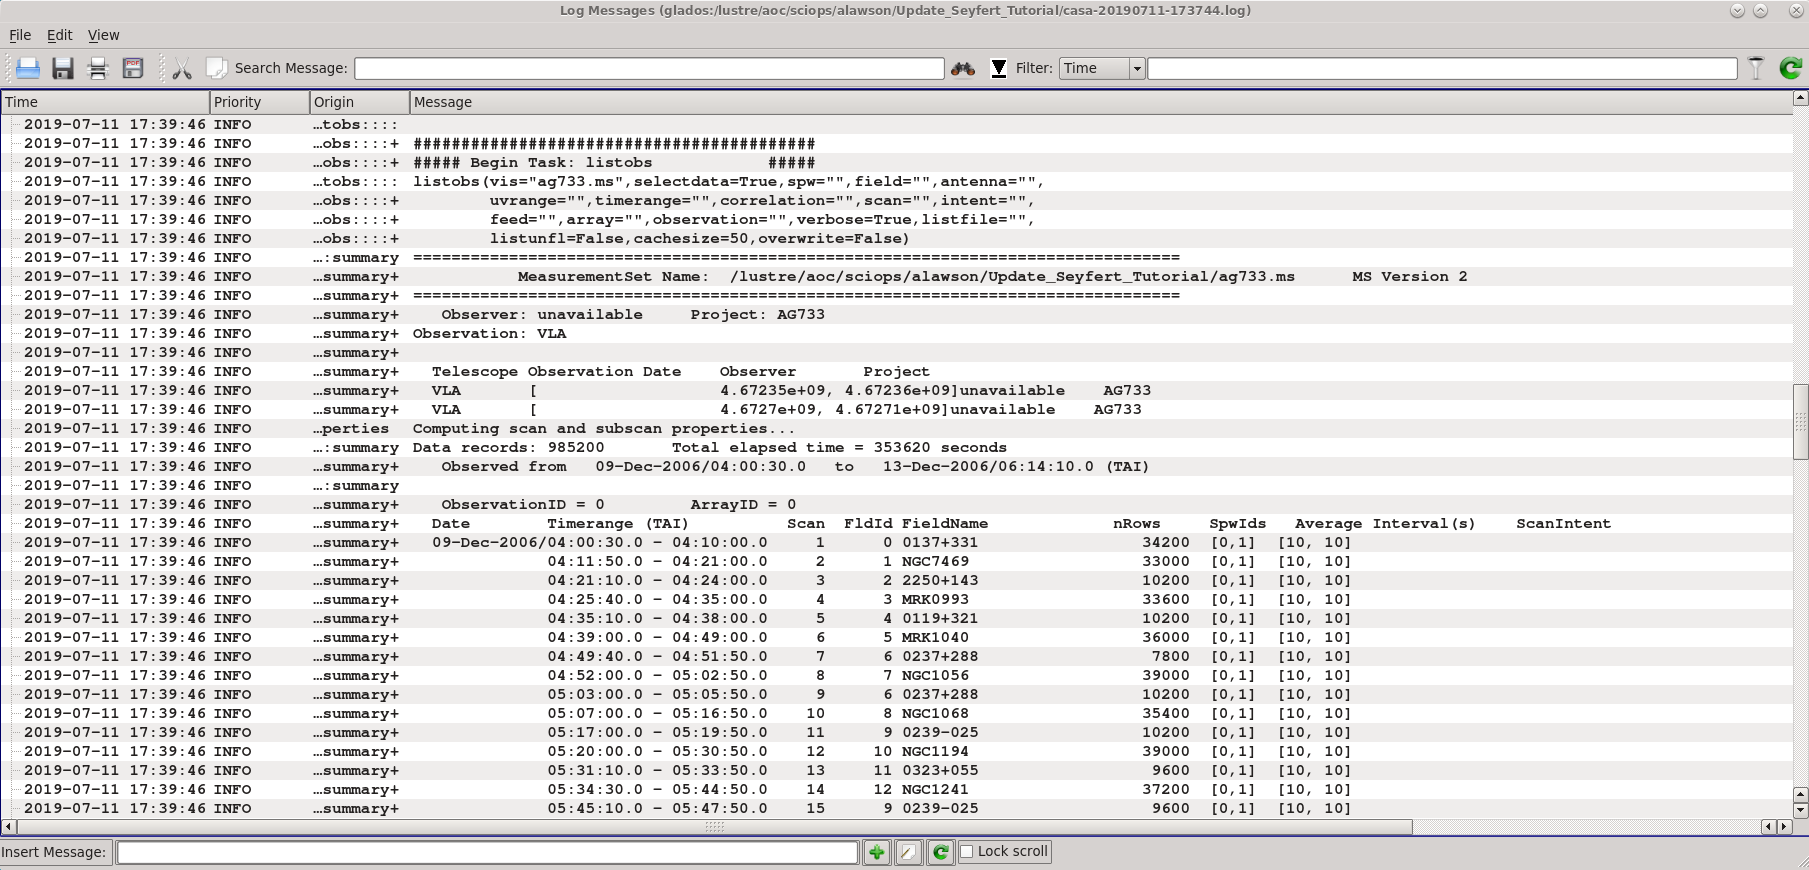
| 10:24, 19 July 2019 | PreEVLA Seyfert Example ListObs.png (file) |  |
346 KB | Example snippet of listobs output for program AG733. | 1 |
| 10:28, 19 July 2019 | PreEVLA Seyfert PlotAnts.png (file) |  |
57 KB | Graphics window produced by {{plotants}}. Shown are the antennas of the VLA for the program AG733. | 1 |
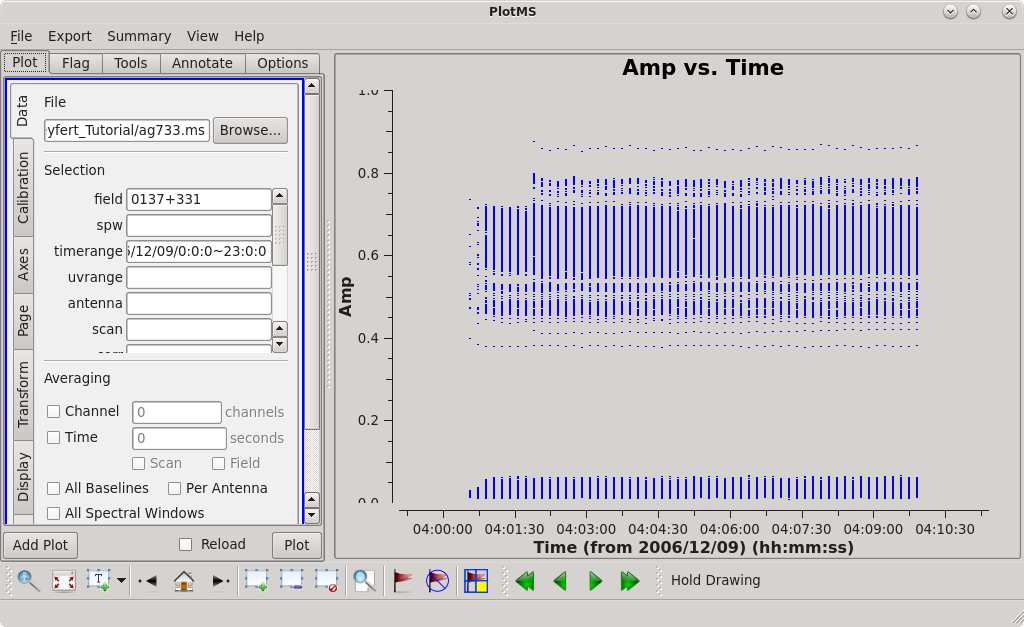
| 10:33, 19 July 2019 | PreEVLA Seyfert PlotMS.png (file) |  |
92 KB | The plotms GUI. | 1 |
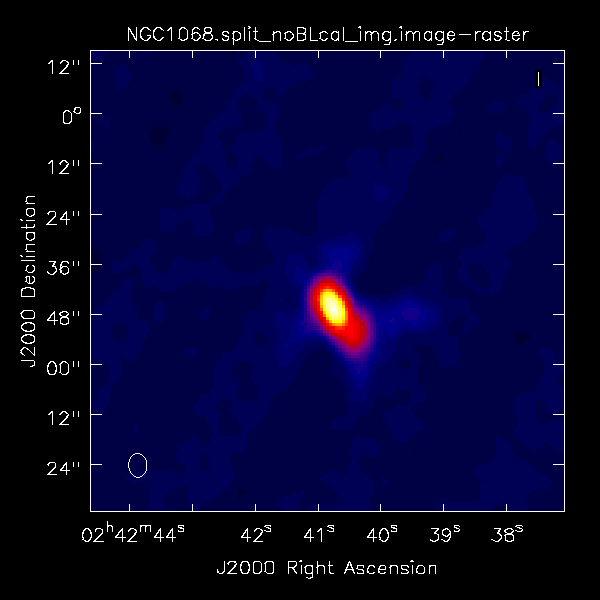
| 10:35, 19 July 2019 | PreEVLA Seyfert IntClean Noblcal.png (file) |  |
11 KB | Initial tclean image of NGC1068 ''without'' blcal. | 1 |
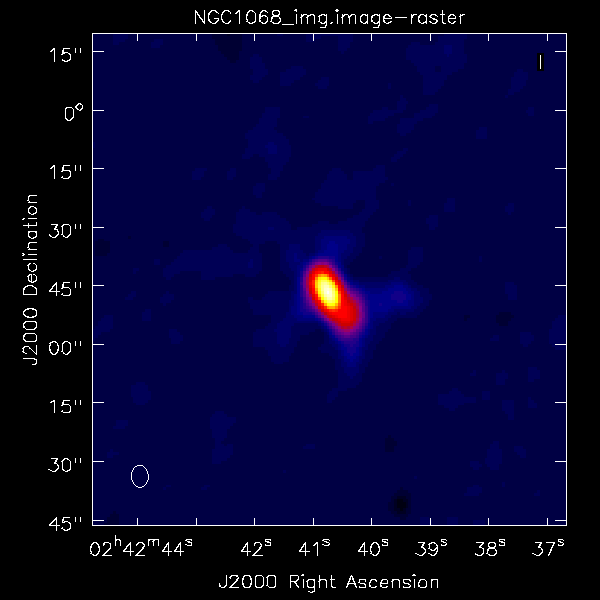
| 10:36, 19 July 2019 | PreELA Seyfert IntClean blcal.png (file) |  |
10 KB | Initial tclean image of NGC1068 ''with'' blcal applied. | 1 |
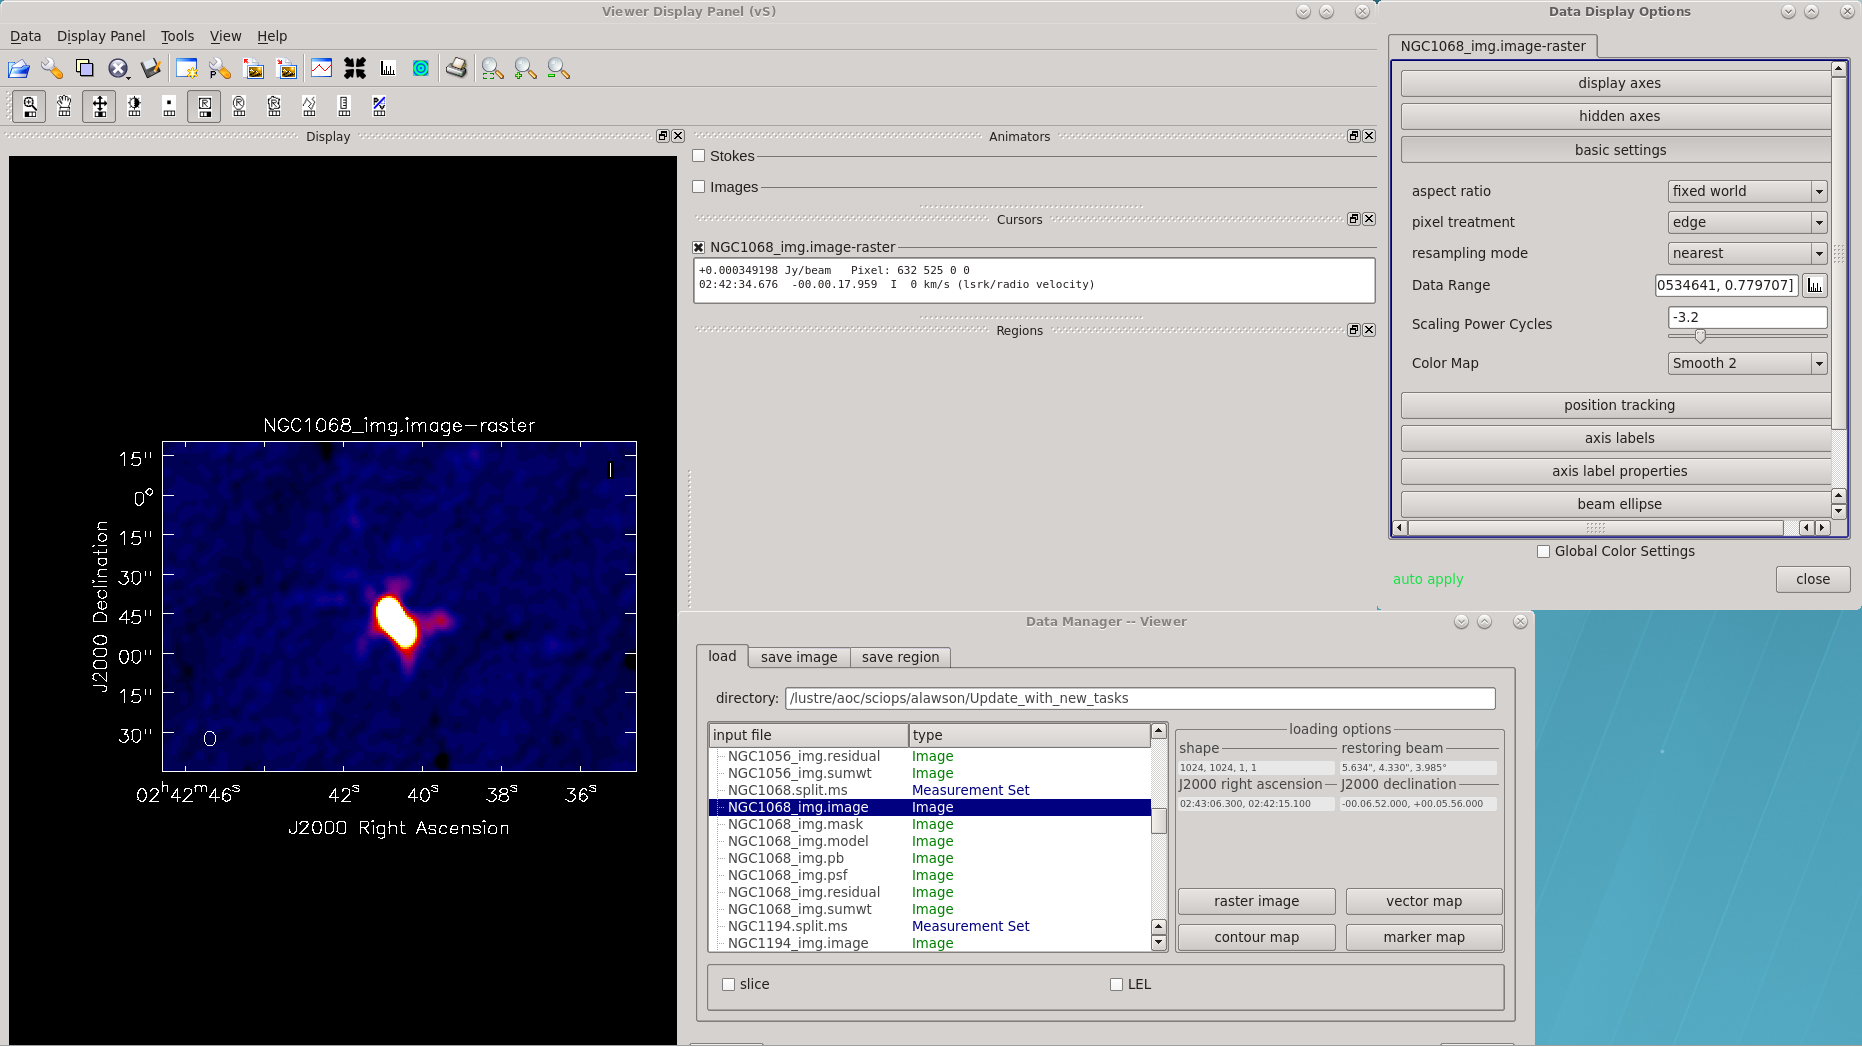
| 10:44, 19 July 2019 | PreEVLA Seyfert ExampleViewer.png (file) |  |
260 KB | An example desktop display of ''{{viewer}},'' showing the image display panel, the data display options window, and the data loader. | 1 |
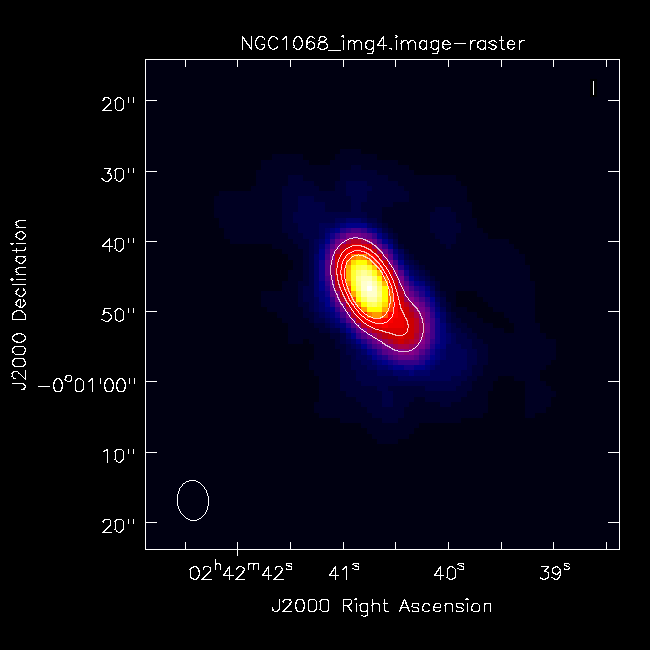
| 10:53, 19 July 2019 | PreEVLA Seyfert Final.png (file) |  |
12 KB | Final, self-calibrated image of NGC1068. | 1 |
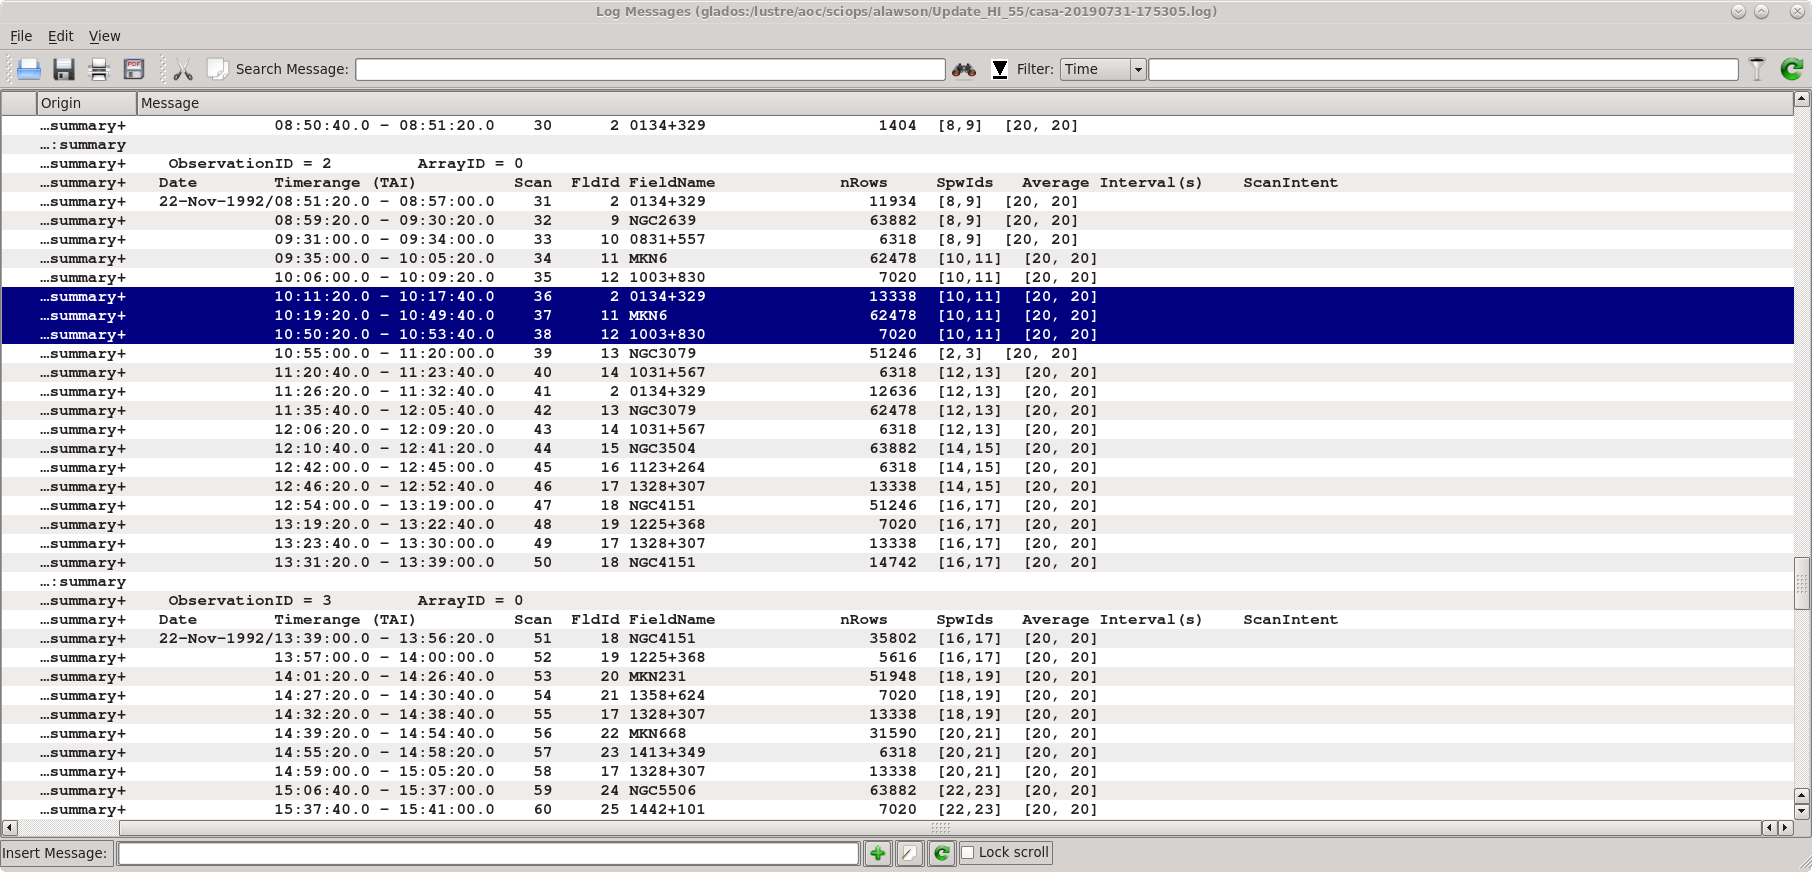
| 18:06, 31 July 2019 | MKN6 Listobs.png (file) |  |
318 KB | {{listobs}} output for AB658. The data for MKN 6 and its calibrators are highlighted. | 1 |
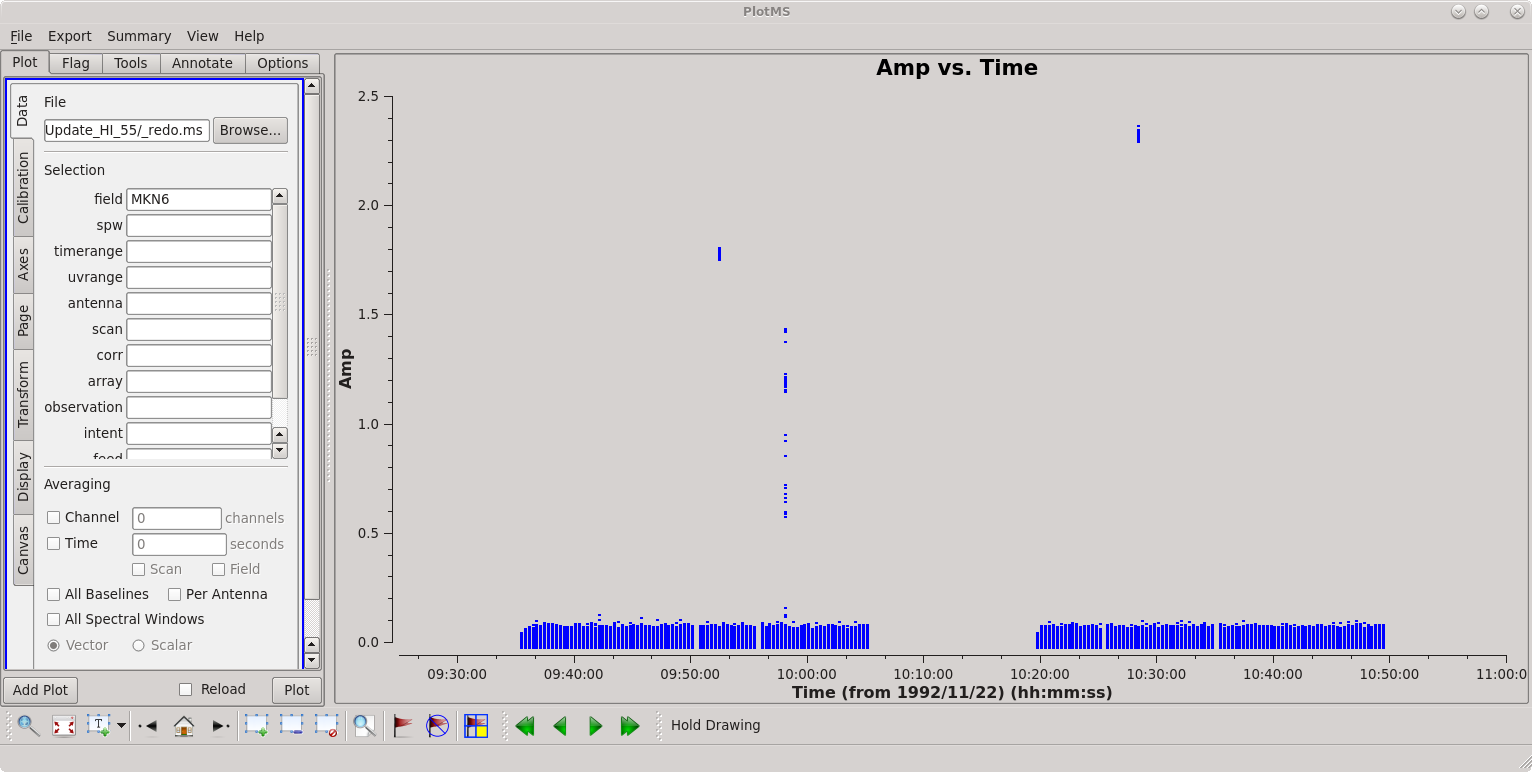
| 18:13, 31 July 2019 | MKN6 Amp vs Time.png (file) |  |
99 KB | Plotms display of (uncalibrated) visibility amplitudes vs. time for the source MKN 6. | 1 |
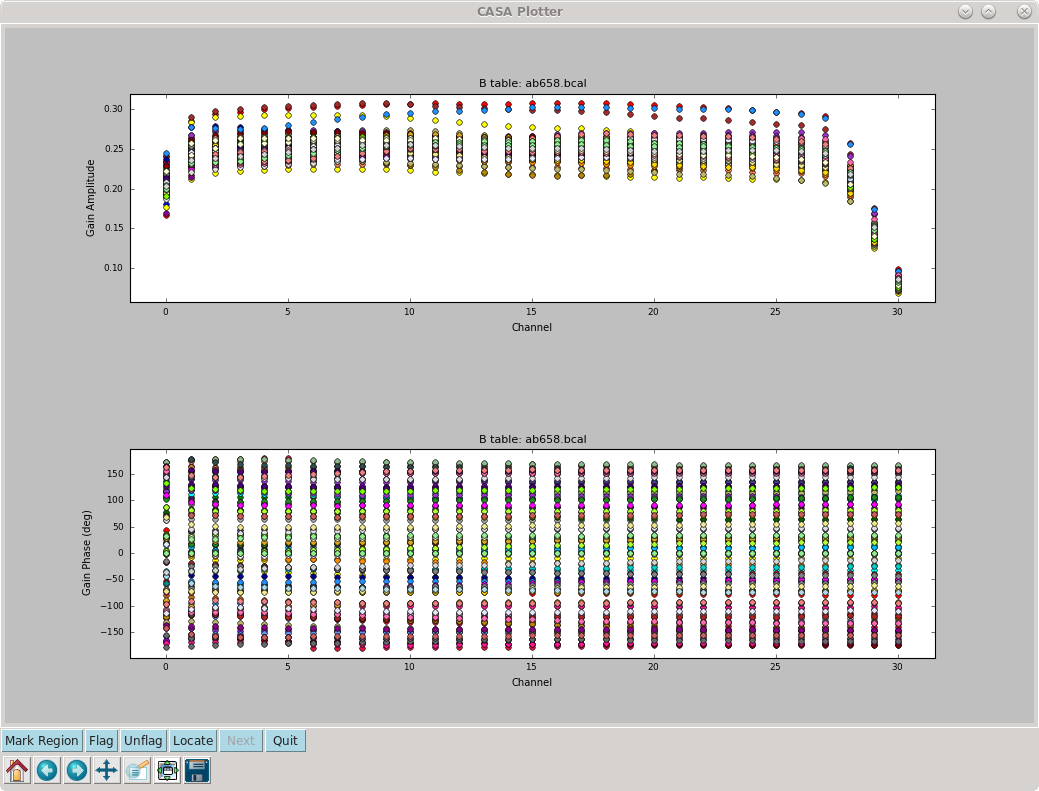
| 18:19, 31 July 2019 | MKN6 PlotCal Bandpass Cal Curves.png (file) |  |
137 KB | Bandpass calibration curves. Note that the response curve is flat between channels 2 and 27. | 1 |
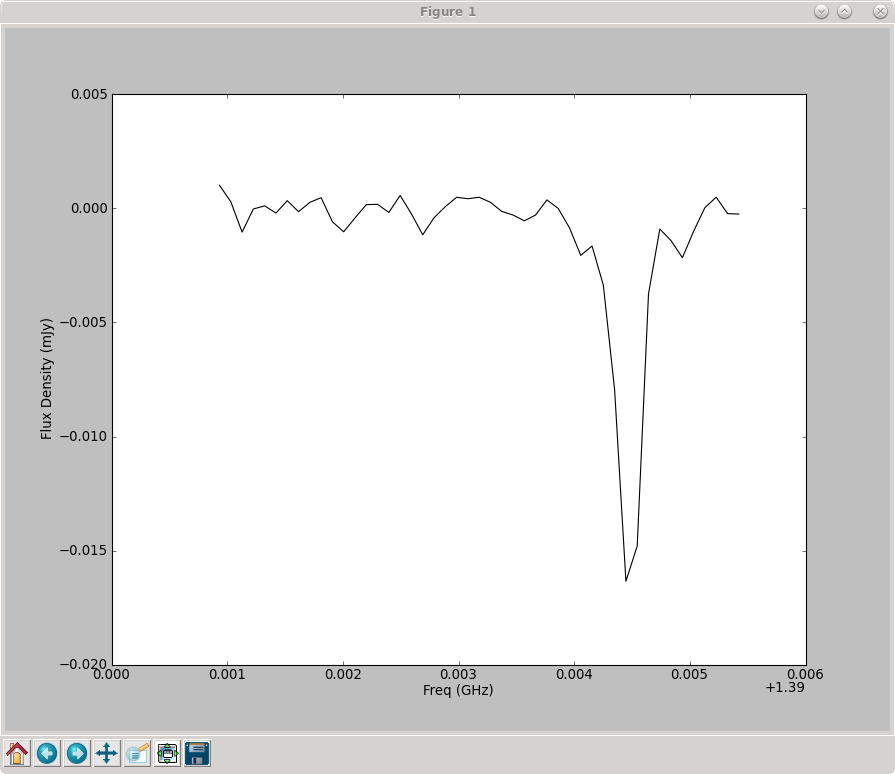
| 18:58, 31 July 2019 | MKN6 Absorption Spectrum.png (file) |  |
40 KB | Absorption spectrum of MKN 6 in frequency space. | 1 |
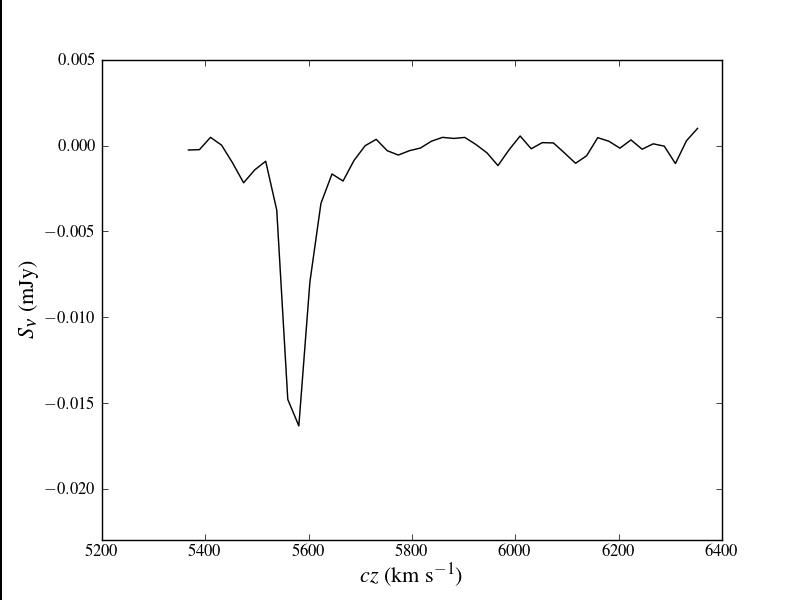
| 18:59, 31 July 2019 | MKN6 Absorption Spectrum Publication Ready.png (file) |  |
22 KB | Publication quality spectrum of MKN 6. | 1 |
| 12:34, 1 August 2019 | Save.png (file) |  |
1 KB | Save Icon | 1 |
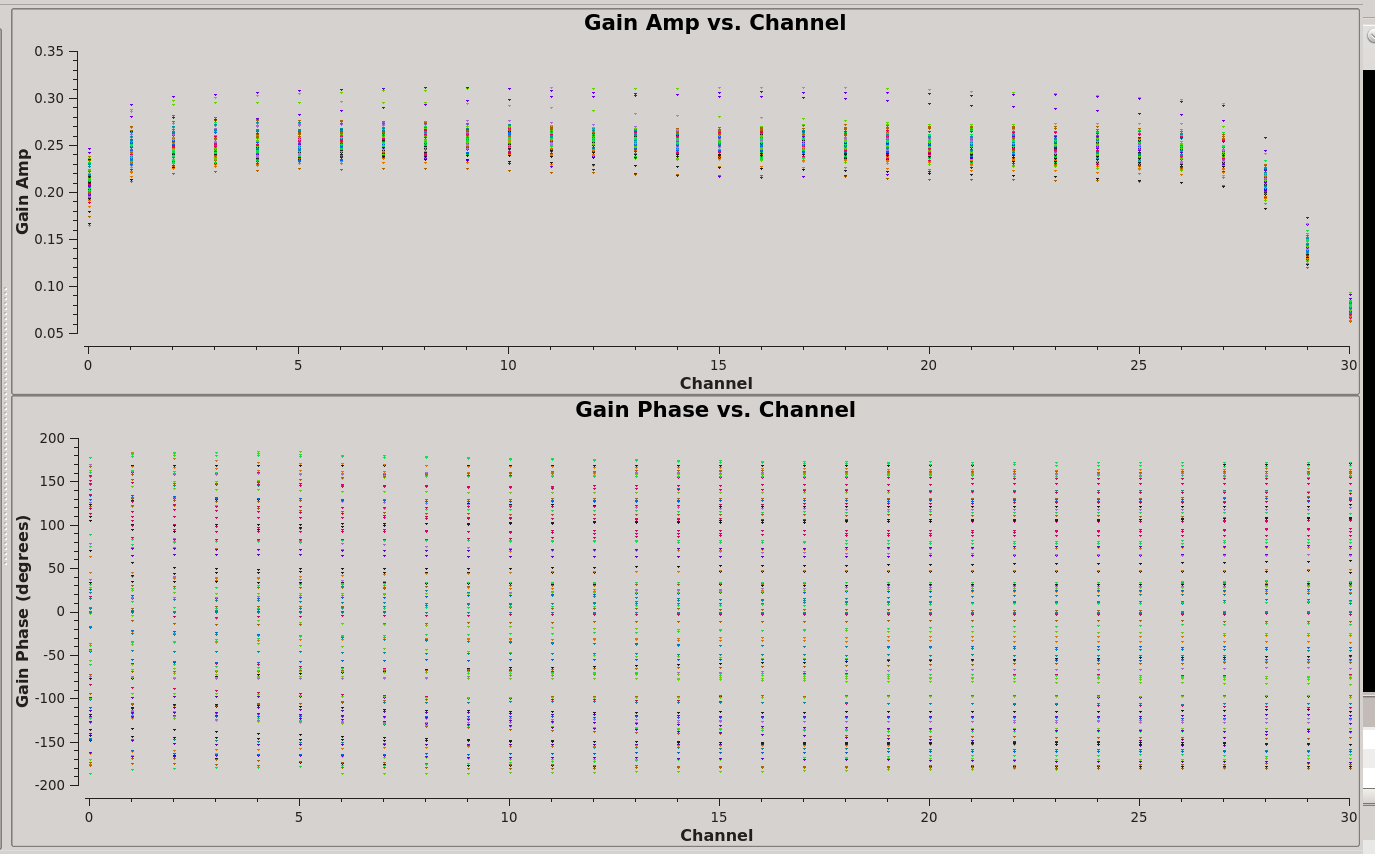
| 16:05, 30 August 2019 | MKN6 PlotCal Bandpass Cal Curves2.png (file) |  |
64 KB | Bandpass calibration curves. Note that the response curve is flat between channels 2 and 27. | 1 |
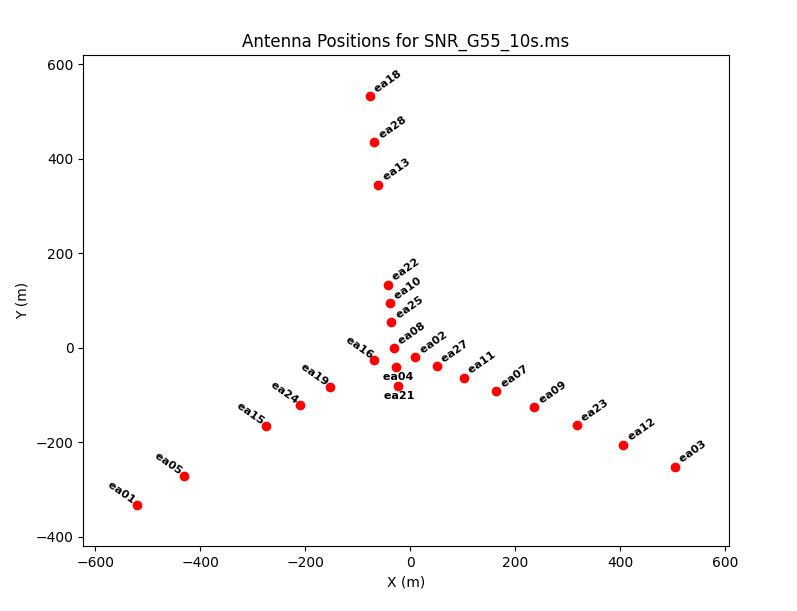
| 12:26, 10 June 2021 | PlotAnts.png (file) |  |
43 KB | Update to CASA6.2.0 | 4 |
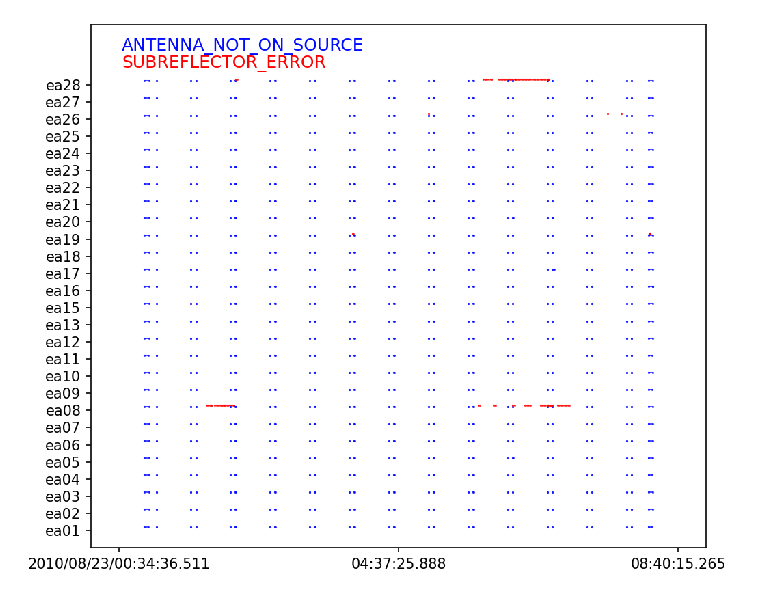
| 11:42, 11 June 2021 | OnlineFlags CASA6.2.0.png (file) |  |
45 KB | 1 | |
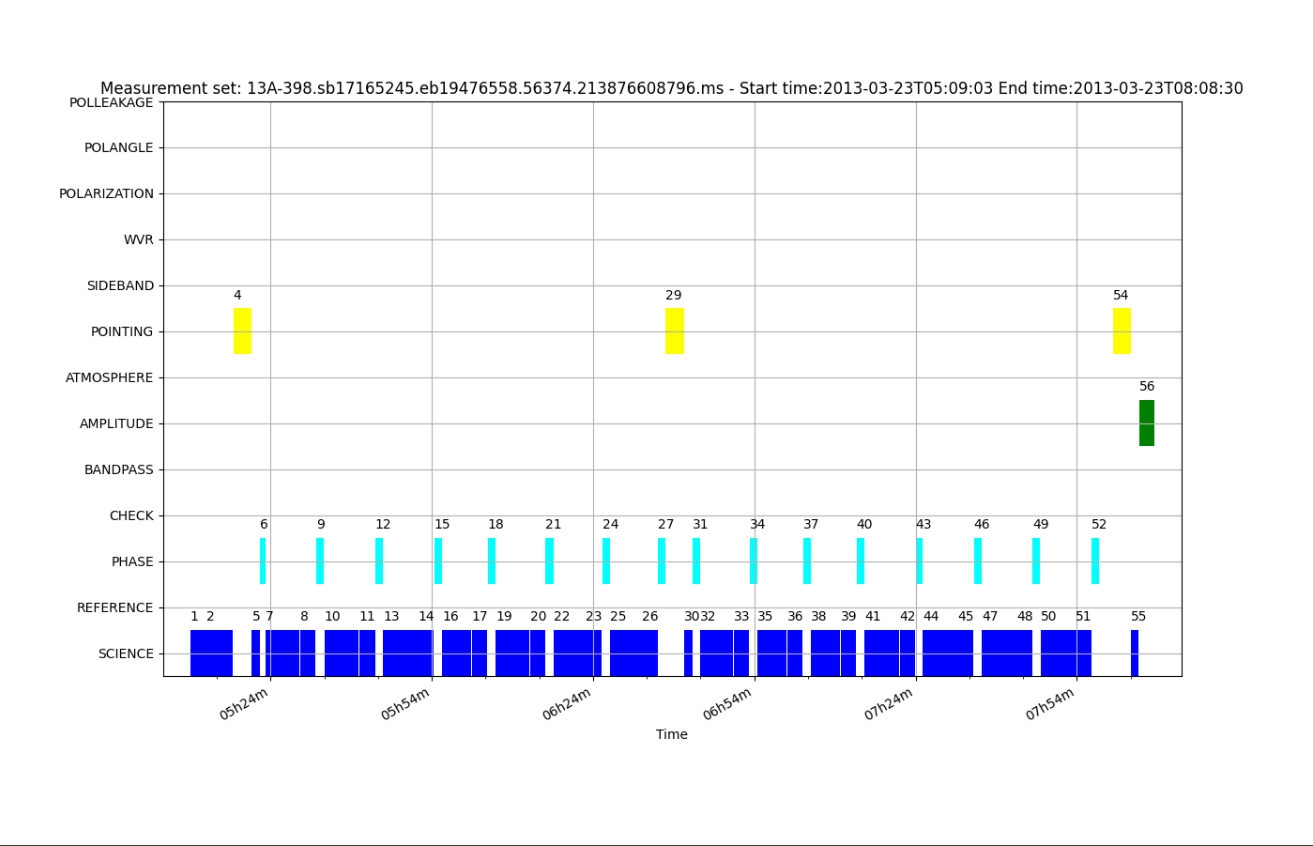
| 11:32, 20 December 2021 | IntentvsTime.png (file) |  |
104 KB | Plot showing scan intent vs time. | 1 |
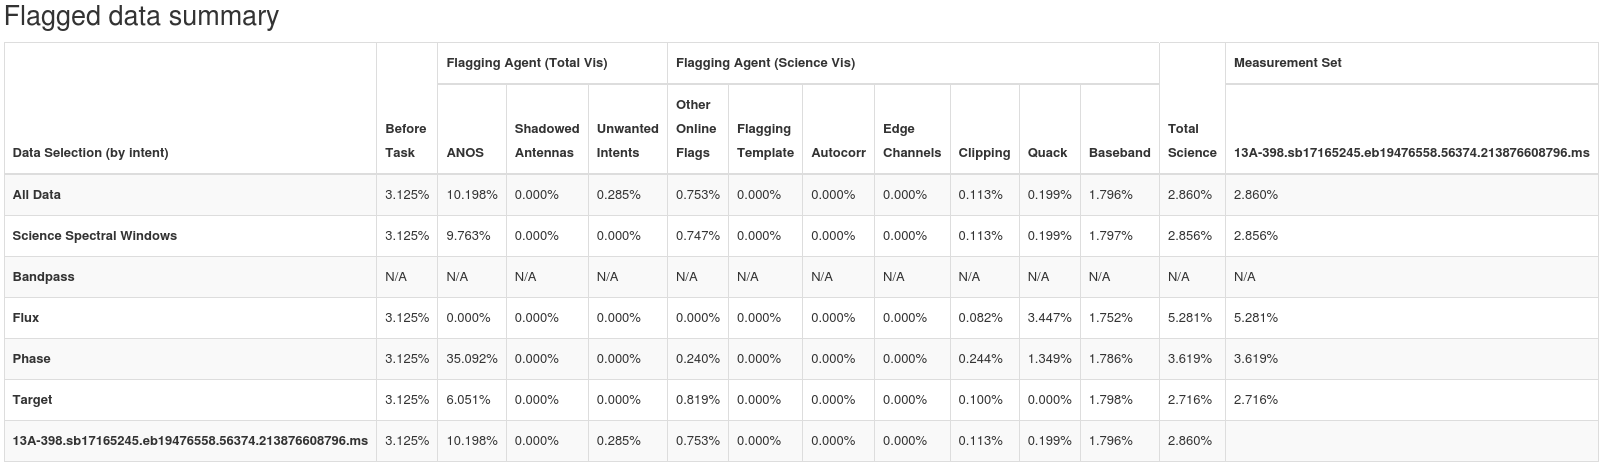
| 12:04, 20 December 2021 | FlaggedDataSummary.png (file) |  |
85 KB | Example of the table produced by the pipeline task hifv_flagdata that shows statistics on flagging performed by the task. | 1 |
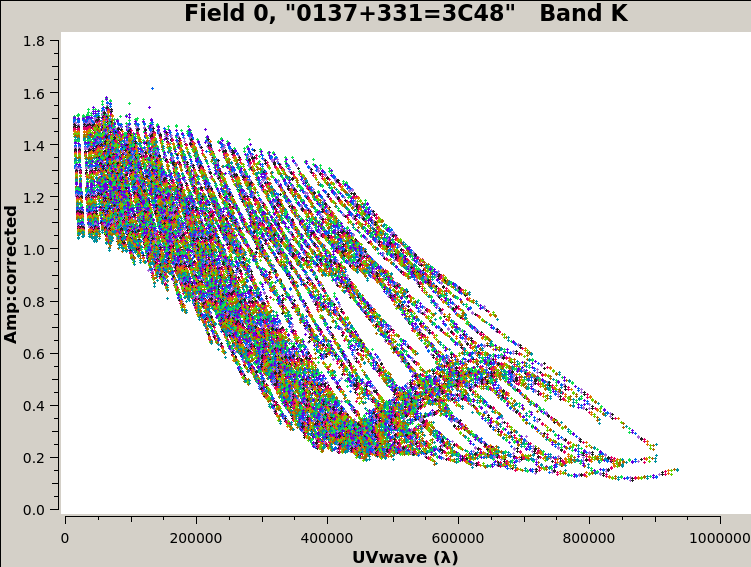
| 13:03, 20 December 2021 | 3C48 AmpvsUVwave.png (file) |  |
118 KB | Plot of 3C48's Corrected Amplitude vs UVwave for K-band data. | 1 |
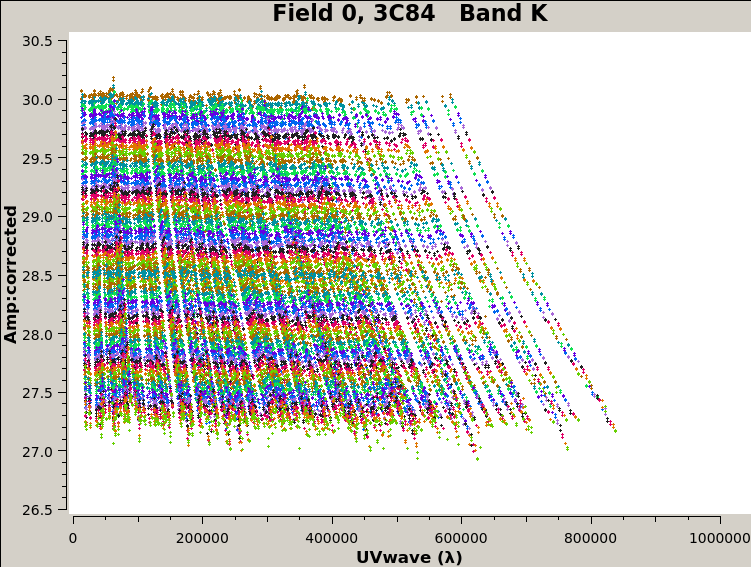
| 13:17, 20 December 2021 | 3C84 AmpvsUVwave.png (file) |  |
114 KB | Plot of Corrected Amplitude vs UVwave for 3C84, K-band, B-config. | 1 |
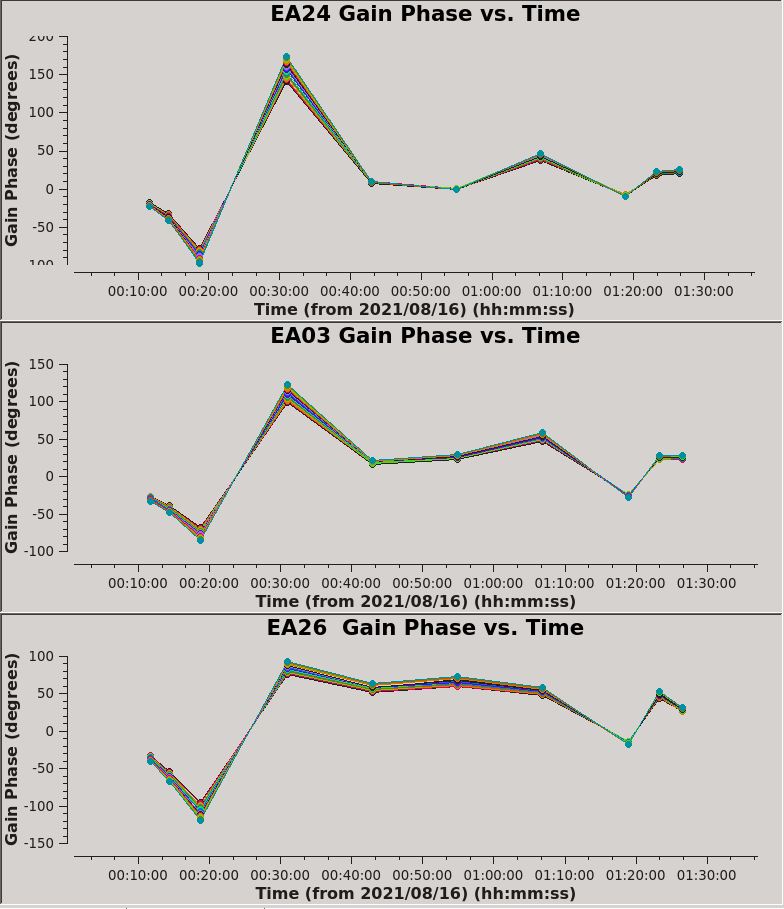
| 18:36, 22 December 2021 | WestArmPhaseJump.png (file) |  |
90 KB | Phase solutions of calibrator sources for three antennas on the end of the West Arm in B-config. | 1 |
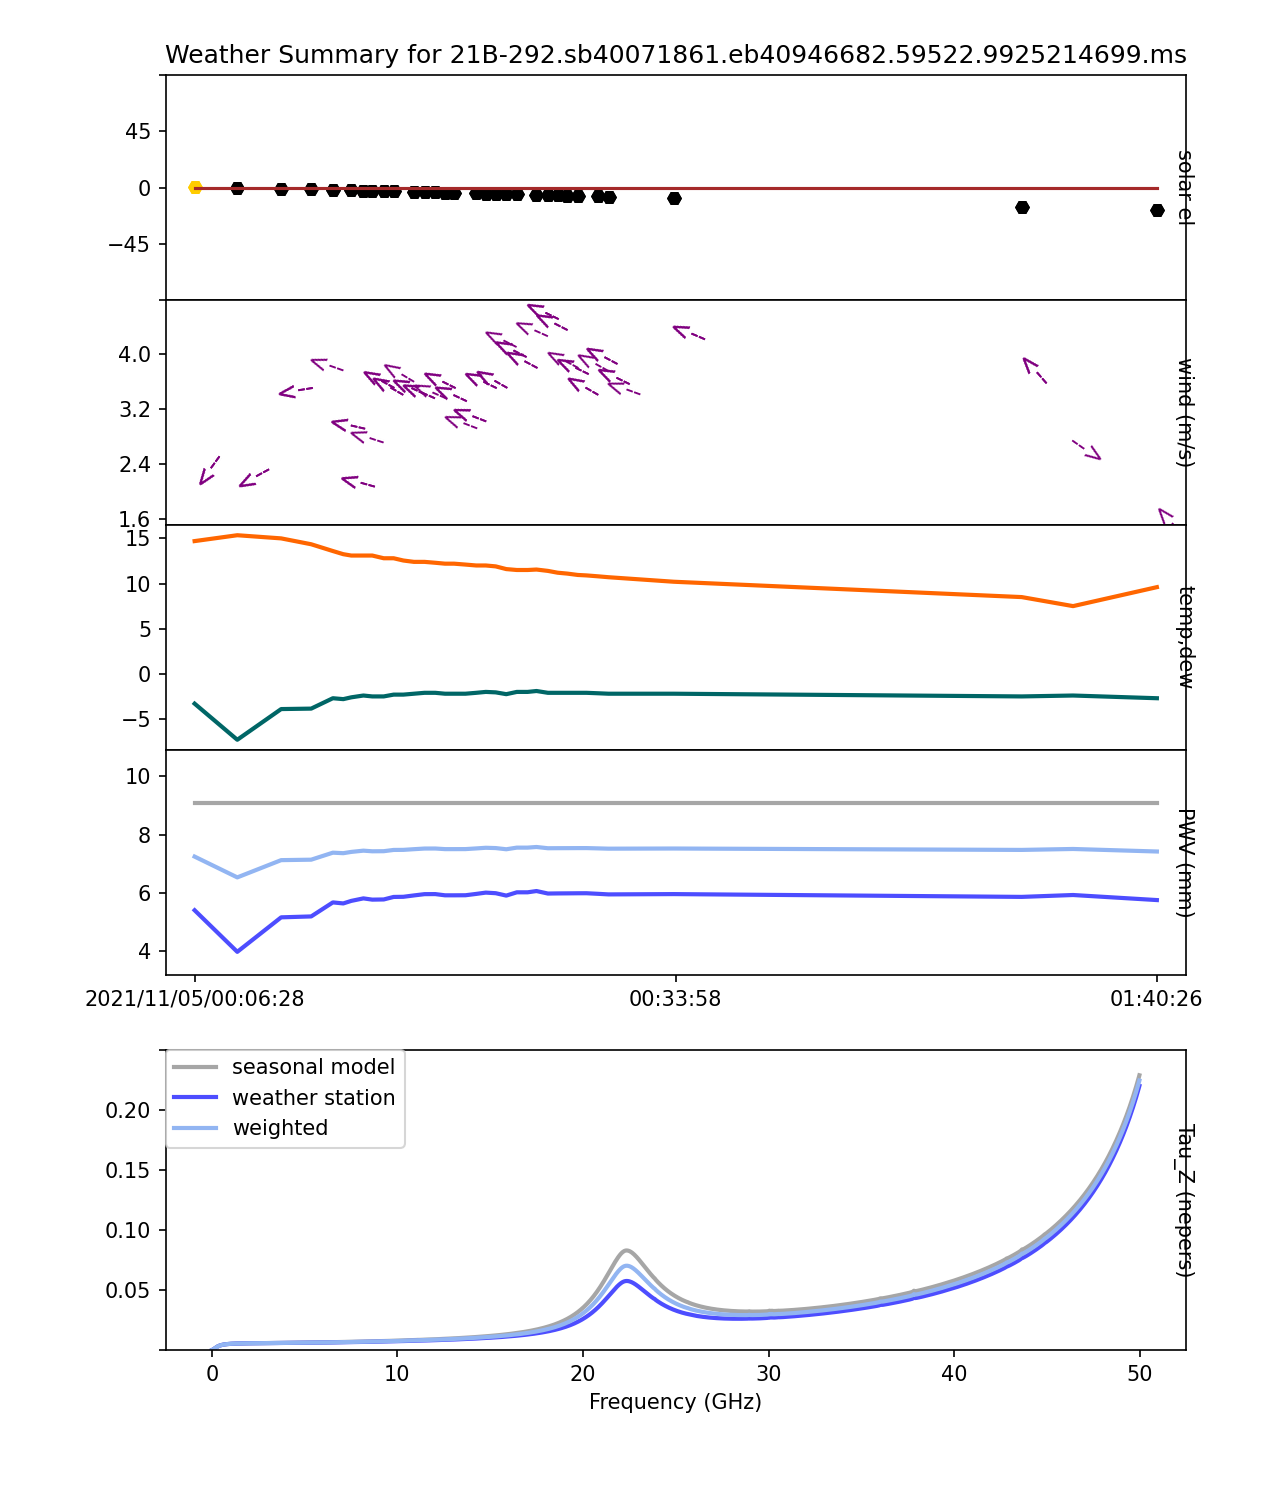
| 18:58, 22 December 2021 | WeatherStationOutage.png (file) |  |
144 KB | Plot generated by the plotweather task showing a period of time in which the local weather station was not recording data due to an outage. | 1 |
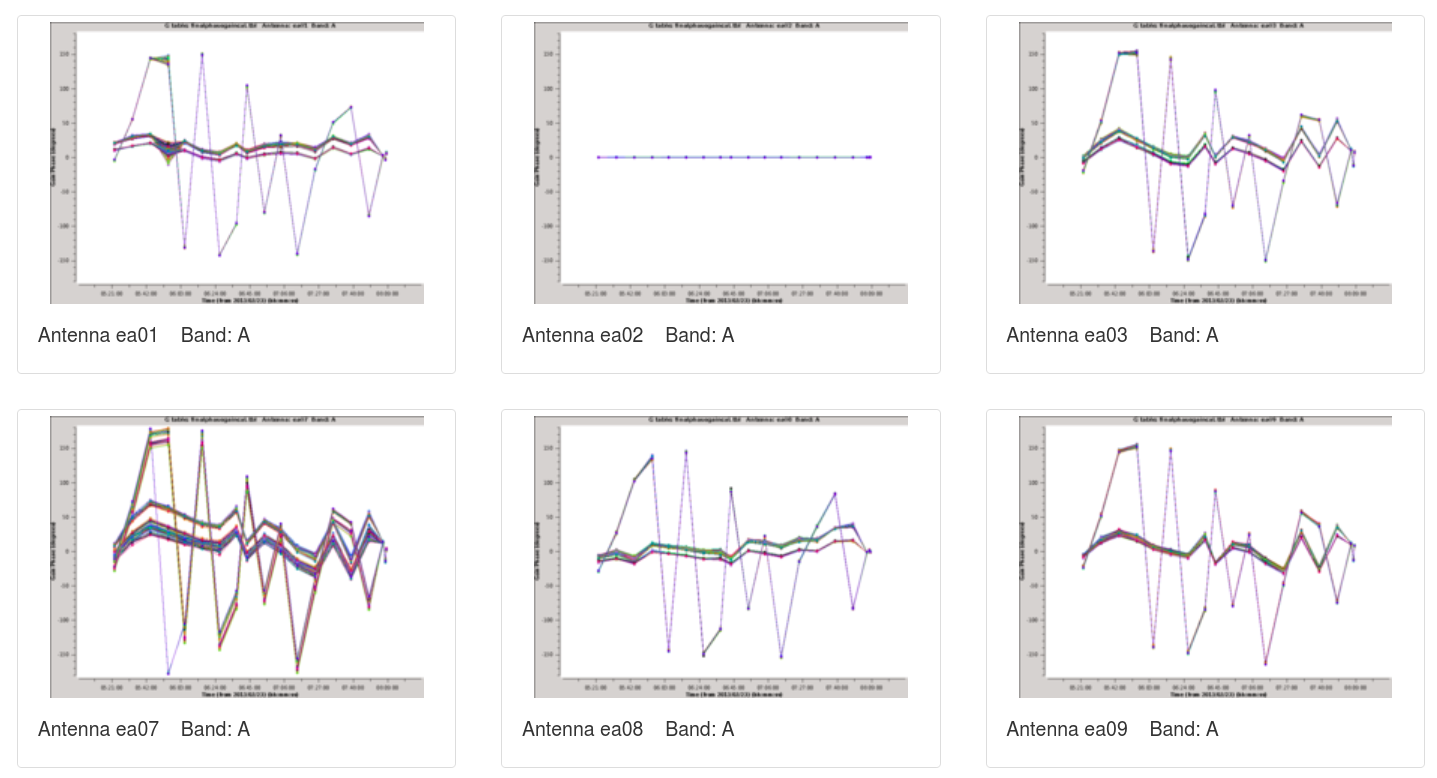
| 14:50, 27 December 2021 | Bad refant.png (file) |  |
274 KB | Plots of phase solutions vs time showing how phase issues can be spread to other antennas via the reference antenna. | 1 |
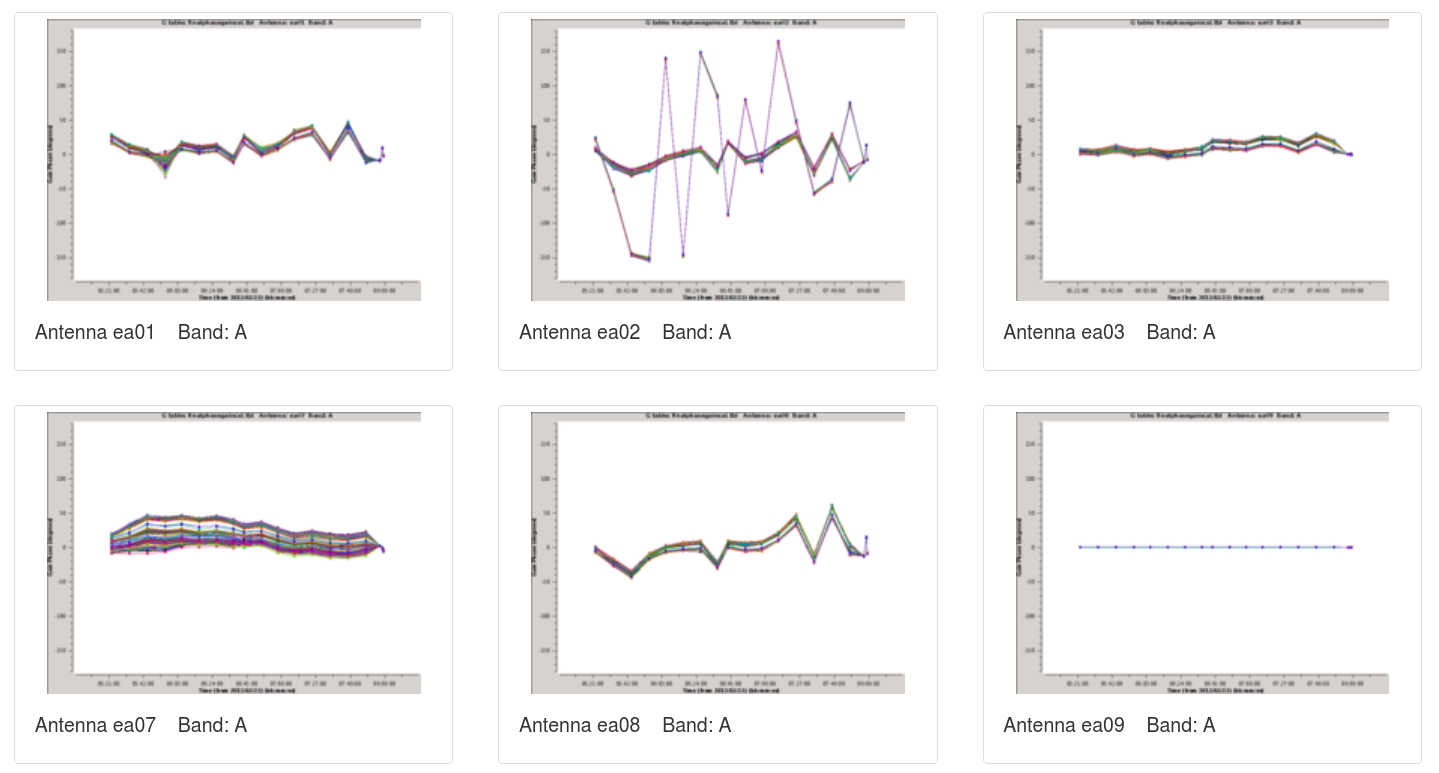
| 14:50, 27 December 2021 | Good refant.png (file) |  |
187 KB | Plots of phase solutions vs time showing a good reference antenna. Counter example of Bad_refant.png. | 1 |
| 12:09, 8 February 2022 | Switch3.png (file) |  |
16 KB | 1 | |
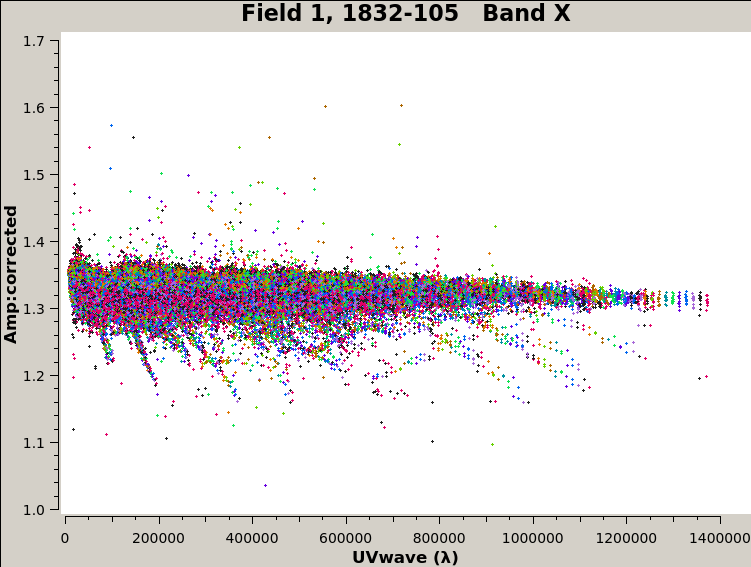
| 12:30, 22 April 2022 | LongSolint.png (file) |  |
71 KB | Corrected Amp. vs UVwave of a complex gain calibrator taken with X-band data in A-config. VLA Pipeline used a solution interval of ~160s. Decorrelation evident. | 1 |
| 12:31, 22 April 2022 | LongSolintFixed.png (file) |  |
55 KB | Corrected Amp. vs UVwave of a complex gain calibrator taken with X-band data in A-config. VLA Pipeline used a solution interval of ~40s. Decorrelation not evident. | 1 |
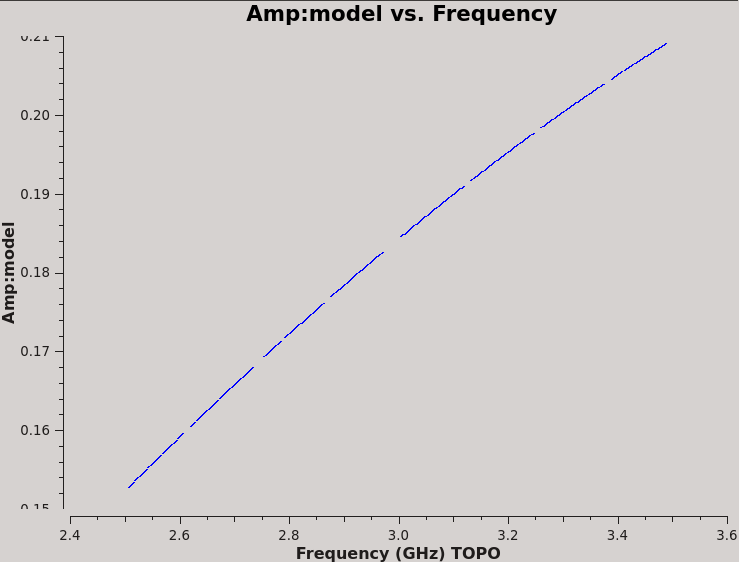
| 11:05, 4 January 2023 | Plotms-3C48-model-amp-RL-CASA6.4.1.png (file) |  |
23 KB | 1 | |
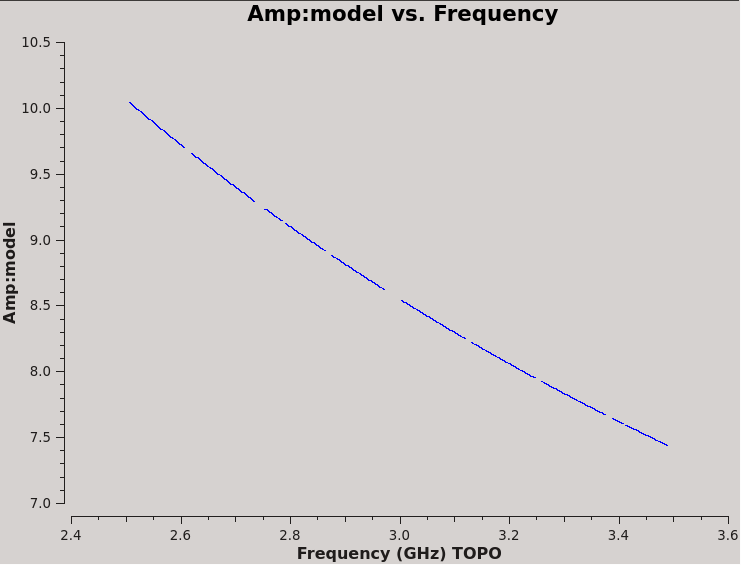
| 11:05, 4 January 2023 | Plotms-3C48-model-amp-RR-CASA6.4.1.png (file) |  |
23 KB | 1 | |
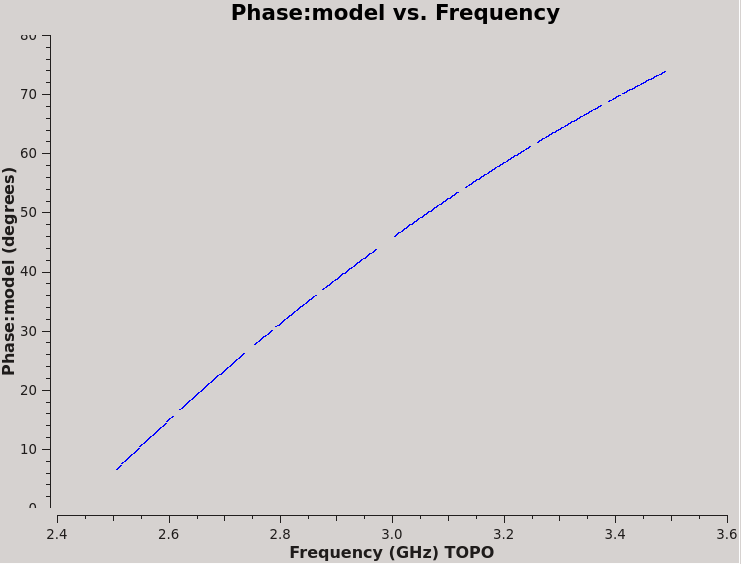
| 11:05, 4 January 2023 | Plotms-3C48-model-phs-RL-CASA6.4.1.png (file) |  |
26 KB | 1 | |
| 11:45, 4 January 2023 | Plotms-3C48-Kcross-delay-CASA6.4.1.png (file) |  |
20 KB | 1 | |
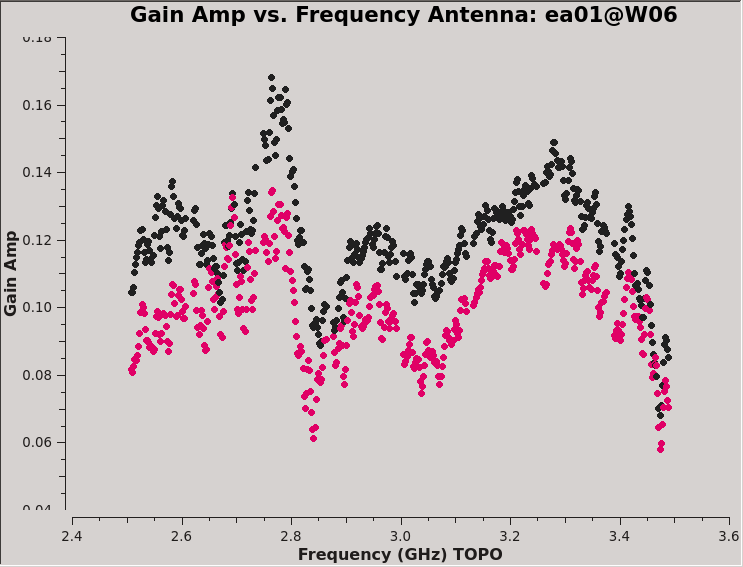
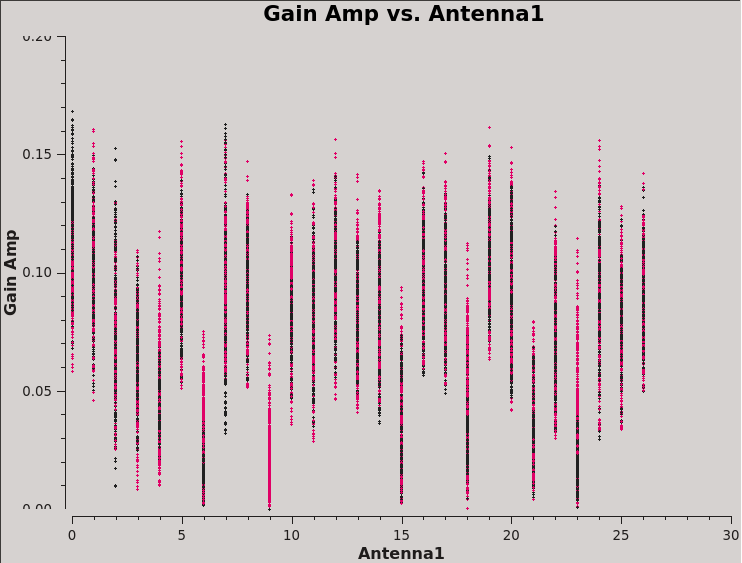
| 14:20, 4 January 2023 | Plotms-J0259-Damp-ea01-CASA6.4.1 Antennaea01@W06.png (file) |  |
38 KB | 1 | |
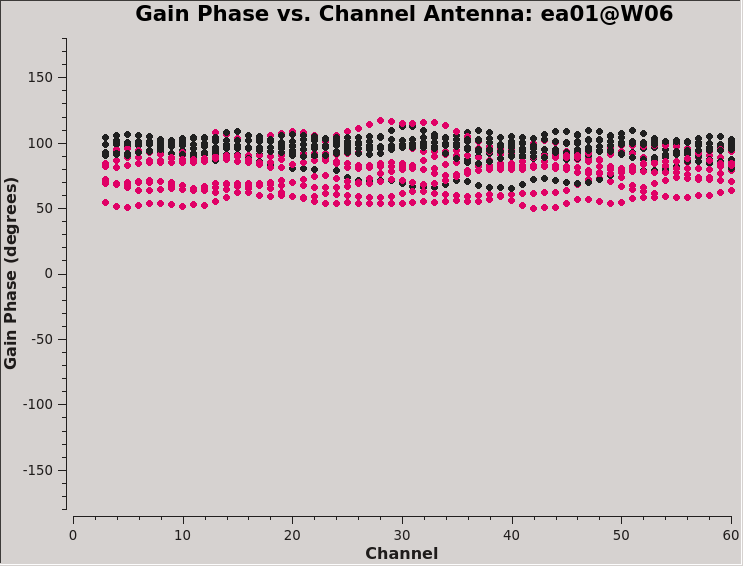
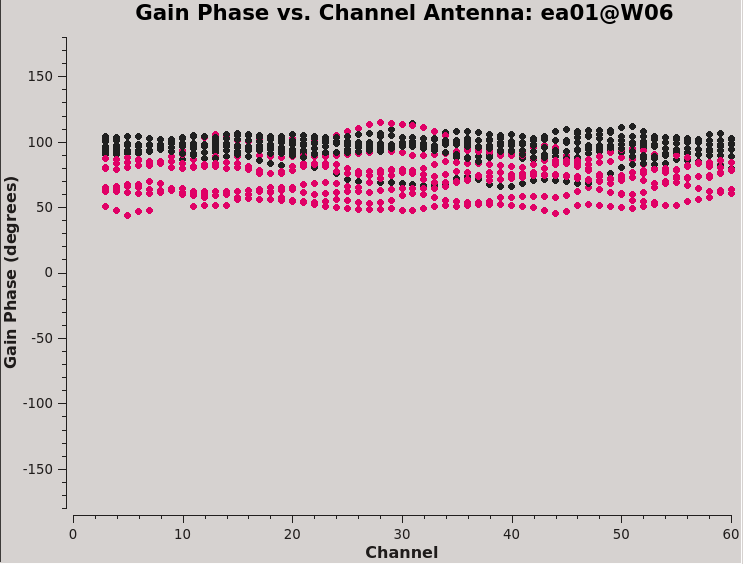
| 14:20, 4 January 2023 | Plotms-J0259-Dphs-ea01-CASA6.4.1 Antennaea01@W06.png (file) |  |
31 KB | 1 | |
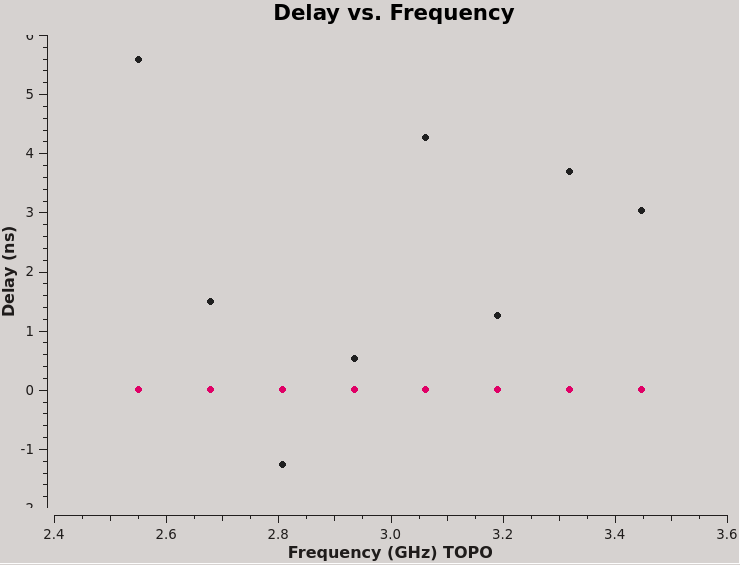
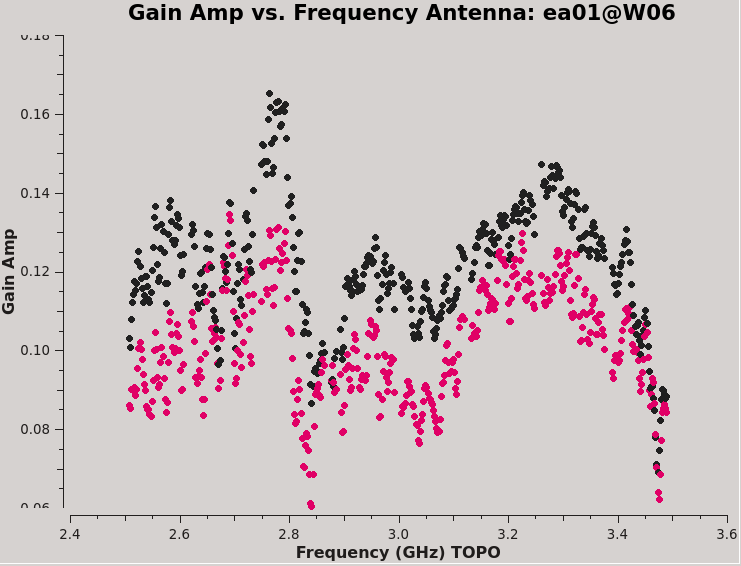
| 14:20, 4 January 2023 | Plotms-J2355-Damp-ea01-CASA6.4.1 Antennaea01@W06.png (file) |  |
38 KB | 1 | |
| 14:20, 4 January 2023 | Plotms-J2355-Dphs-ea01-CASA6.4.1 Antennaea01@W06.png (file) |  |
31 KB | 1 | |
| 14:49, 4 January 2023 | Plotms-J0259-DfQU-CASA6.4.1.png (file) |  |
28 KB | 1 | |
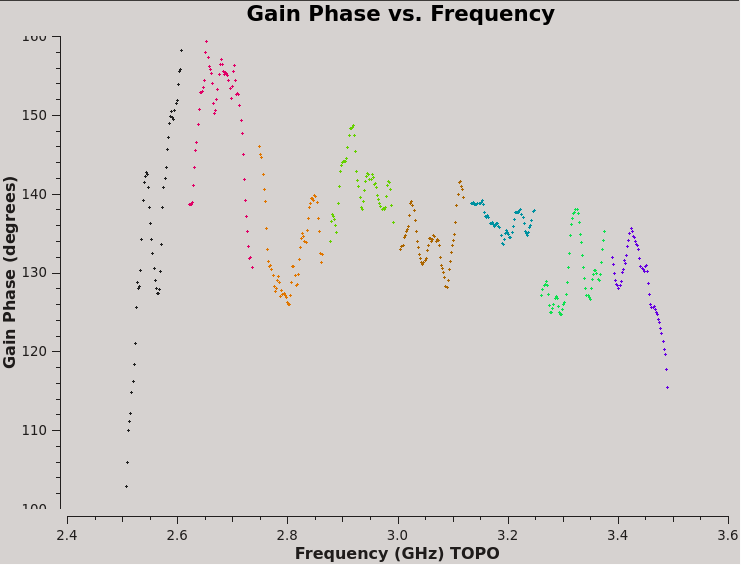
| 16:54, 4 January 2023 | Plotms-3C48-Xf-CASA6.4.1.png (file) |  |
29 KB | 1 | |
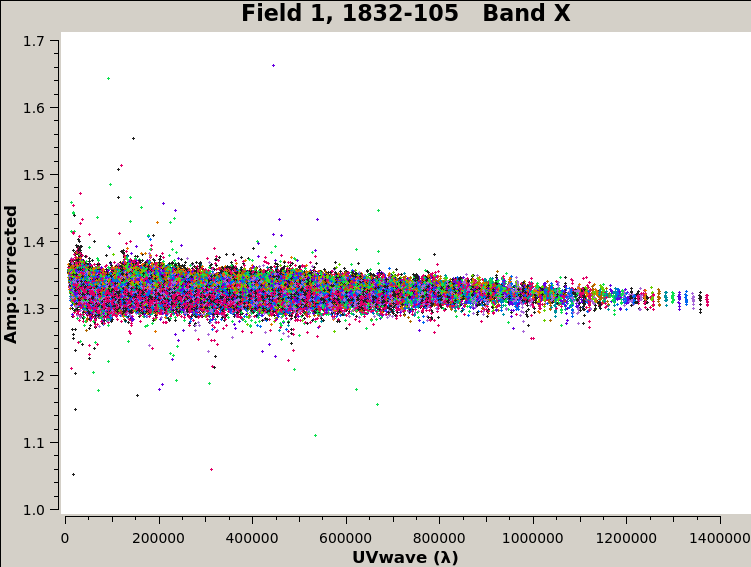
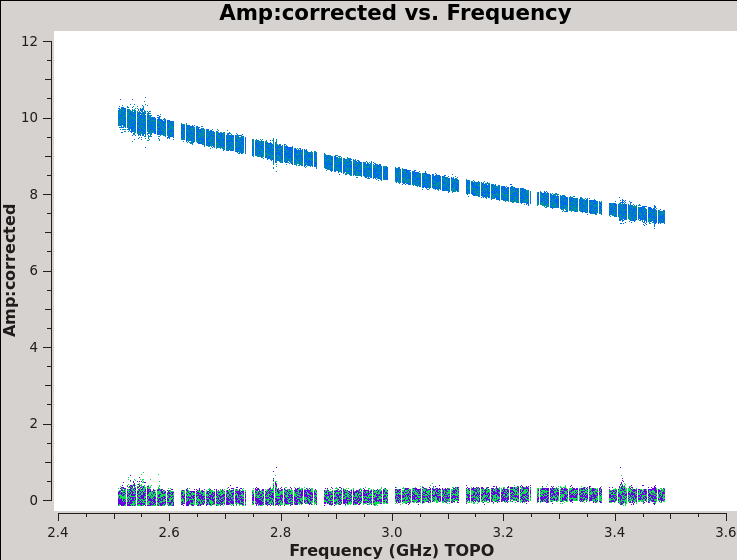
| 17:11, 4 January 2023 | Plotms-3C48-fld0-corrected-amp-CASA6.4.1.png (file) |  |
32 KB | 1 | |
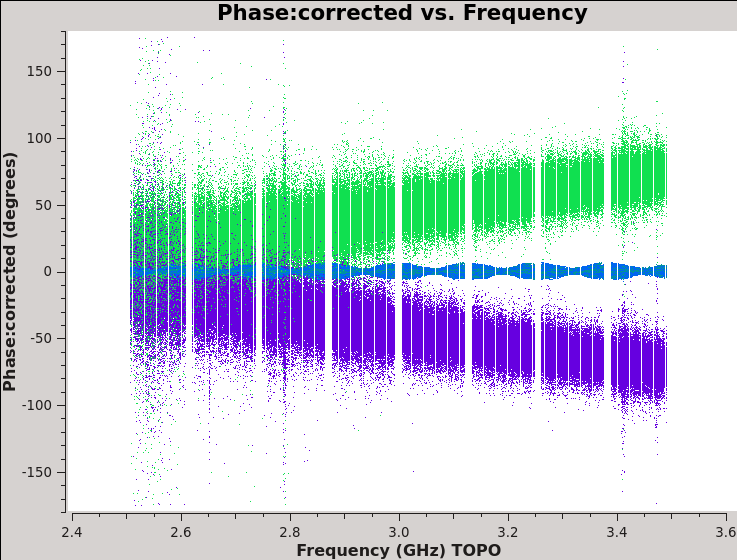
| 17:12, 4 January 2023 | Plotms-3C48-fld0-corrected-phase-CASA6.4.1.png (file) |  |
60 KB | 1 | |
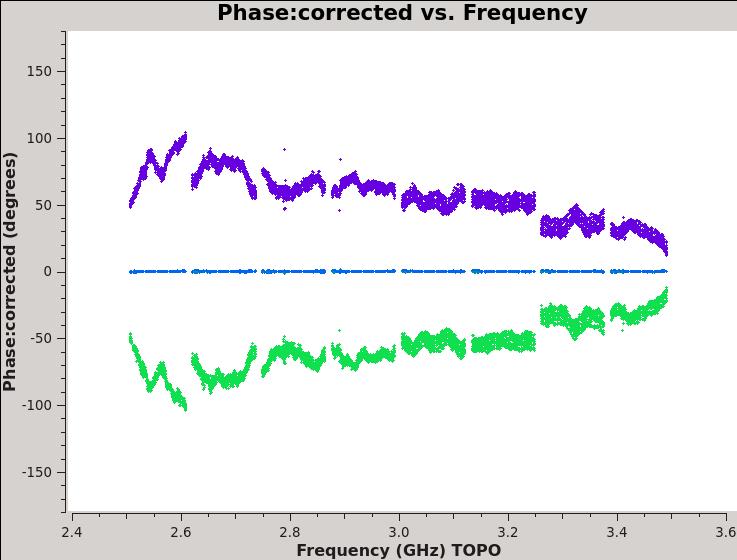
| 17:13, 4 January 2023 | Plotms-J0259-fld2-corrected-phase-CASA6.4.1.png (file) |  |
31 KB | 1 | |
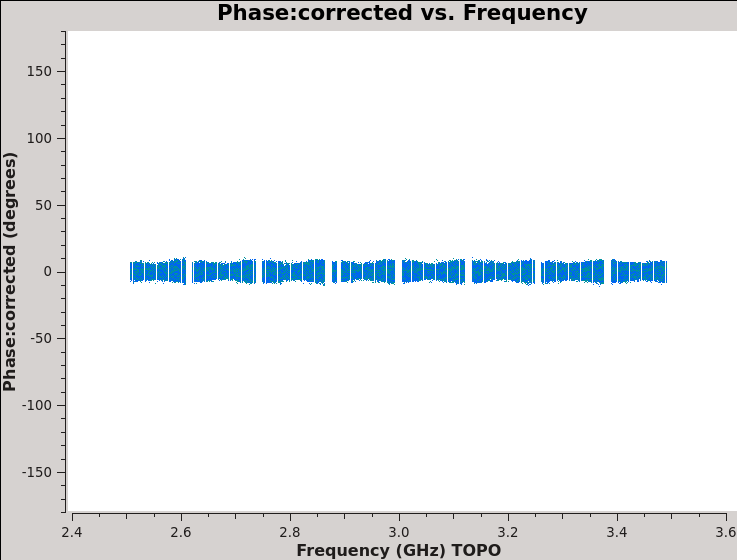
| 17:13, 4 January 2023 | Plotms-J2355-fld1-corrected-phase-CASA6.4.1.png (file) |  |
30 KB | 1 | |
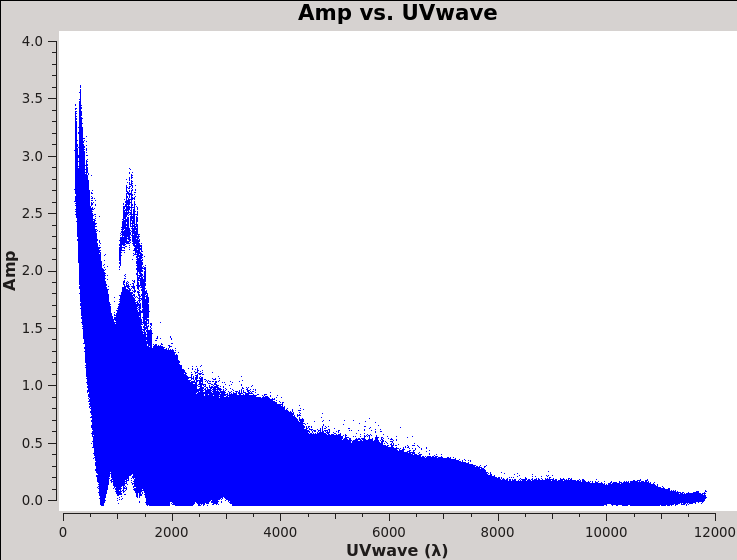
| 18:06, 4 January 2023 | Plotms 3c75-uvwave-CASA6.4.1.png (file) |  |
22 KB | 1 | |
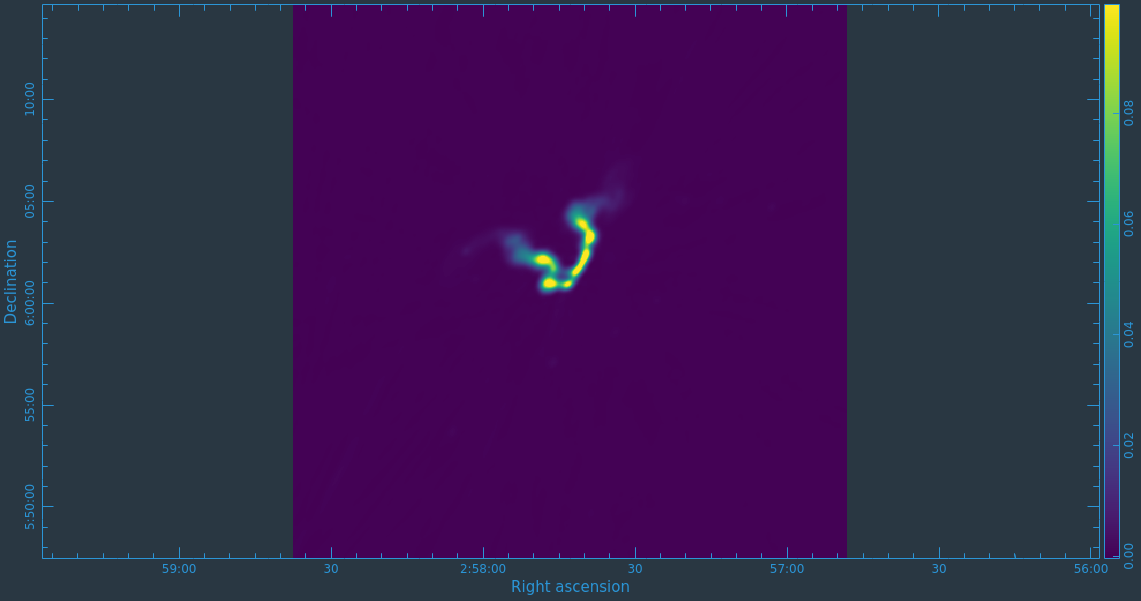
| 11:24, 5 January 2023 | 3c75-CARTA-multiscale-initialI-CASA6.4.1.png (file) |  |
80 KB | 1 | |
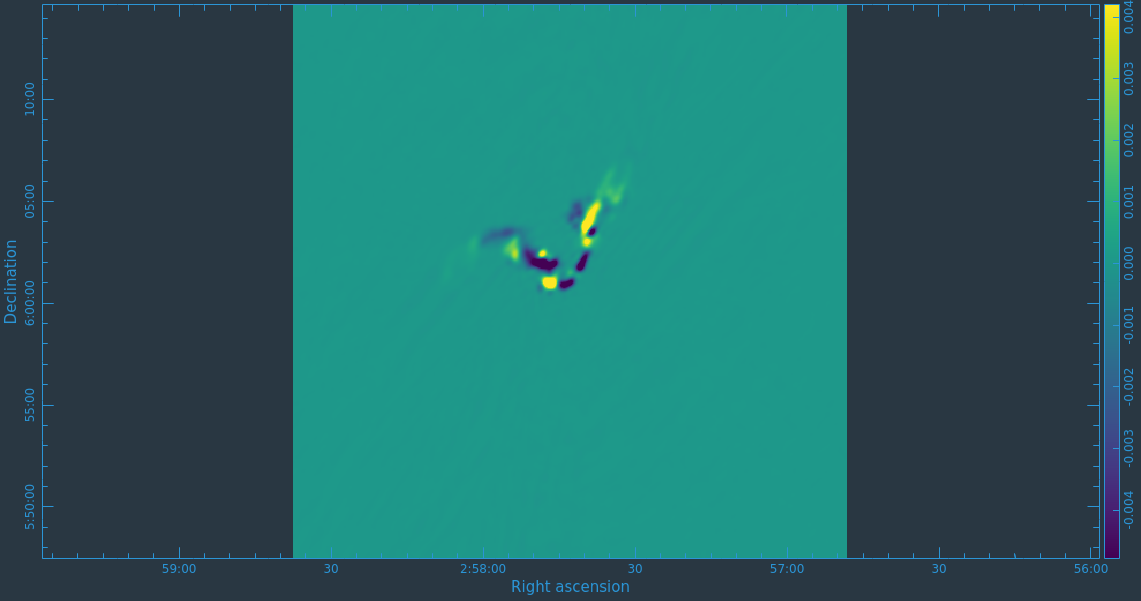
| 11:24, 5 January 2023 | 3c75-CARTA-multiscale-initialQ-CASA6.4.1.png (file) |  |
113 KB | 1 | |
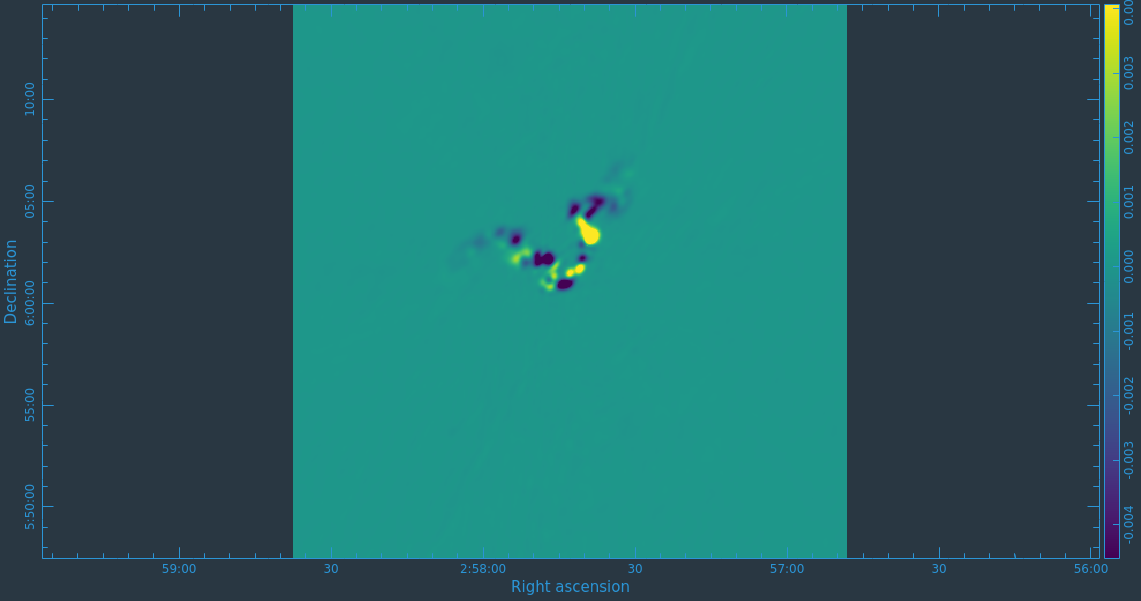
| 11:24, 5 January 2023 | 3c75-CARTA-multiscale-initialU-CASA6.4.1.png (file) |  |
123 KB | 1 | |
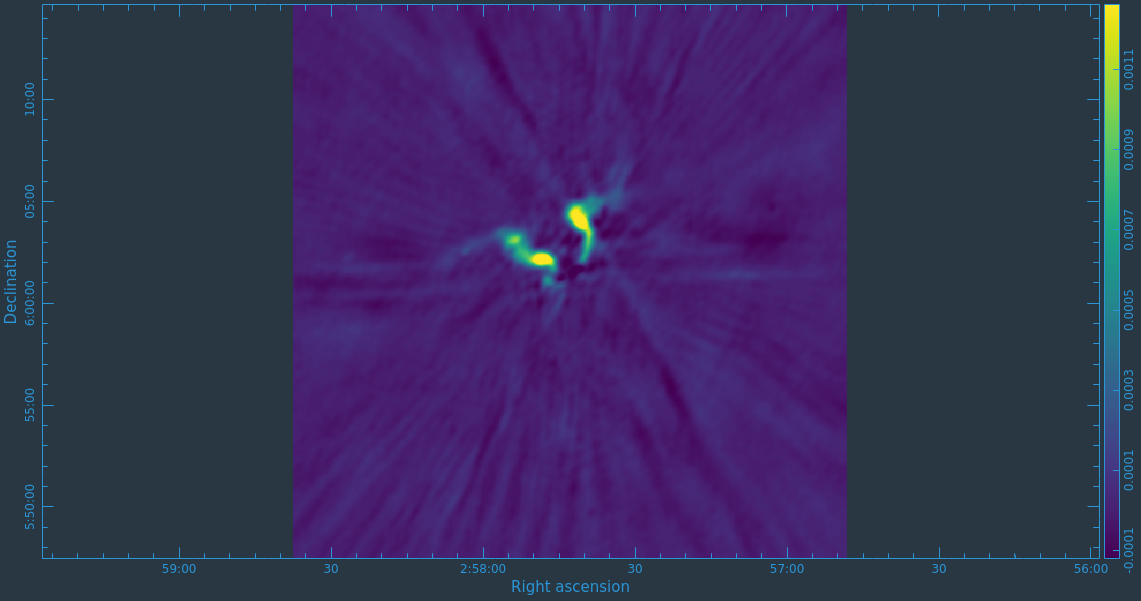
| 11:24, 5 January 2023 | 3c75-CARTA-multiscale-initialV-CASA6.4.1.png (file) |  |
233 KB | 1 | |
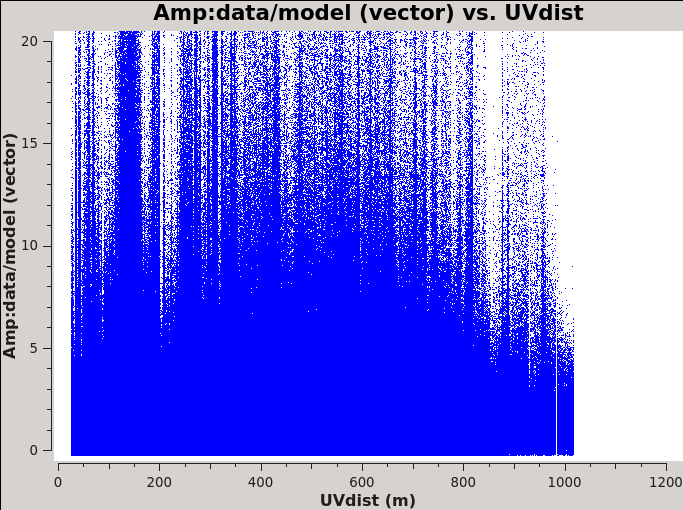
| 14:44, 5 January 2023 | Plotms-3c75-uvdist-residRL-CASA6.4.1-corr.png (file) |  |
55 KB | 1 | |
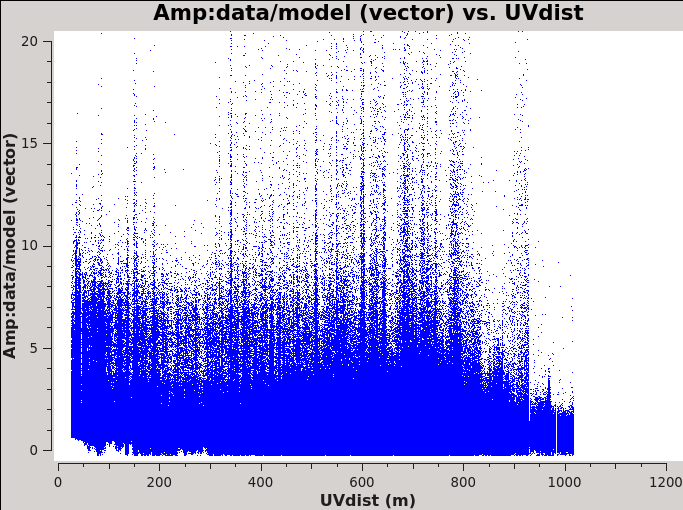
| 14:44, 5 January 2023 | Plotms-3c75-uvdist-residRR-CASA6.4.1-corr.png (file) |  |
51 KB | 1 | |
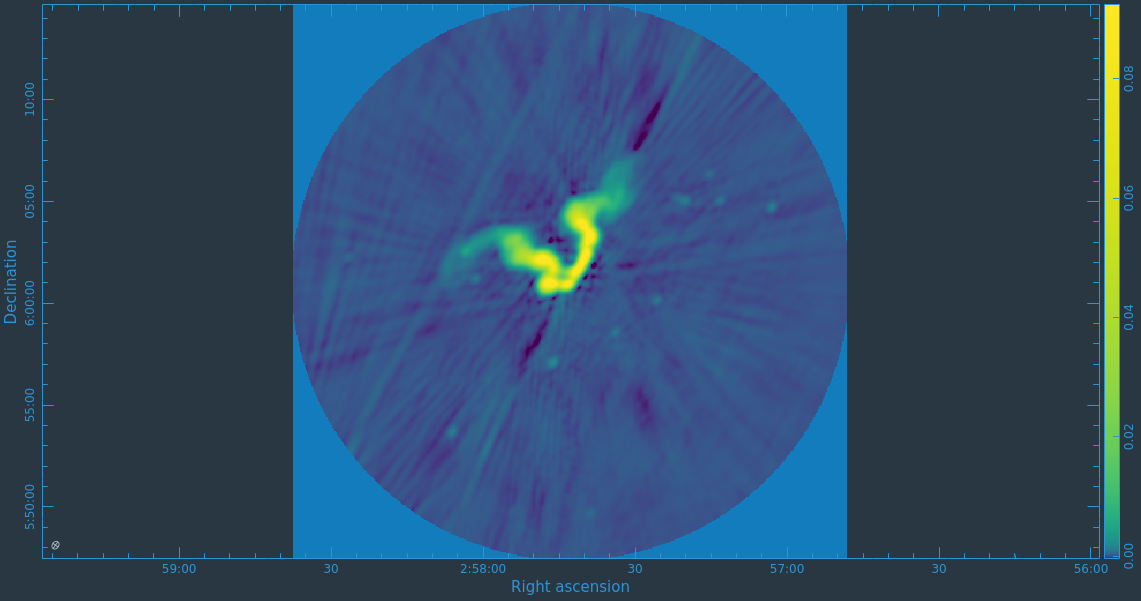
| 13:38, 10 January 2023 | 3c75-initial I-CASA6.4.1.png (file) |  |
253 KB | 1 | |
| 13:38, 10 January 2023 | 3c75-selfcal 2-CASA6.4.1.png (file) |  |
224 KB | 1 |