Uploads by Smyers
From CASA Guides
Jump to navigationJump to search
This special page shows all uploaded files.
| Date | Name | Thumbnail | Size | Description | Versions |
|---|---|---|---|---|---|
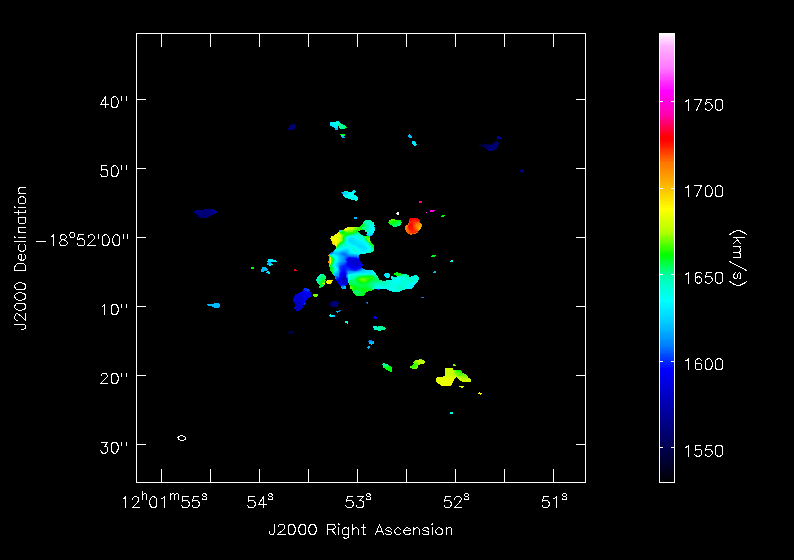
| 19:11, 29 May 2012 | Antennae North.CO3 2Line.Clean.selfcal1.pbcorimage.mom1.png (file) |  |
15 KB | moment 1 image north mosaic | 1 |
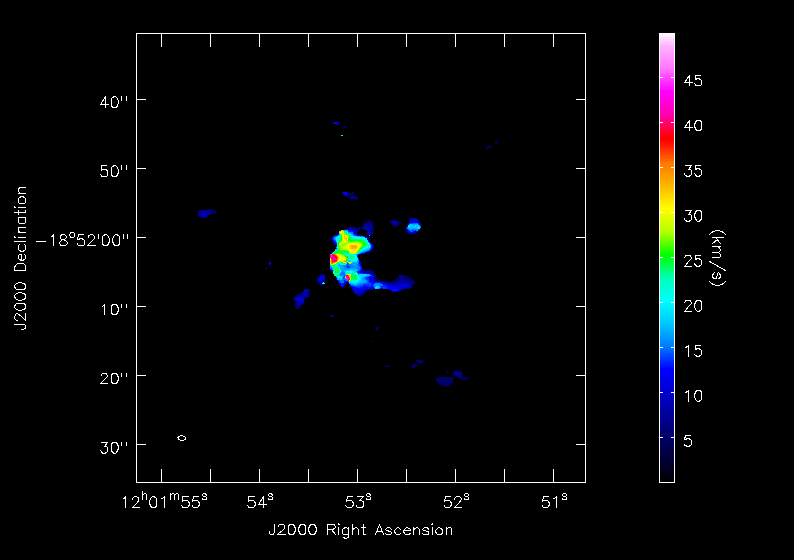
| 19:12, 29 May 2012 | Antennae North.CO3 2Line.Clean.selfcal1.pbcorimage.mom2.png (file) |  |
15 KB | moment 2 image north mosaic | 1 |
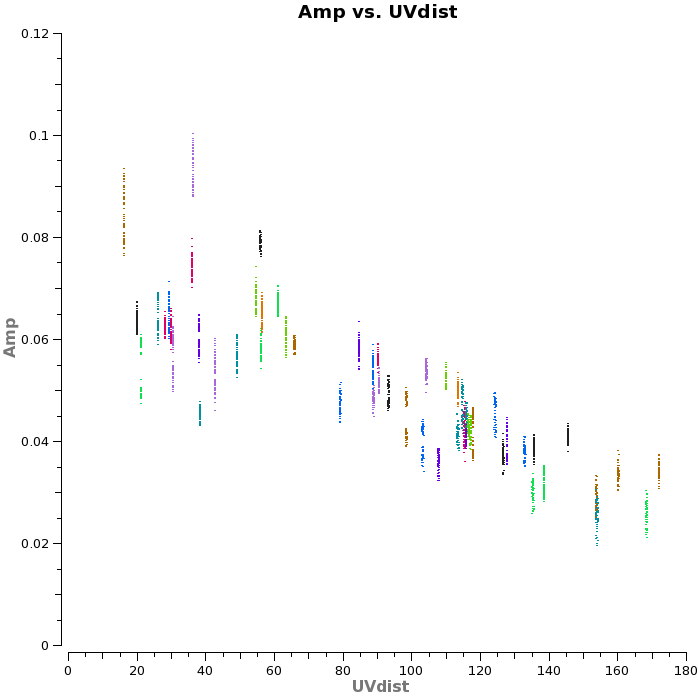
| 19:26, 25 May 2012 | Plotms.uid A002 X1ff7b0 Xb.Titan.ampvsuvdist.png (file) |  |
17 KB | Amplitude versus uvdist (m) Titan all baselines avg all chan | 1 |
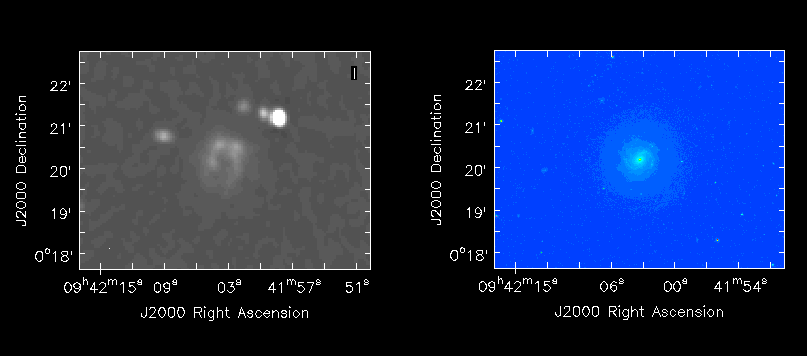
| 20:07, 25 August 2011 | PlotSN2010FZ viewerfinalandSDSS.png (file) |  |
19 KB | SN2010FZ final mfs and NGC2967 SDSS i-band image | 1 |
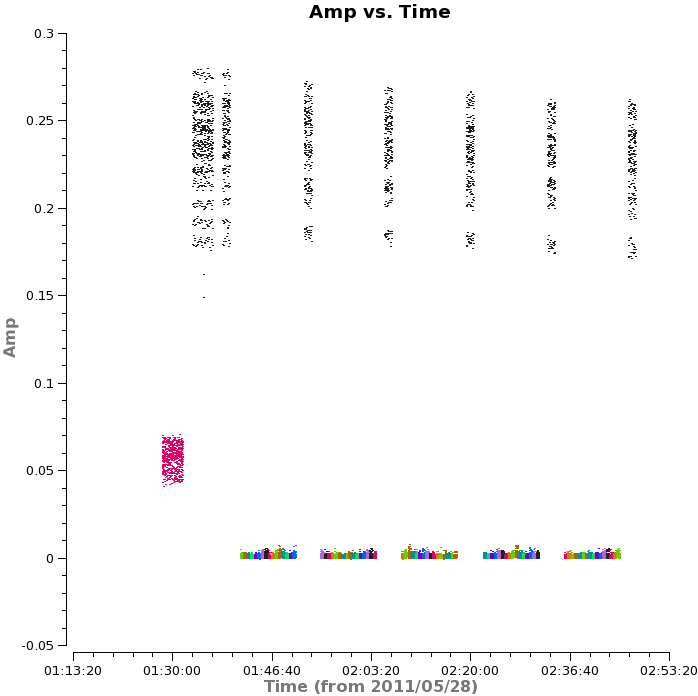
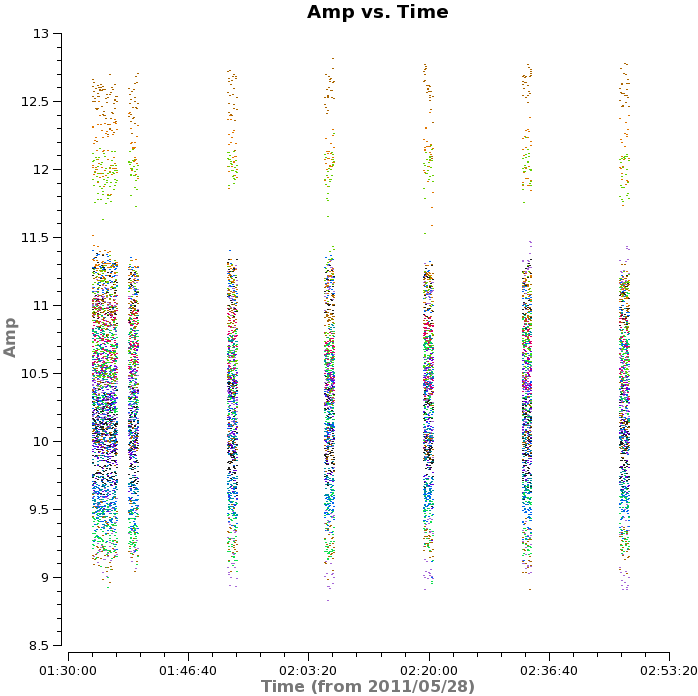
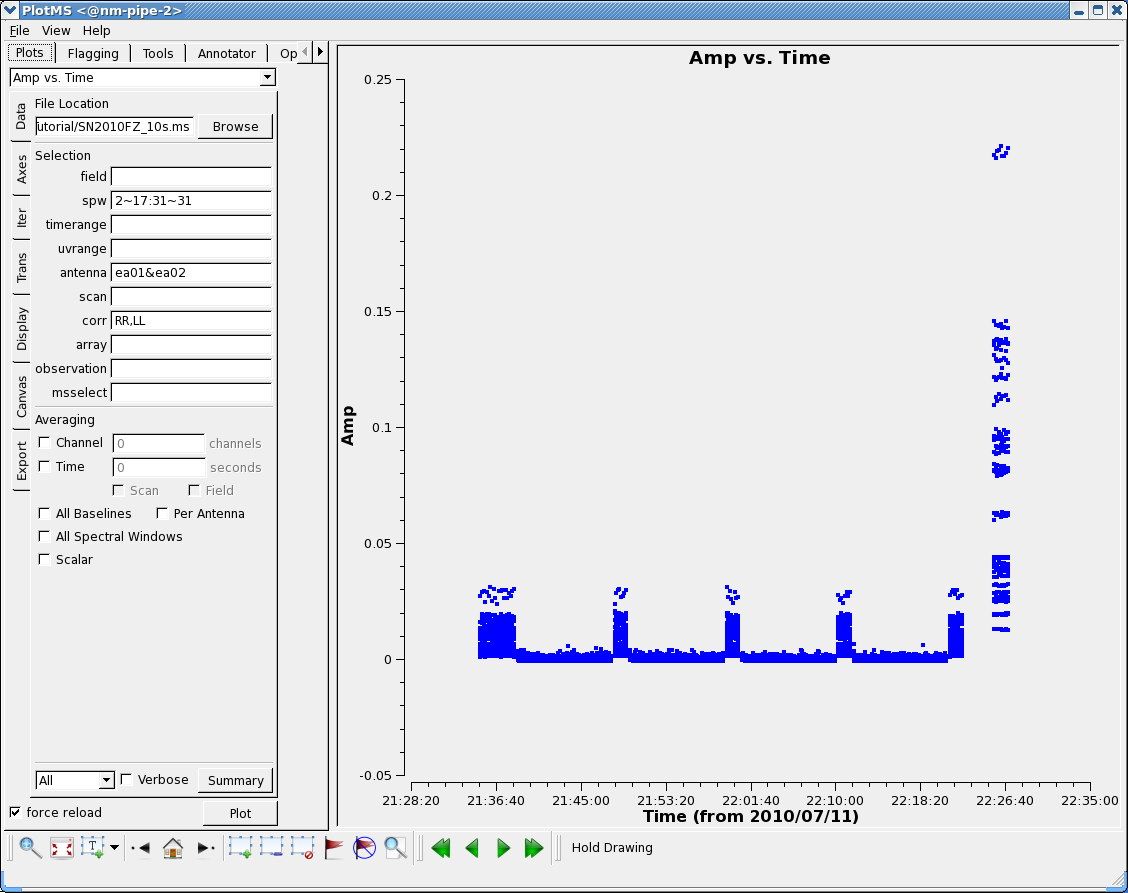
| 19:29, 25 May 2012 | Plotms.uid A002 X1ff7b0 Xb.All.ampvstime.png (file) |  |
19 KB | Amplitude versus time all fields baselines to DV11 avg all chan | 2 |
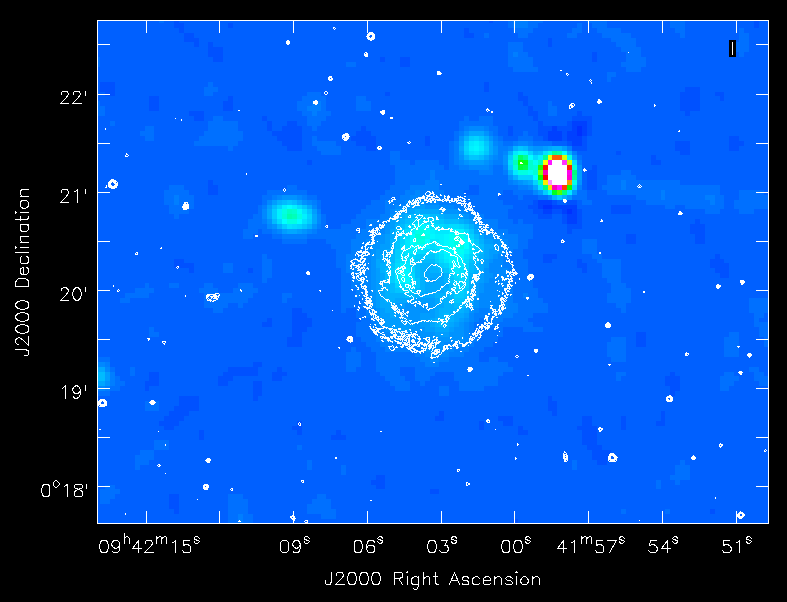
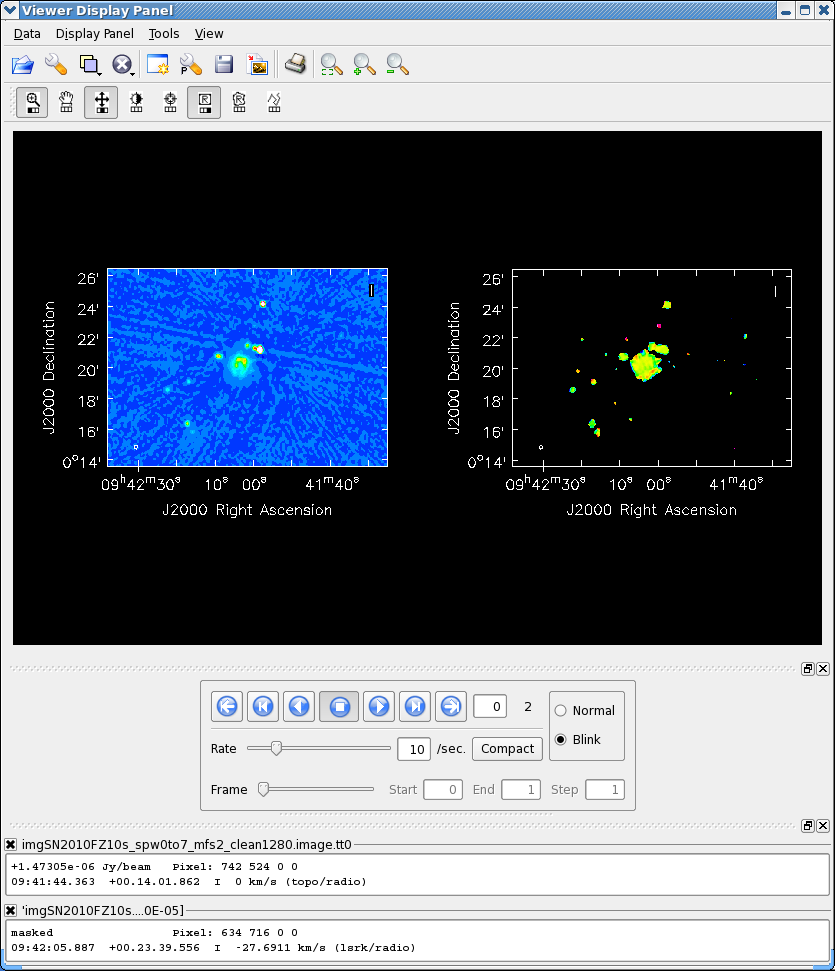
| 17:26, 31 August 2011 | ViewSN2010FZ spw0to11 mfs2tt0plusSDSS.png (file) |  |
21 KB | 6cm Raster plus SDSS i-band contours | 1 |
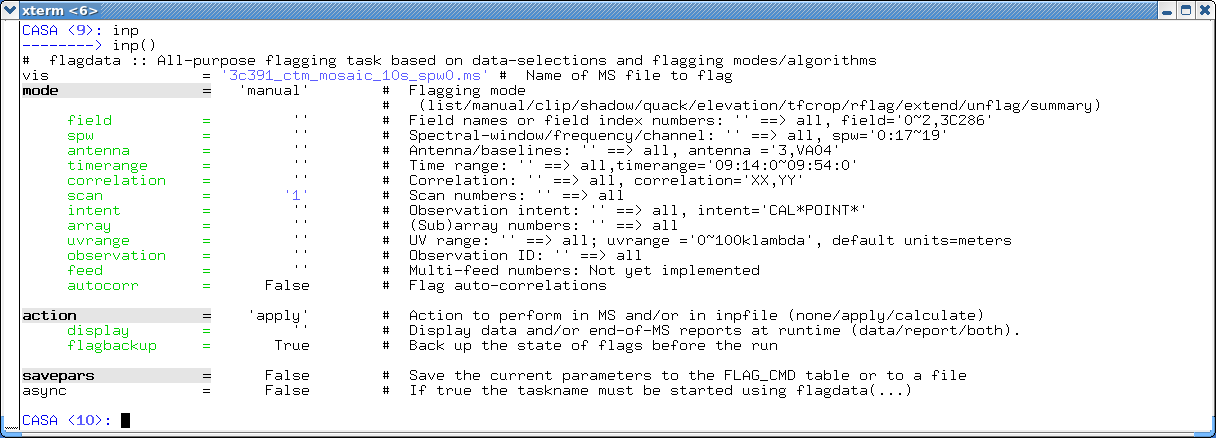
| 16:34, 24 October 2012 | Screenshot 3C391 flagdata.png (file) |  |
24 KB | 1 | |
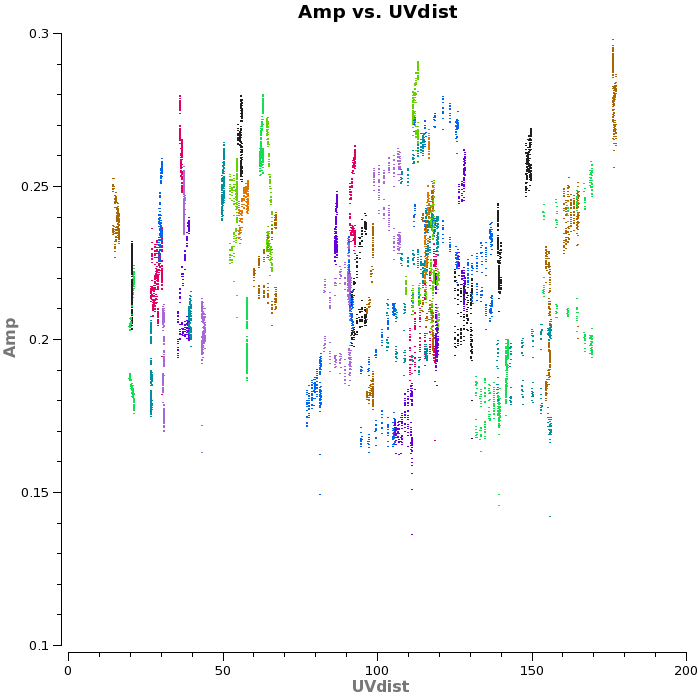
| 19:30, 25 May 2012 | Plotms.uid A002 X1ff7b0 Xb.3C279.ampvsuvdist.png (file) |  |
28 KB | Amplitude versus uvdist (m) 3c279 all baselines avg all chan | 2 |
| 12:59, 25 May 2012 | Uid A002 X1ff7b0 Xb.tsys vs time.page2.png (file) |  |
28 KB | tsys vs time NM dataset 1 page 2 | 1 |
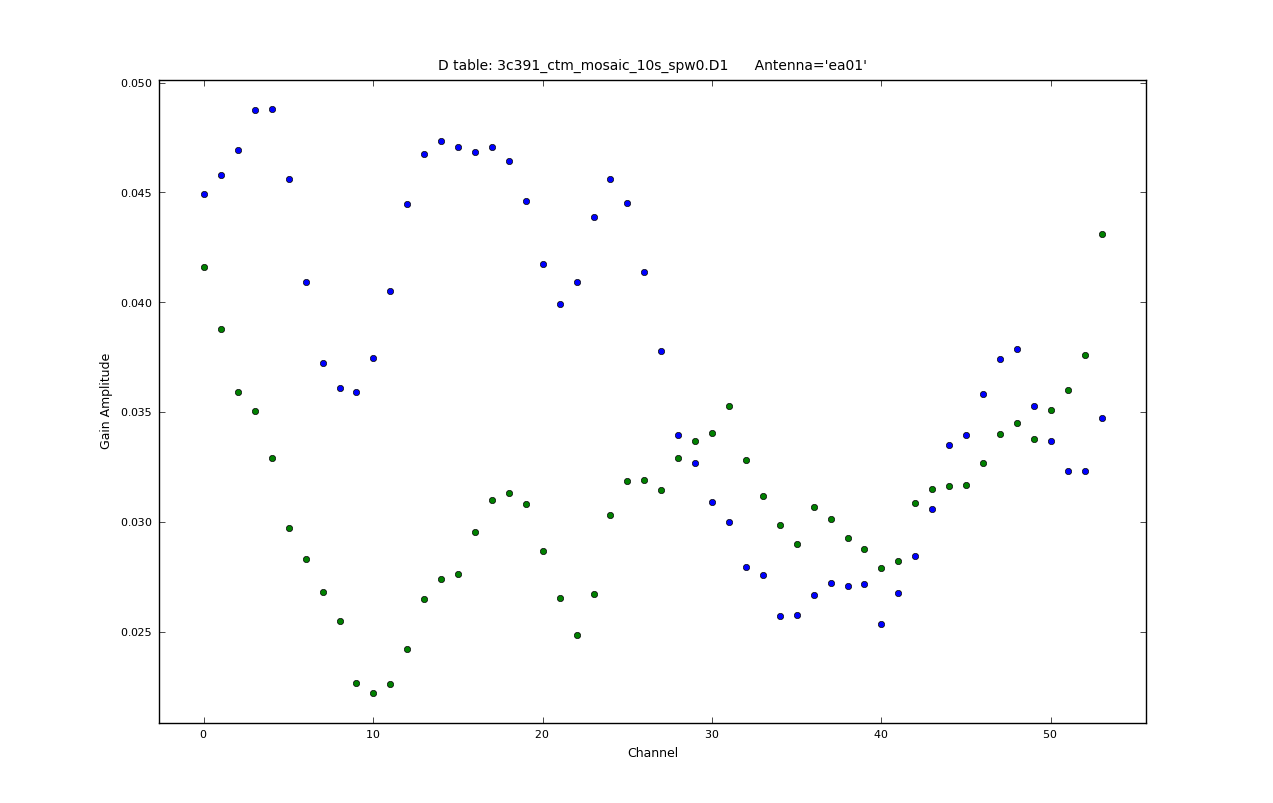
| 18:38, 16 May 2012 | Plotcal 3c391-D1-ea01.png (file) |  |
31 KB | Df vs channel for ea01 | 1 |
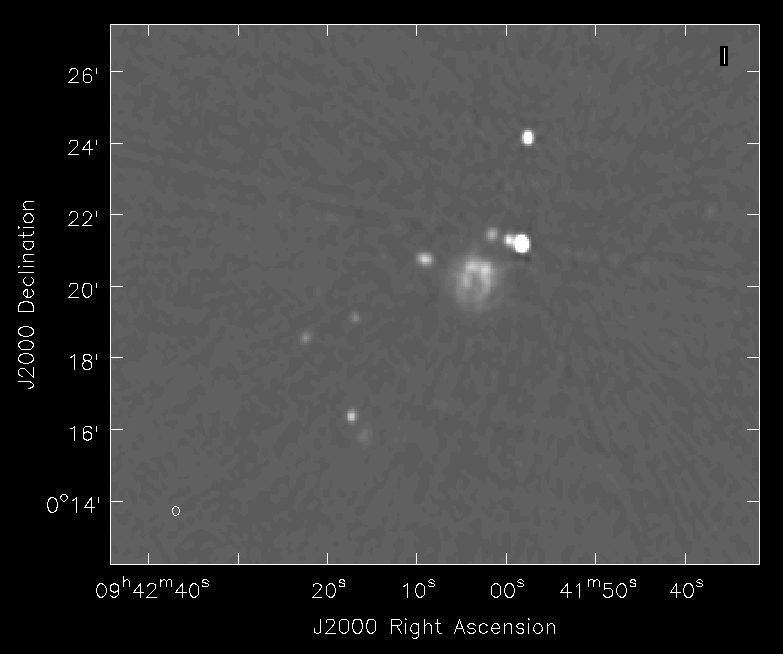
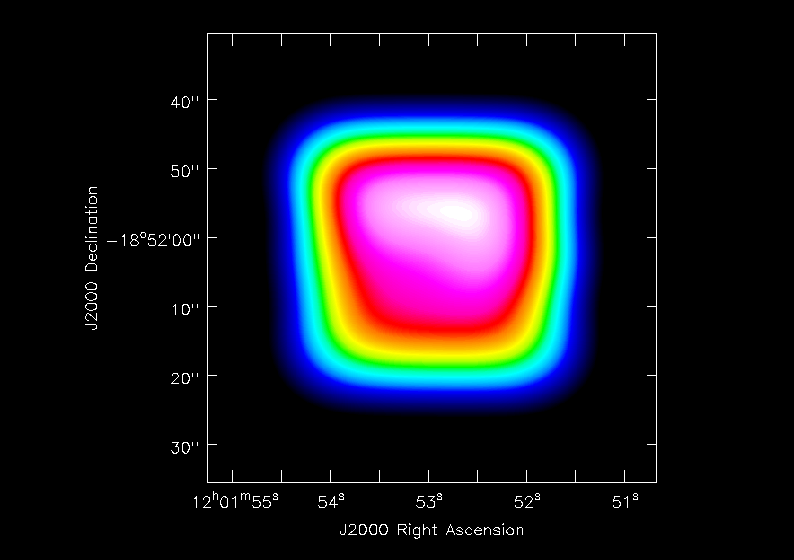
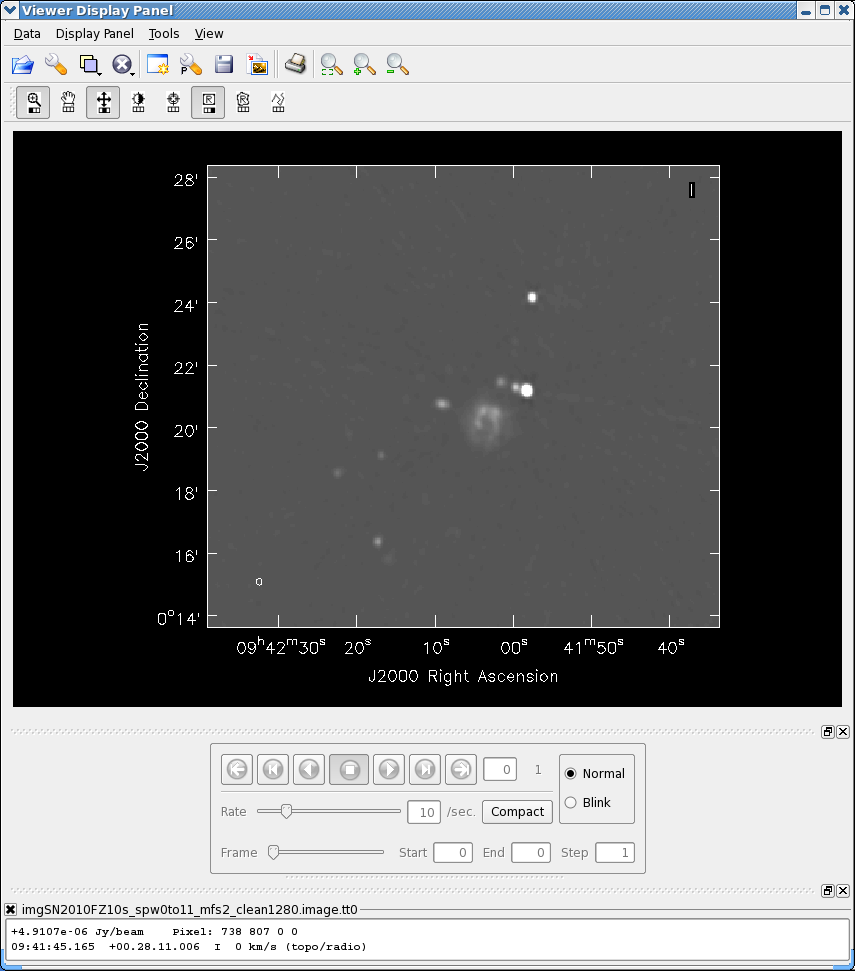
| 20:03, 28 August 2011 | ViewSN2010FZ spw0to7 clean1280final.png (file) |  |
32 KB | clean spw0-7 center of final restored image | 1 |
| 20:04, 28 May 2012 | Plotms.uid A002 X1ff7b0 Xb.wvrtsys.3c279.timeamp.png (file) |  |
35 KB | calibrated 3c279 amp vs. time color by baseline | 1 |
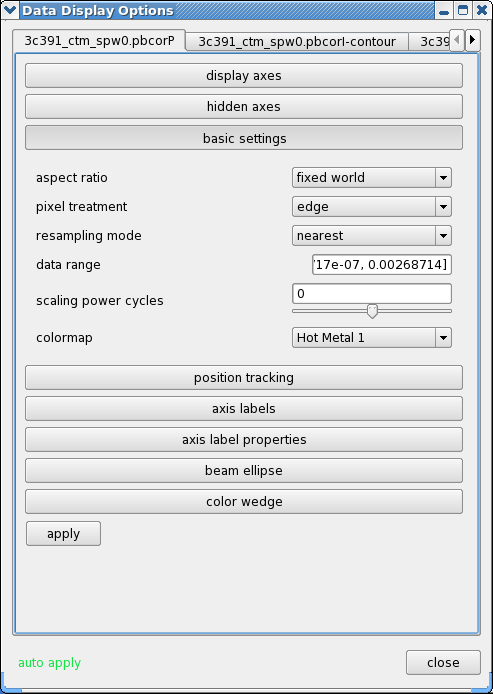
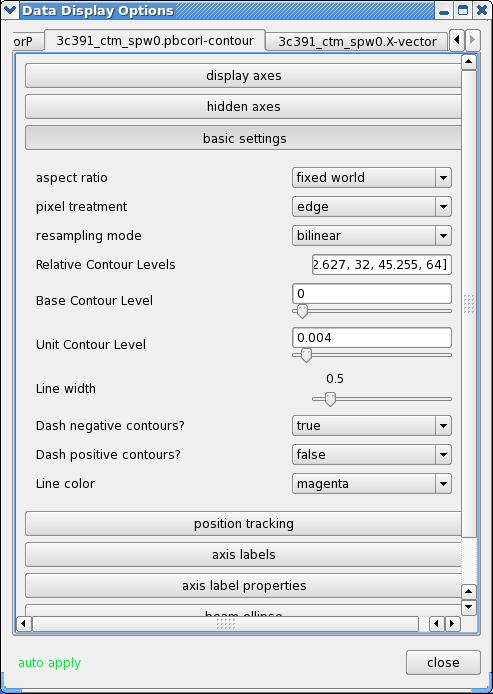
| 18:55, 24 May 2012 | Screenshot 3c391 viewer menu raster.png (file) |  |
37 KB | viewer raster data display options | 1 |
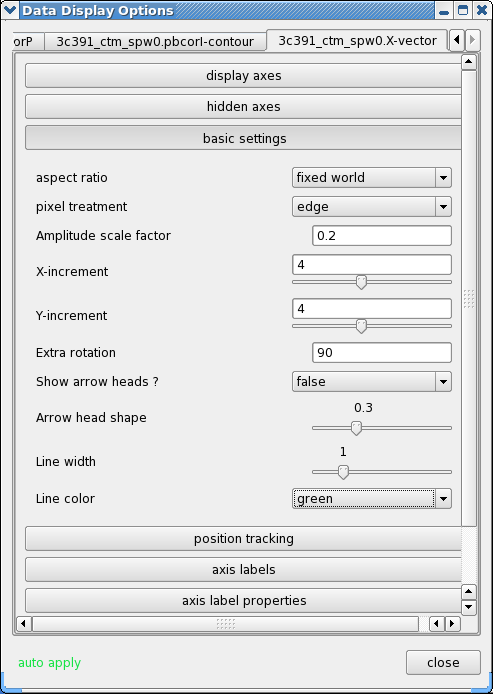
| 18:56, 24 May 2012 | Screenshot 3c391 viewer menu vector.png (file) |  |
40 KB | viewer vector data display options | 1 |
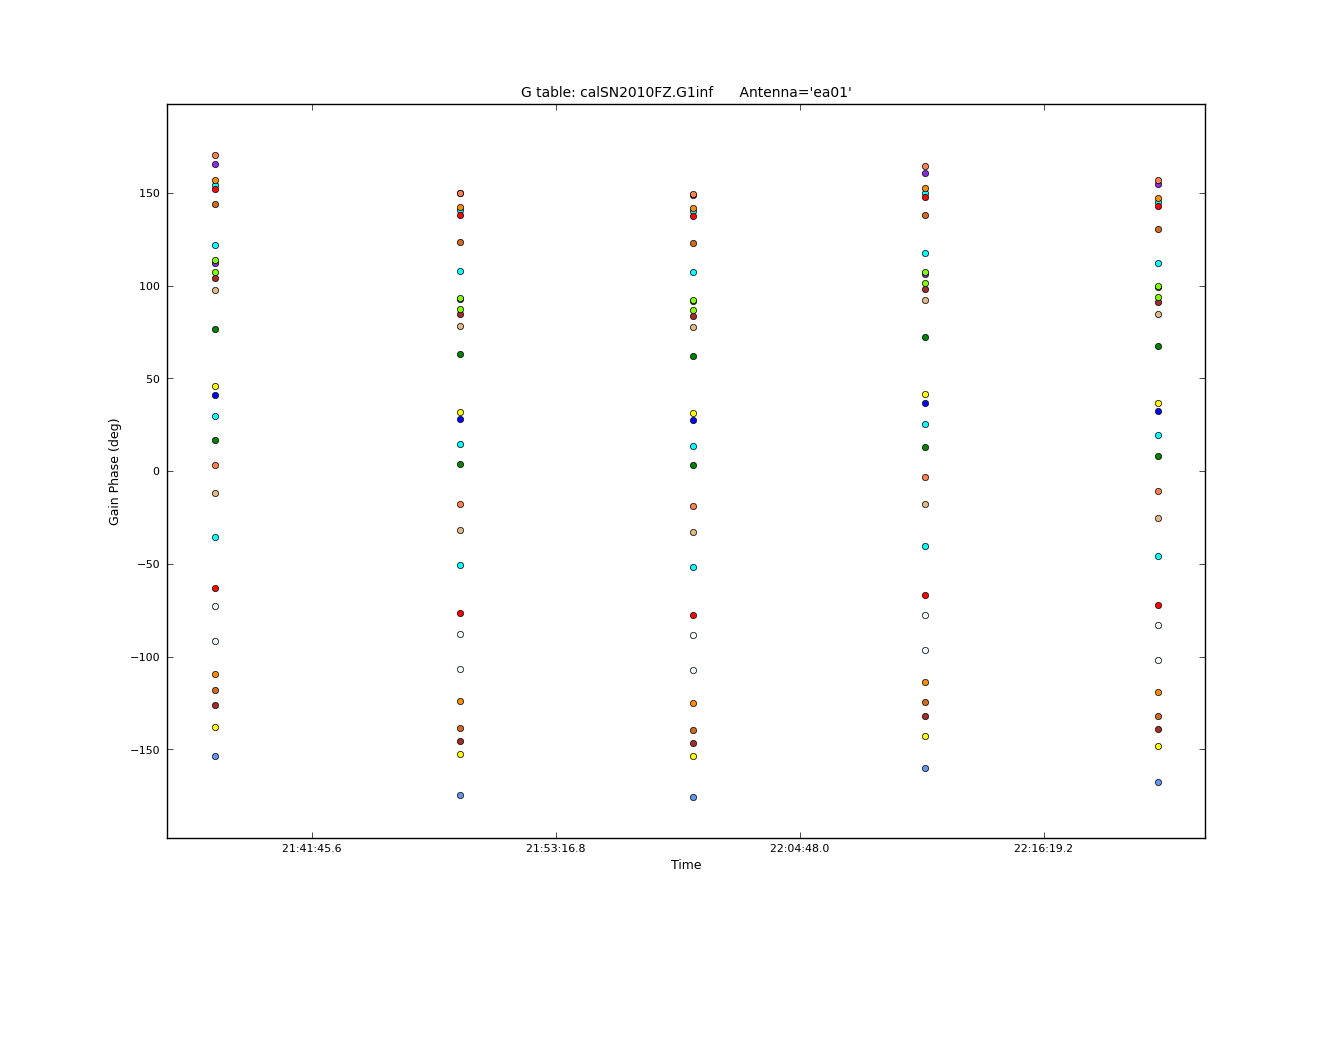
| 14:27, 7 November 2012 | PlotSN2010FZ plotcal G1infp ea01 4.0.png (file) |  |
41 KB | 1 | |
| 18:36, 29 May 2012 | Viewer.Antennae North.CO3 2Line.Clean.selfcal1.flux.ch42.png (file) |  |
43 KB | .flux image | 1 |
| 18:56, 24 May 2012 | Screenshot 3c391 viewer menu contour.png (file) |  |
43 KB | viewer contour data display options | 1 |
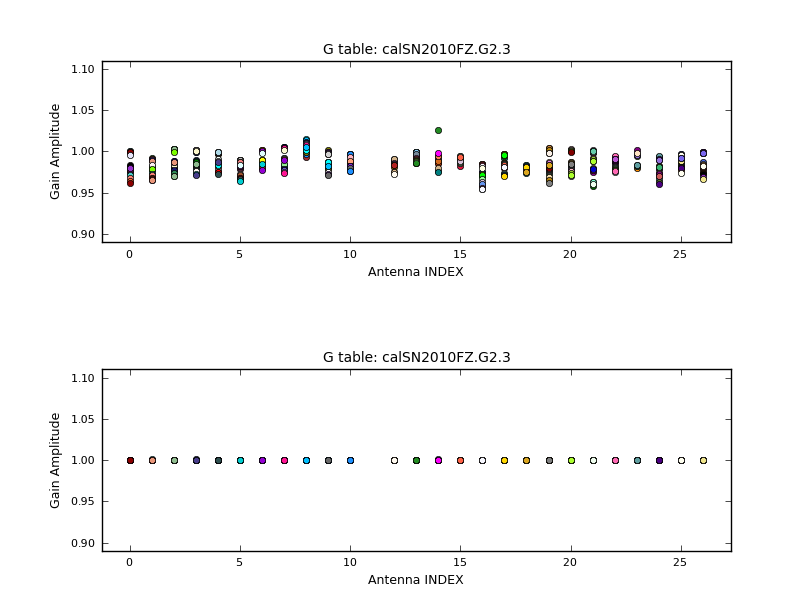
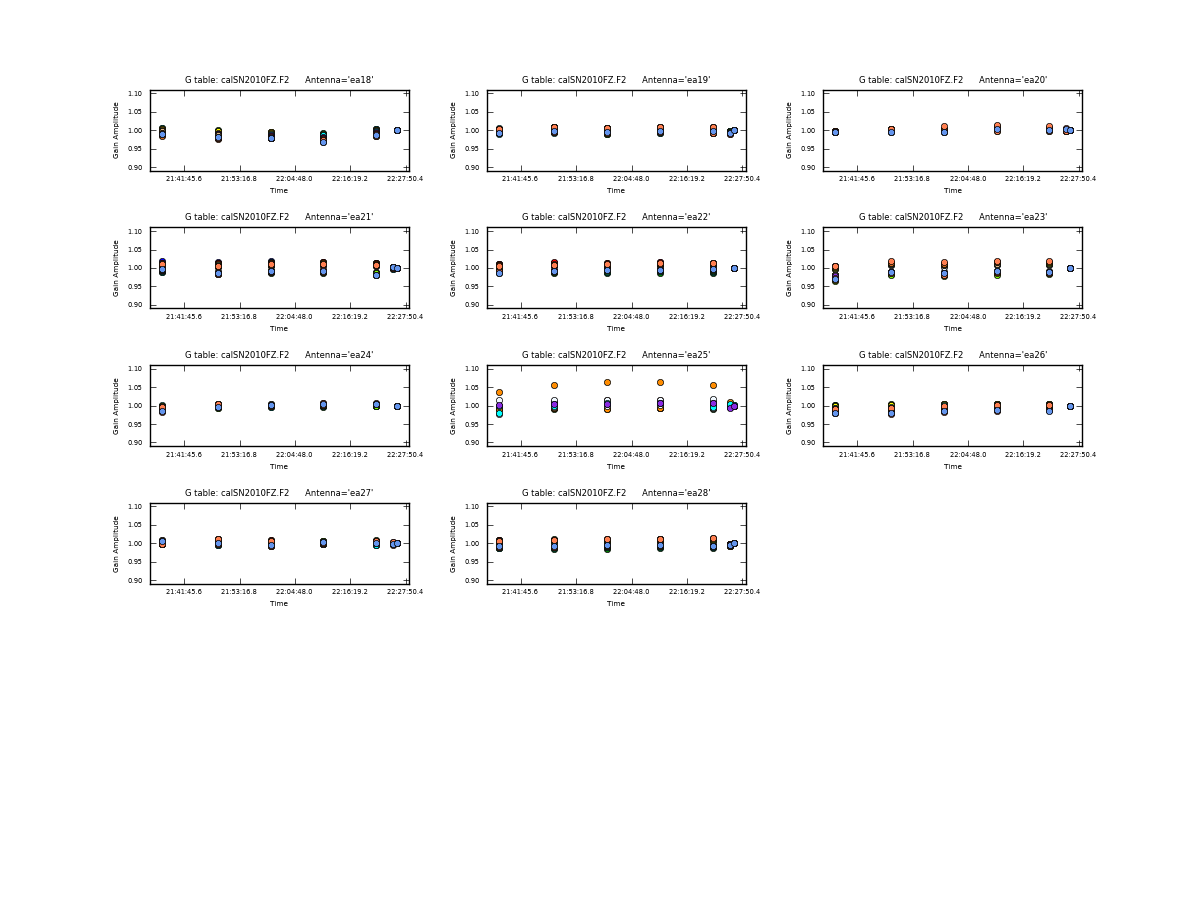
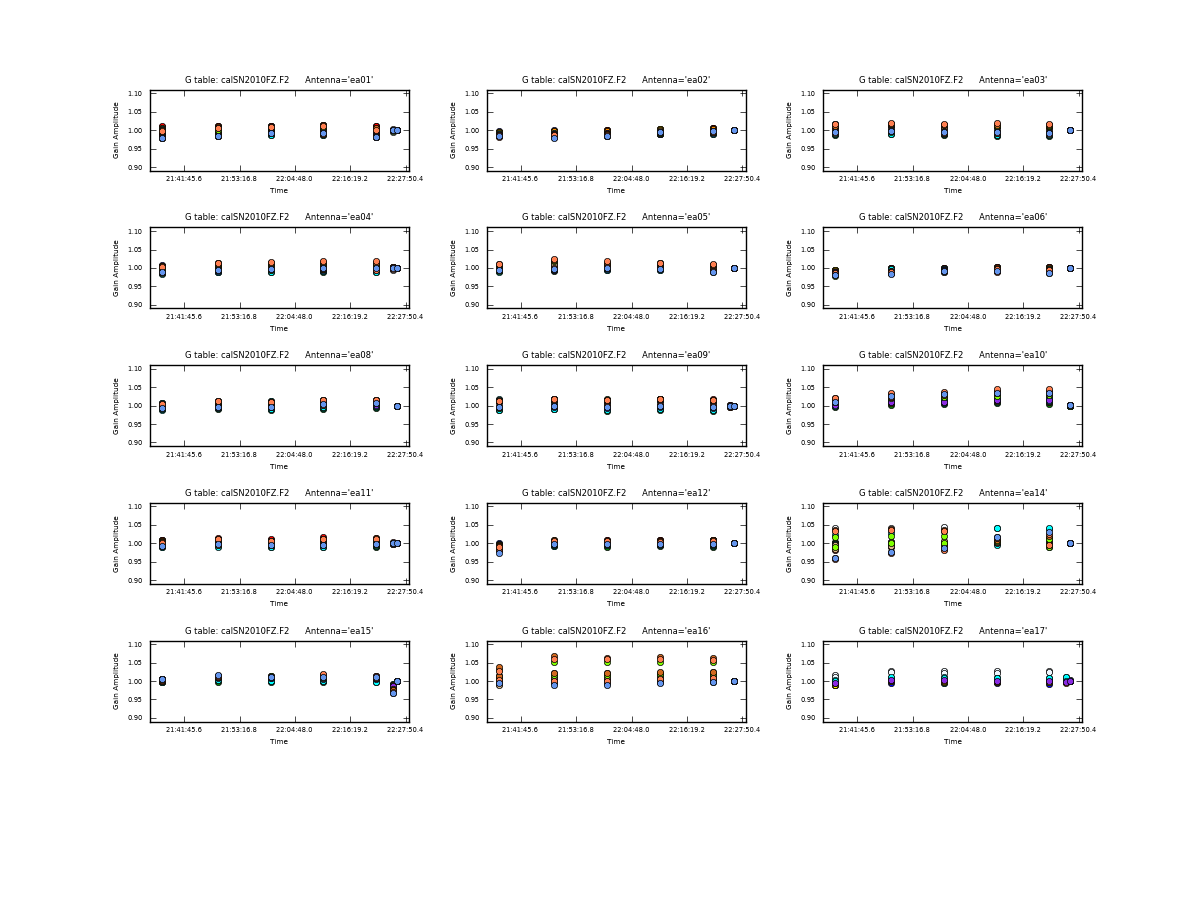
| 12:45, 2 November 2012 | PlotSN2010FZ plotcal G2.3 ampant.png (file) |  |
44 KB | 1 | |
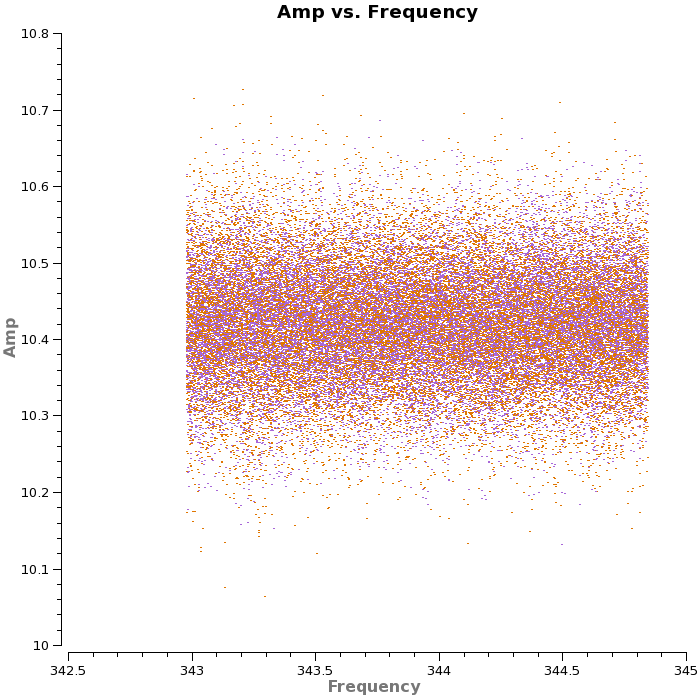
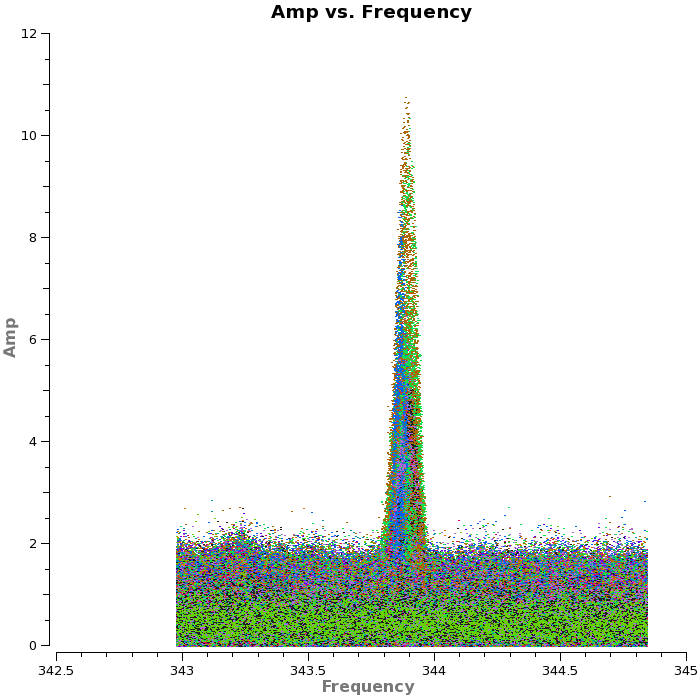
| 18:52, 25 May 2012 | Plotms.uid A002 X1ff7b0 Xb.Titan.ampvsfreq.png (file) |  |
46 KB | Amplitude versus frequency Titan baselines to DV11 | 1 |
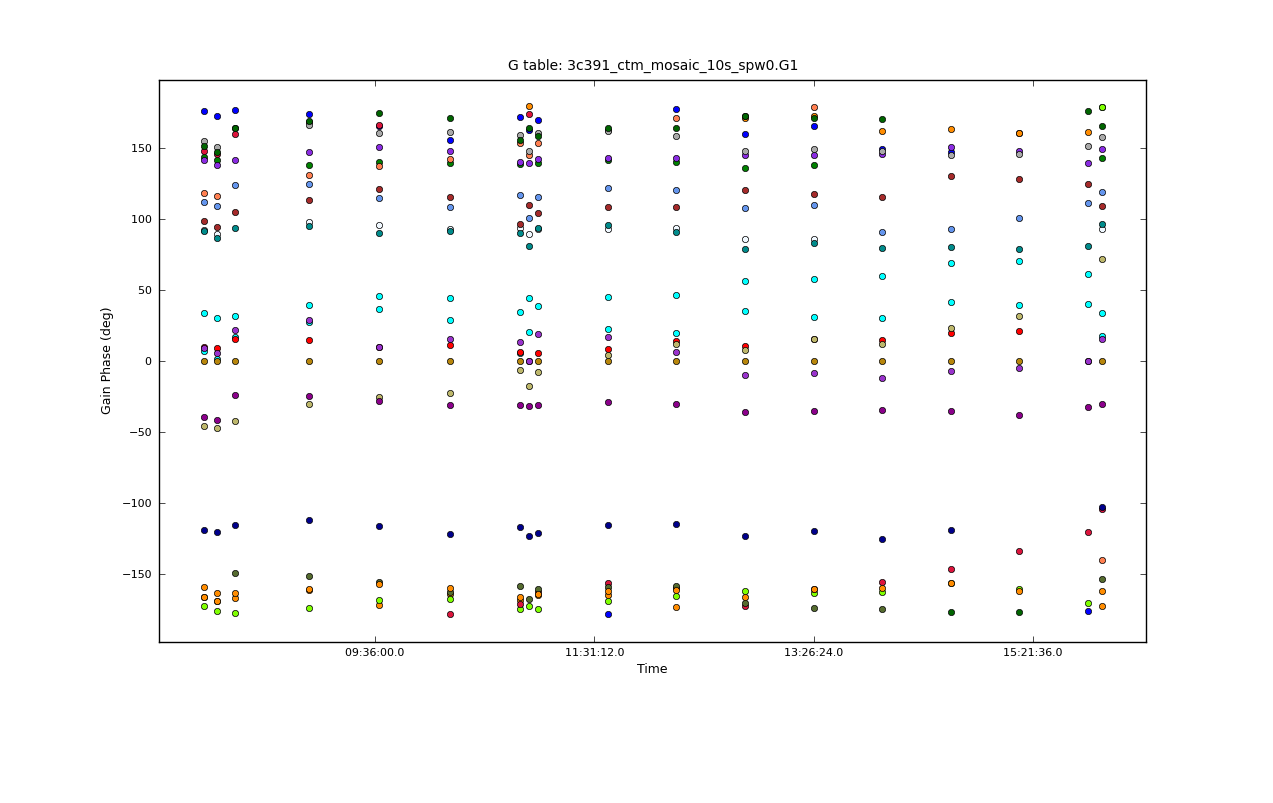
| 15:18, 16 May 2012 | Plotcal-G1-phase-R.png (file) |  |
47 KB | G1 phase solutions, R pol | 1 |
| 20:06, 28 May 2012 | Plotms.uid A002 X1ff7b0 Xb.wvrtsys.3c279.baseavg.ampfreq.png (file) |  |
50 KB | calibrated 3c279 amp vs freq all baselines | 1 |
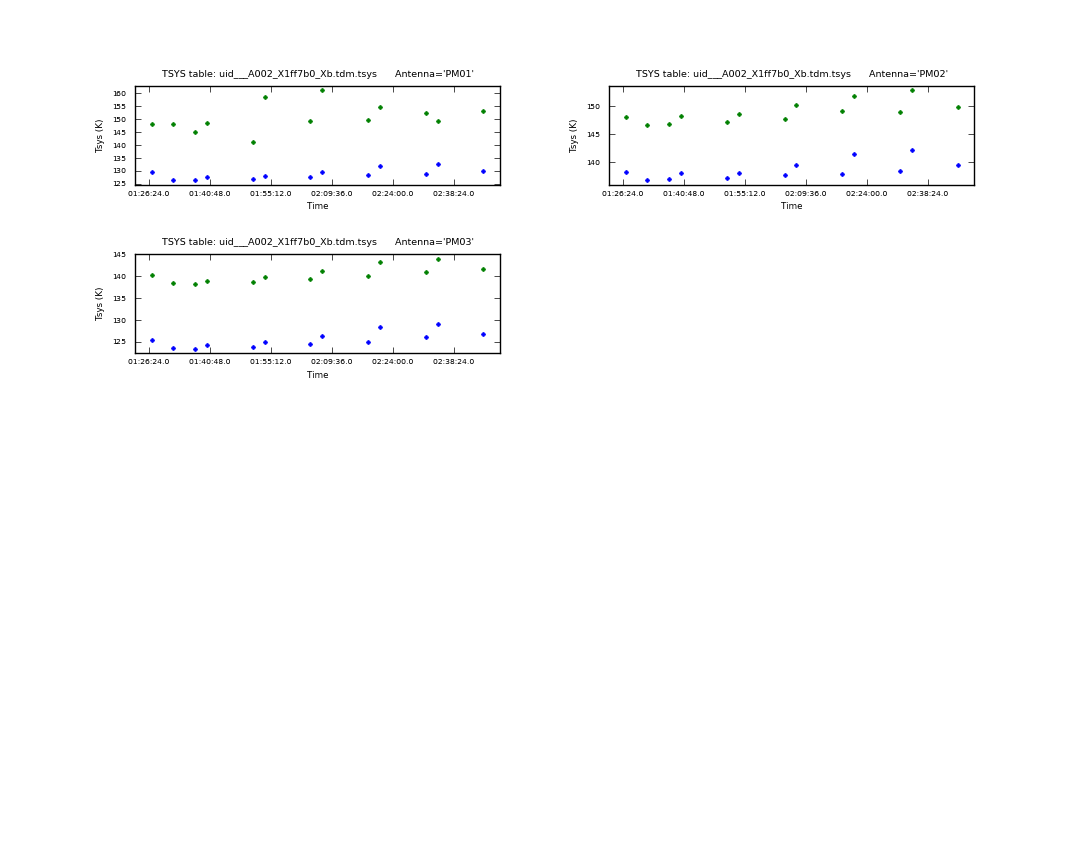
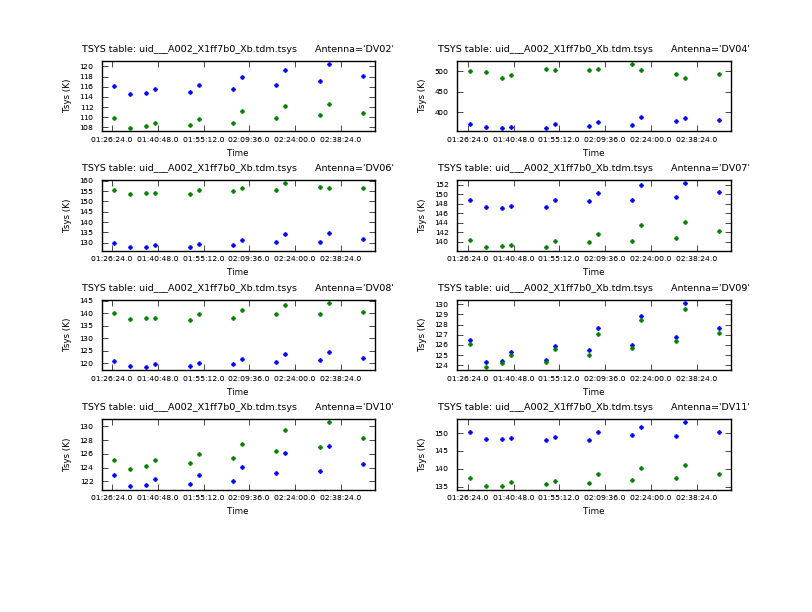
| 12:59, 25 May 2012 | Uid A002 X1ff7b0 Xb.tsys vs time.page1.png (file) |  |
51 KB | tsys vs time NM dataset 1 page 1 | 1 |
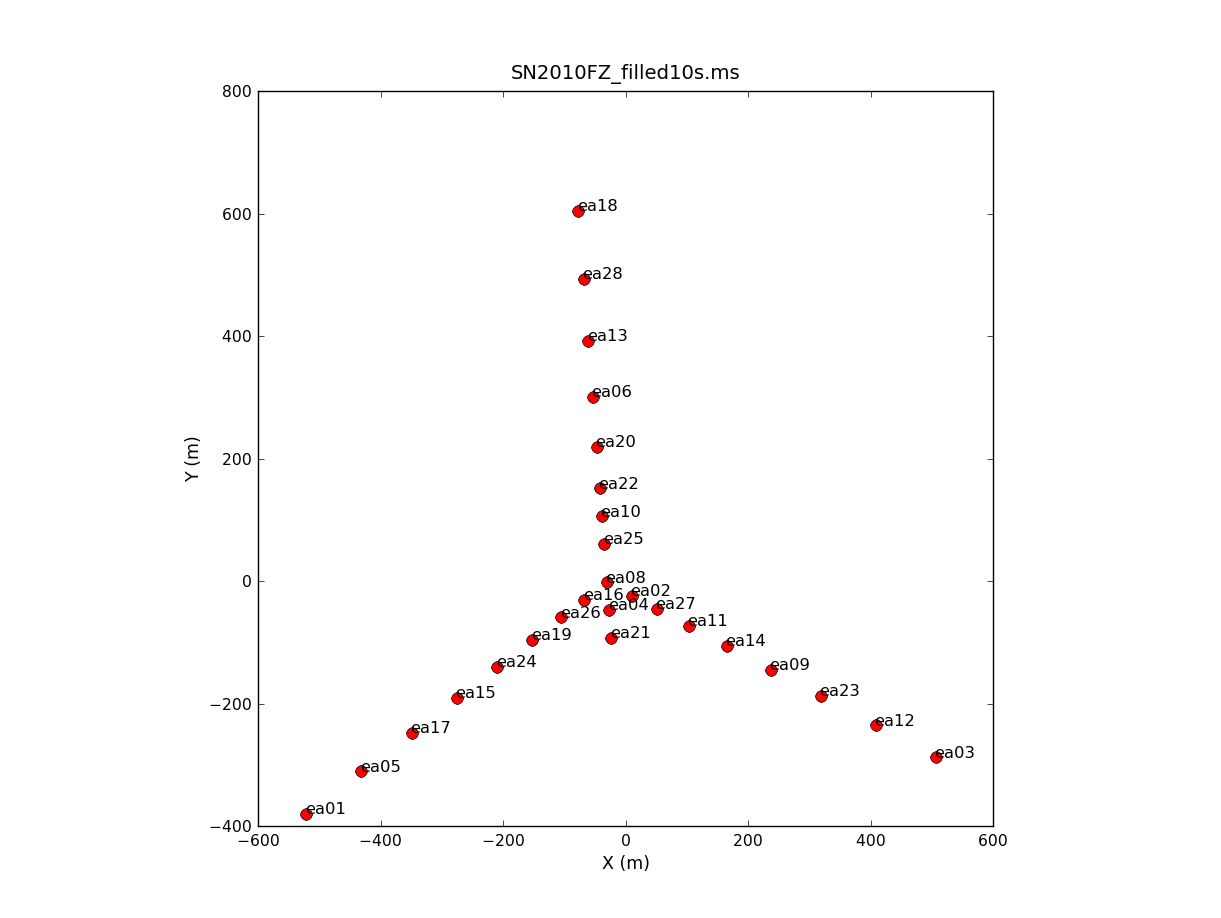
| 17:12, 25 August 2011 | PlotSN2010FZ plotants.png (file) |  |
52 KB | SN2010FZ tutorial plotants plot | 1 |
| 19:11, 29 May 2012 | Antennae North.CO3 2Line.Clean.selfcal1.pbcorimage.mom0.png (file) |  |
52 KB | moment 0 image north mosaic | 1 |
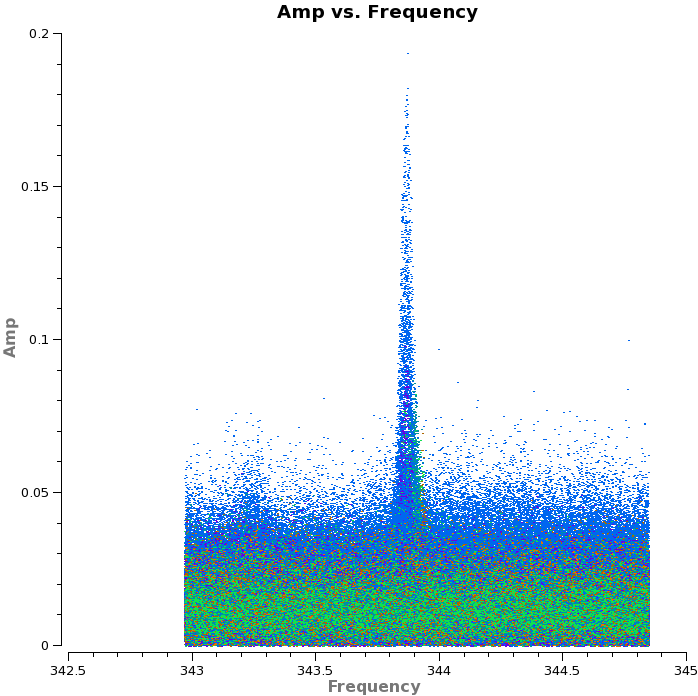
| 19:27, 25 May 2012 | Plotms.uid A002 X1ff7b0 Xb.Antennae.ampvsfreq.png (file) |  |
53 KB | Amplitude versus frequency Antennae baselines to DV11 | 1 |
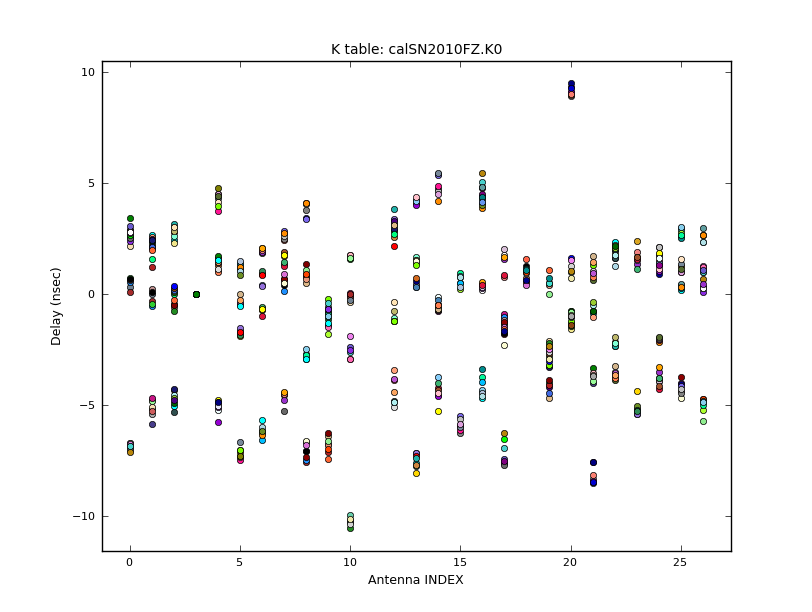
| 14:17, 25 November 2013 | PlotSN2010FZ plotcal delays 4.2.png (file) |  |
54 KB | antenna delay v4.2 | 1 |
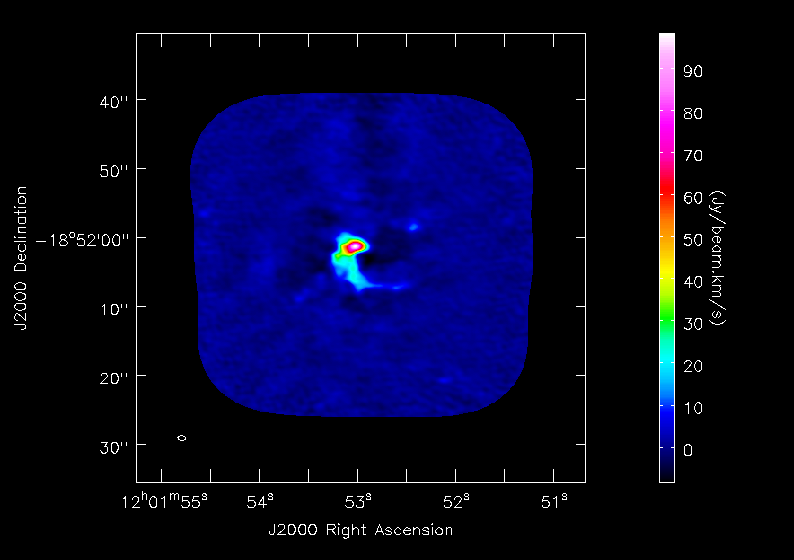
| 20:00, 25 August 2011 | PlotSN2010FZ viewerfinal.png (file) |  |
56 KB | SN2010FZ Final mfs nterms=2 image spw 0~11 | 1 |
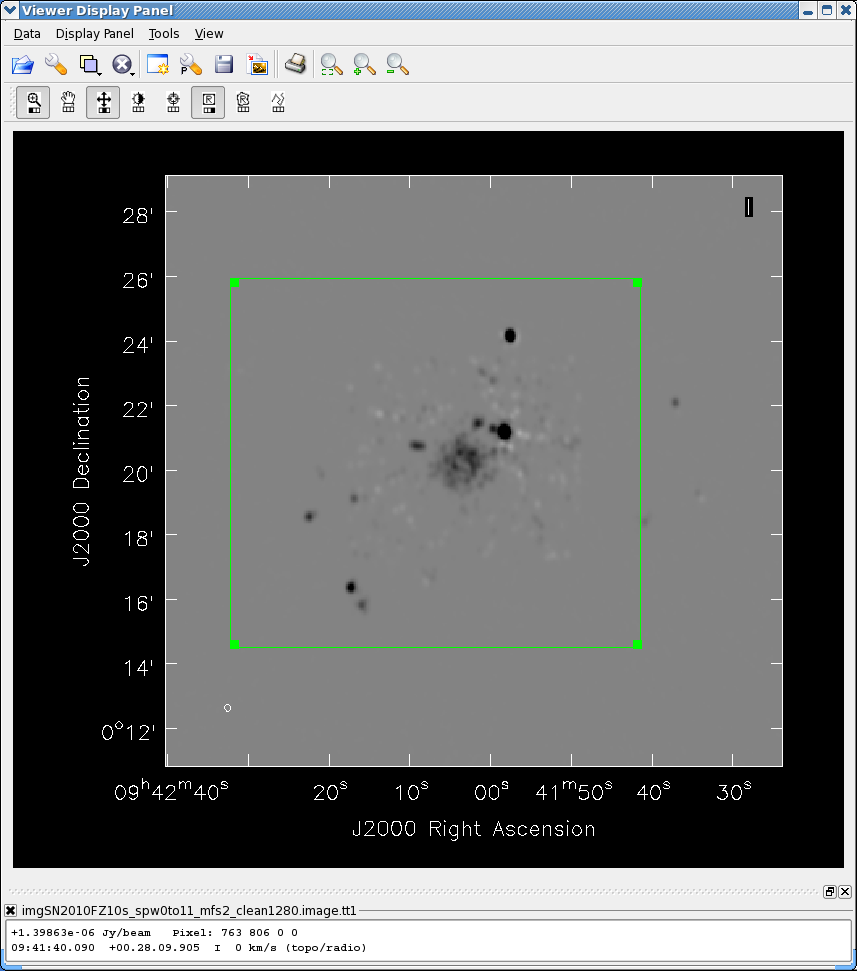
| 16:54, 31 August 2011 | ViewSN2010FZ spw0to11 mfs2tt1.png (file) |  |
57 KB | clean spw0-11 mfs nterms=2 tt1 image with box | 1 |
| 18:39, 30 October 2012 | PlotSN2010FZ plotcal F2a2 4.0.png (file) |  |
58 KB | 1 | |
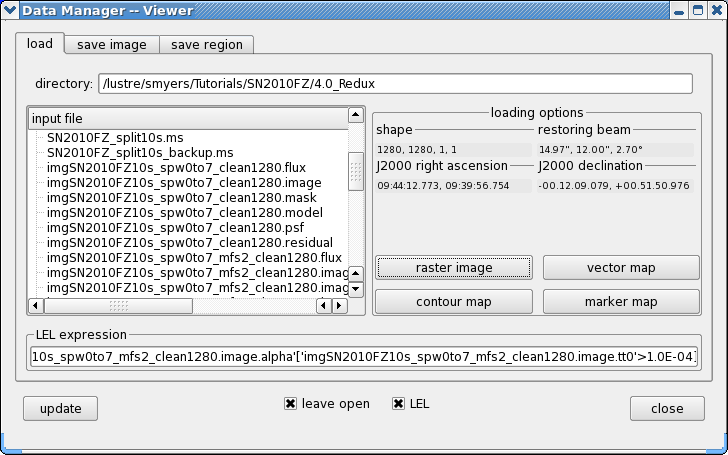
| 19:48, 8 November 2012 | ViewSN2010FZ spw0to7 mfs2loadalpha 4.0.png (file) |  |
59 KB | 1 | |
| 20:07, 28 May 2012 | Plotms.uid A002 X1ff7b0 Xb.wvrtsys.Antennae.ampfreq.png (file) |  |
59 KB | calibrated Antennae amp vs freq color by baseline | 1 |
| 12:14, 29 August 2011 | ViewSN2010FZ spw0to7 mfs2loadalpha.png (file) |  |
61 KB | clean spw0-7 mfs nterms=2 data load alpha using LEL | 1 |
| 19:49, 8 November 2012 | ViewSN2010FZ spw0to7 mfs2panelalpha 4.0.png (file) |  |
62 KB | 1 | |
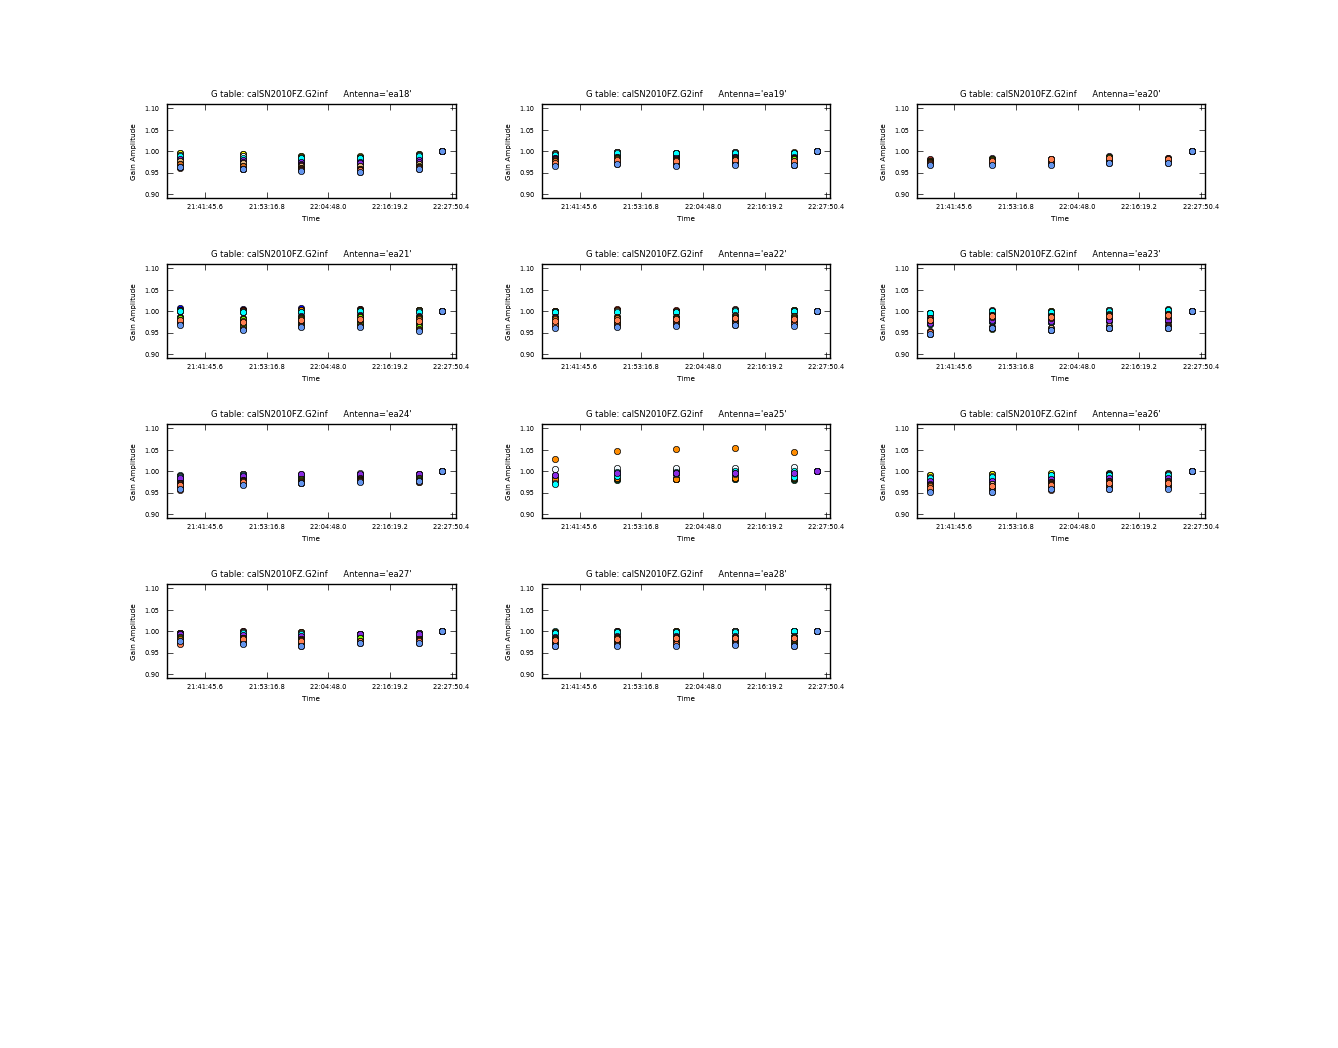
| 14:57, 7 November 2012 | PlotSN2010FZ plotcal G2infa2 4.0.png (file) |  |
64 KB | 1 | |
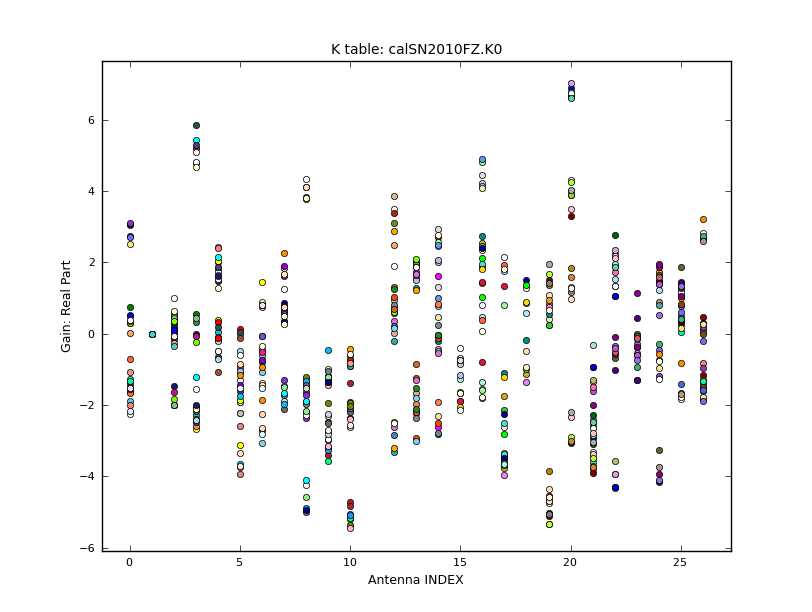
| 18:06, 16 February 2012 | PlotSN2010FZ plotcal delays.png (file) |  |
65 KB | K0 delays vs. antenna | 1 |
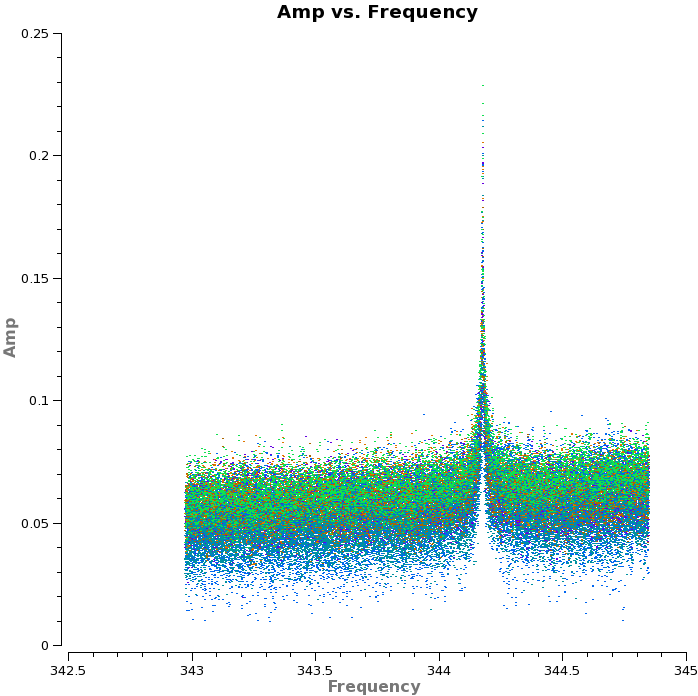
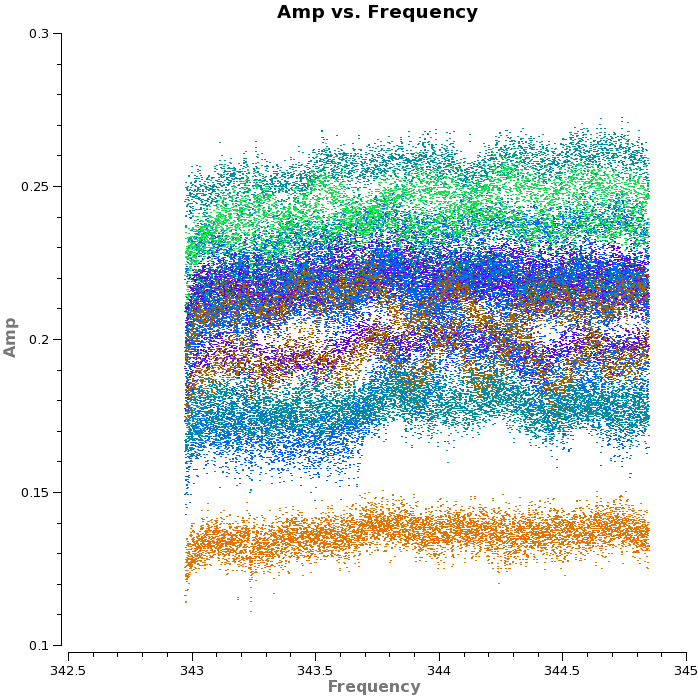
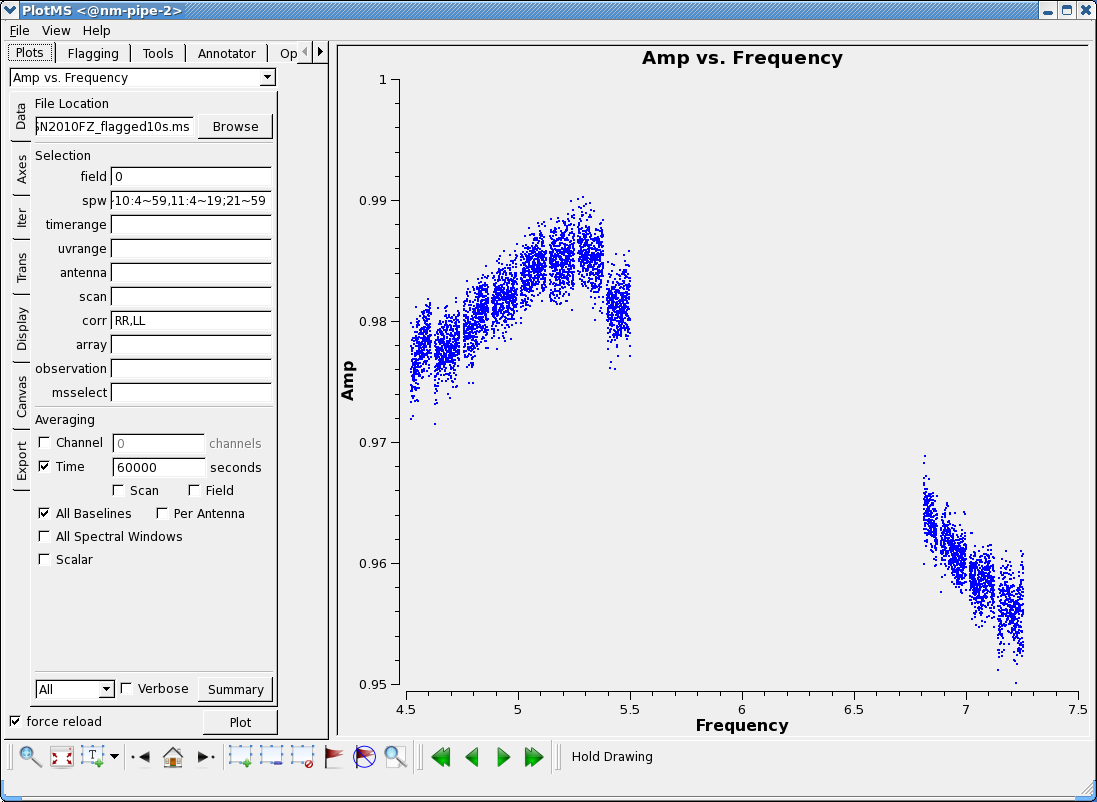
| 18:51, 25 May 2012 | Plotms.uid A002 X1ff7b0 Xb.3C279.ampvsfreq.png (file) |  |
67 KB | Amplitude versus frequency 3c279 baselines to DV11 | 1 |
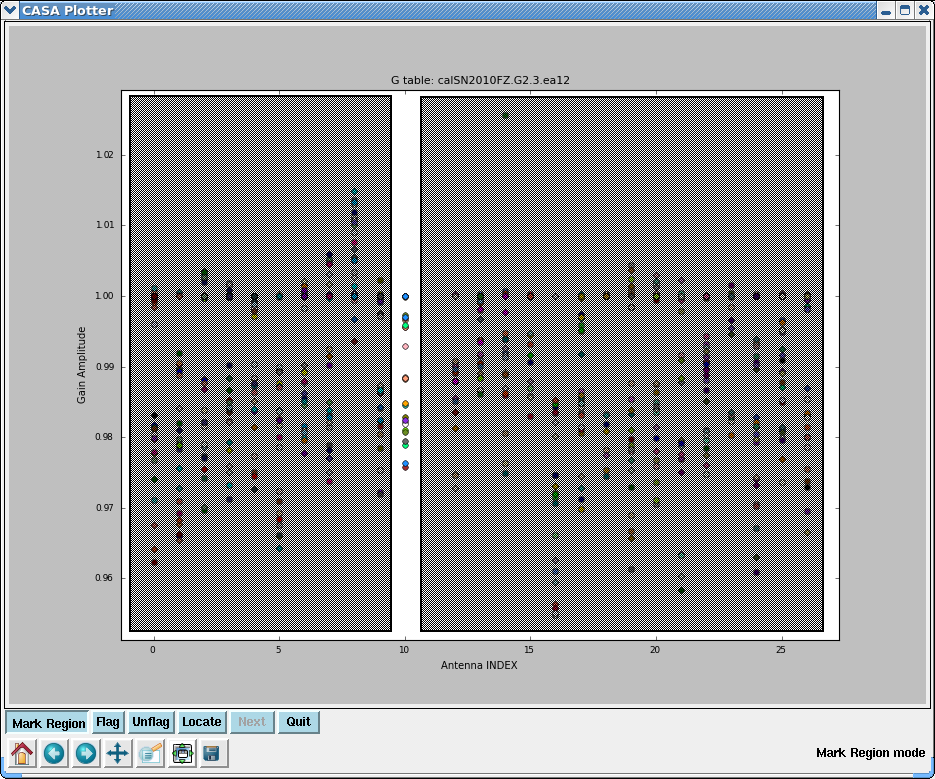
| 12:40, 2 November 2012 | ScreenshotPlotSN2010FZ plotcal fluxedit3 ea12.png (file) |  |
68 KB | 1 | |
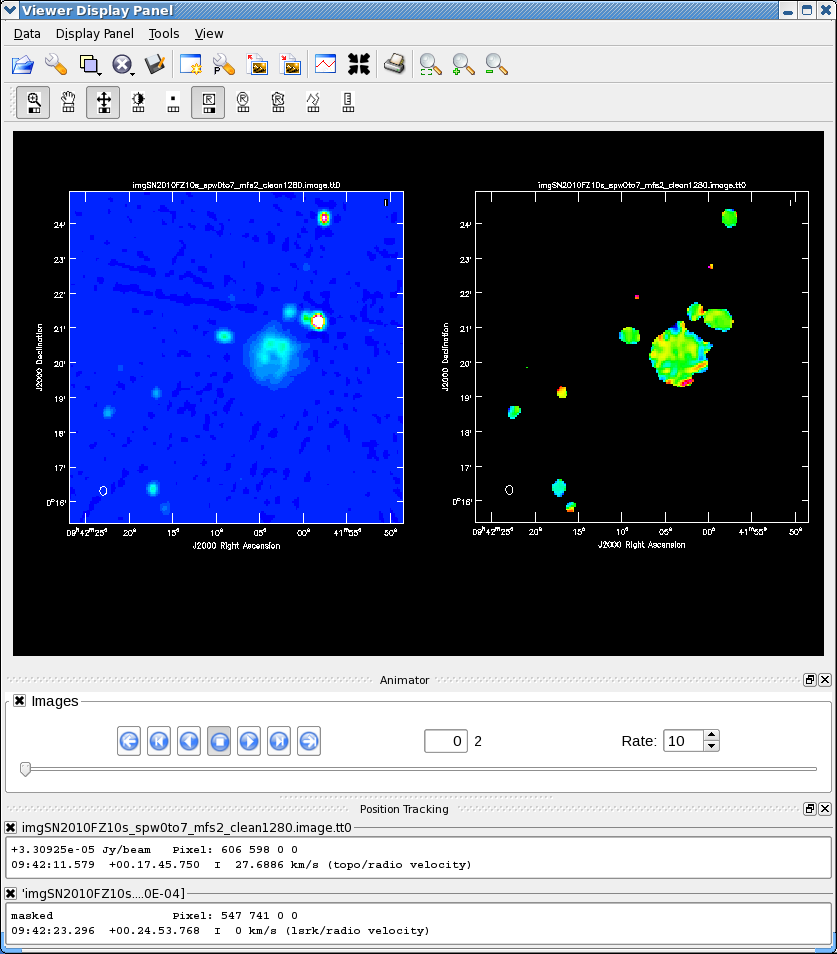
| 12:15, 29 August 2011 | ViewSN2010FZ spw0to7 mfs2panelalpha.png (file) |  |
69 KB | clean spw0-7 mfs nterms=2 side-by-side tt0 and alpha | 1 |
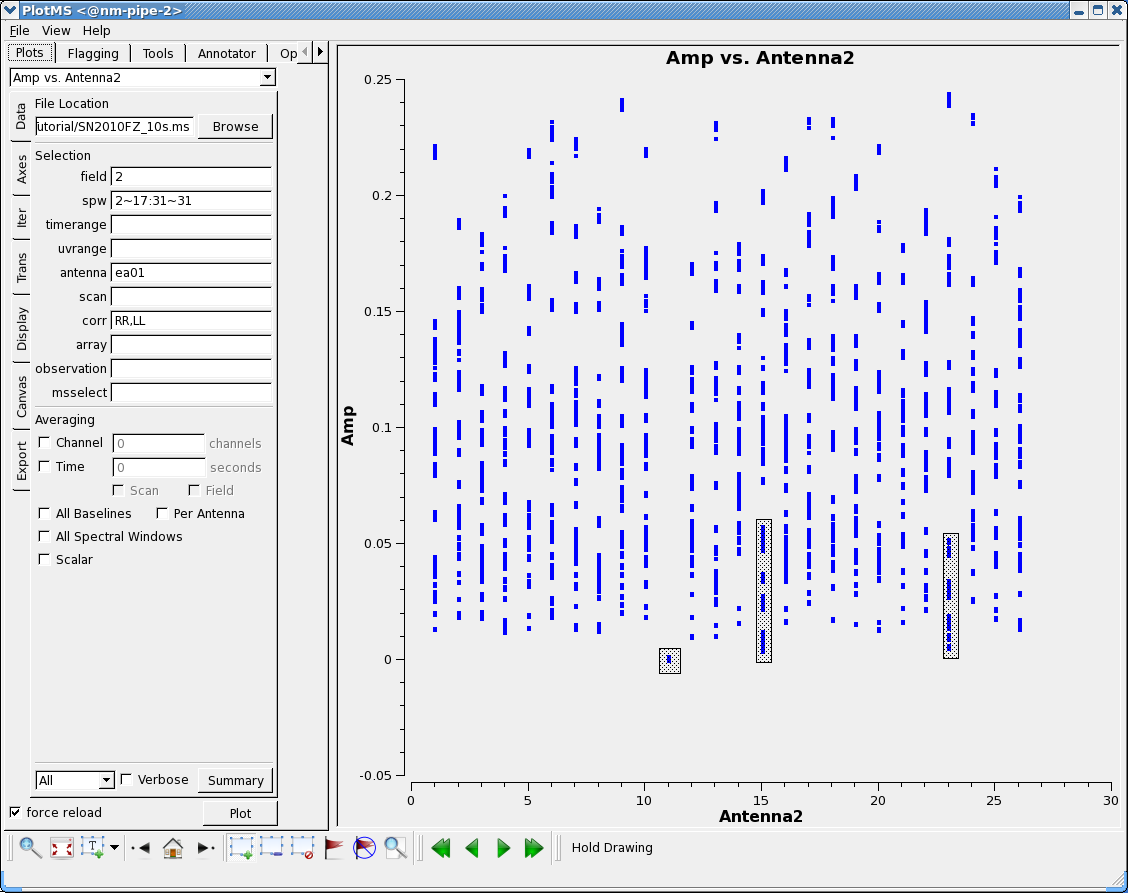
| 15:39, 30 October 2012 | ScreenshotPlotSN2010FZ plotms ants1 4.0.png (file) |  |
70 KB | 1 | |
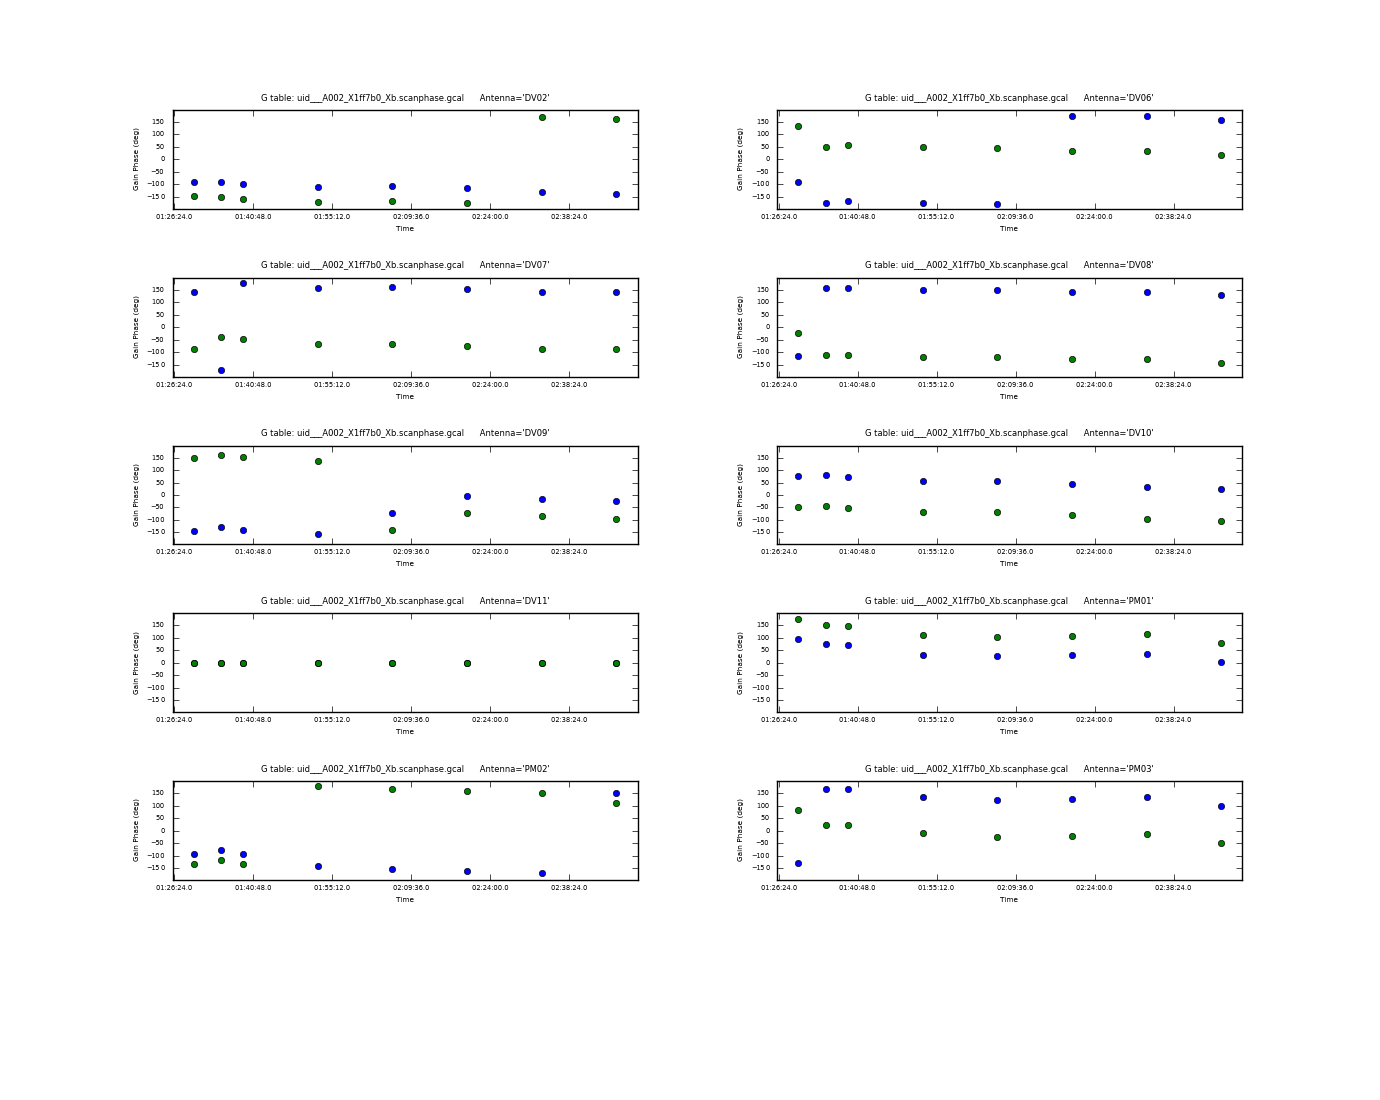
| 18:42, 28 May 2012 | Uid A002 X1ff7b0 Xb.scanphase.png (file) |  |
71 KB | gaincal scan phase | 1 |
| 15:50, 30 October 2012 | ScreenshotPlotSN2010FZ plotms ants2 4.0.png (file) |  |
72 KB | 1 | |
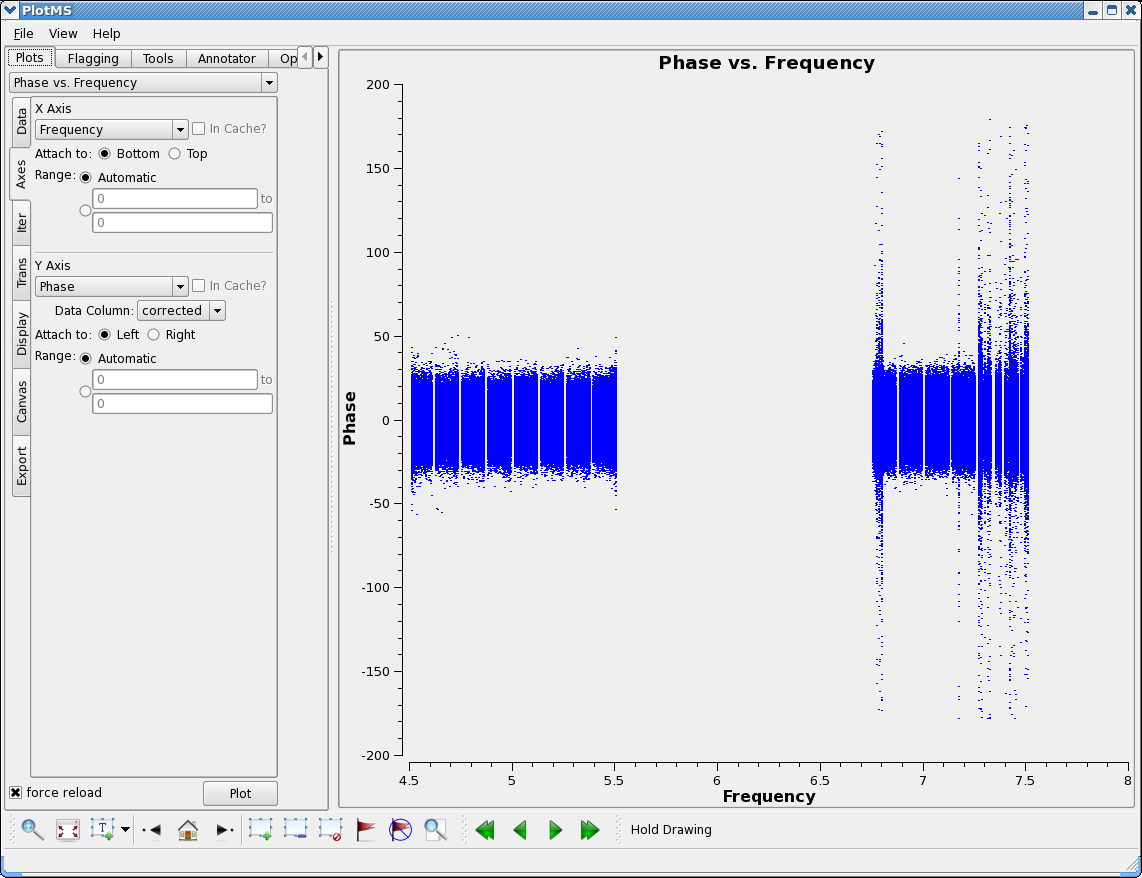
| 19:39, 26 August 2011 | PlotSN2010FZ plotms appliedflags fld0 phase.png (file) |  |
73 KB | plotms cal applied flagged fld0 phase | 1 |
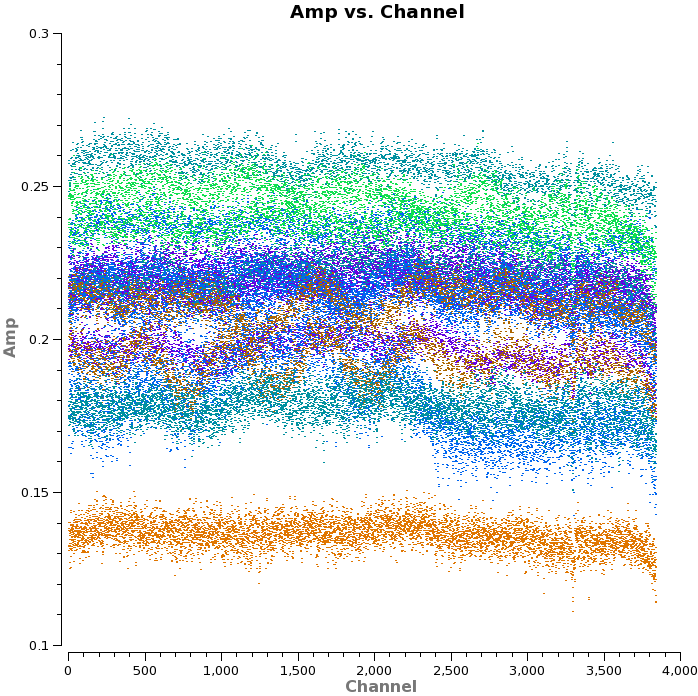
| 20:31, 25 May 2012 | Plotms.uid A002 X1ff7b0 Xb.3C279.ampvschan.png (file) |  |
74 KB | Amplitude versus channel 3c279 baselines to DV11 | 1 |
| 12:40, 2 November 2012 | ScreenshotPlotSN2010FZ plotms recalibrated3 EA12 fld0 amp 4.0.png (file) |  |
74 KB | 1 | |
| 20:58, 28 August 2011 | ViewSN2010FZ spw0to7 mfs2clean.png (file) |  |
74 KB | clean spw0-7 mfs nterms=2 intermediate progress | 1 |
| 18:39, 30 October 2012 | PlotSN2010FZ plotcal F2a1 4.0.png (file) |  |
75 KB | 1 | |
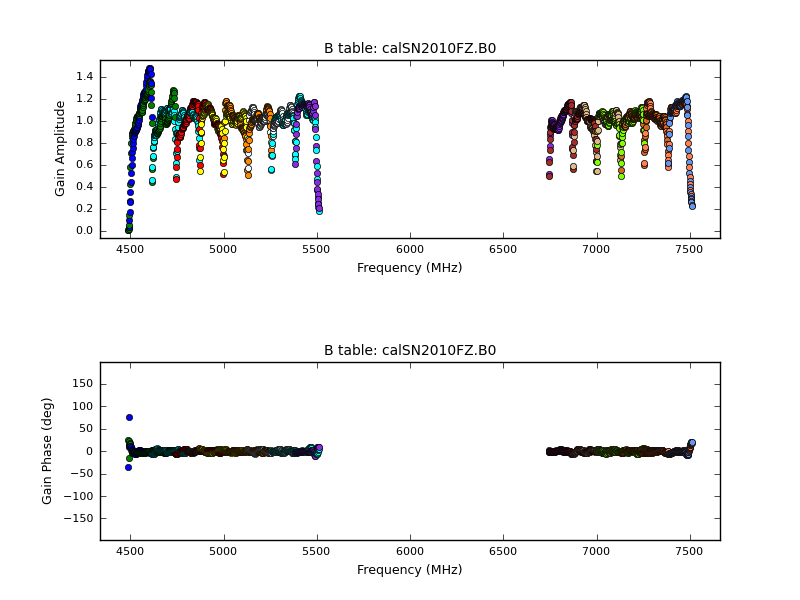
| 16:41, 26 August 2011 | PlotSN2010FZ plotcal B0ea01.png (file) |  |
75 KB | 2 | |
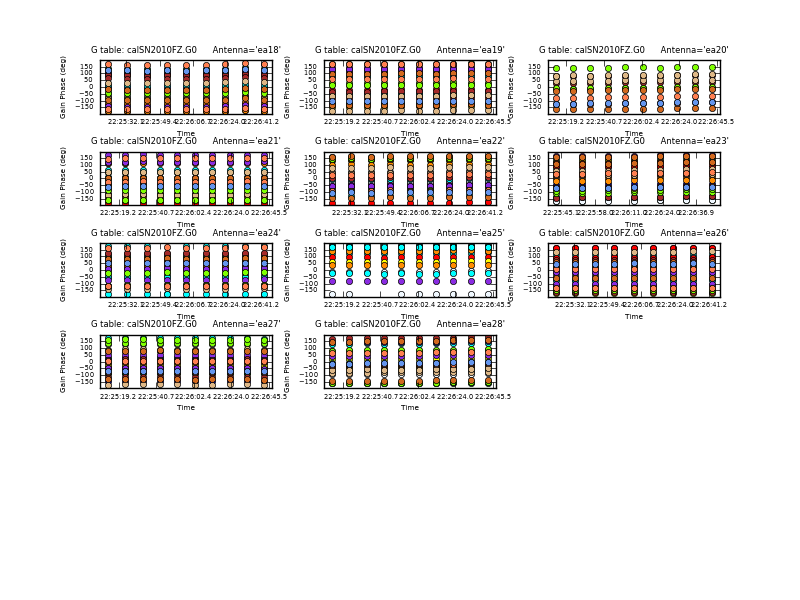
| 13:59, 26 August 2011 | PlotSN2010FZ plotcal G0p2.png (file) |  |
75 KB | plotcal G0 phase 2nd set of antennas | 1 |
| 19:56, 26 August 2011 | PlotSN2010FZ plotms appliedflags fld1.png (file) |  |
76 KB | plotms cal applied flagged fld1 amp | 1 |
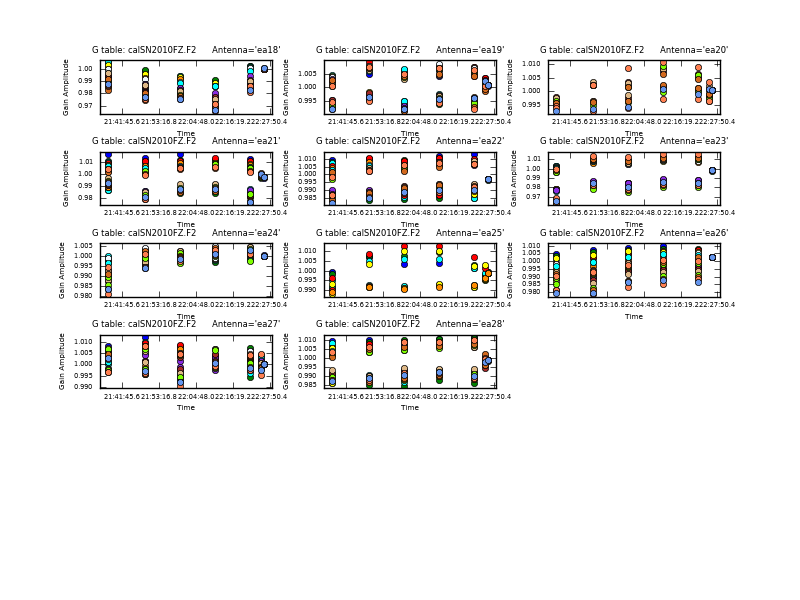
| 11:58, 1 September 2011 | PlotSN2010FZ plotcal F2a2.png (file) |  |
76 KB | 2 |