Uploads by Akimball
From CASA Guides
Jump to navigationJump to search
This special page shows all uploaded files.
| Date | Name | Thumbnail | Size | Description | Versions |
|---|---|---|---|---|---|
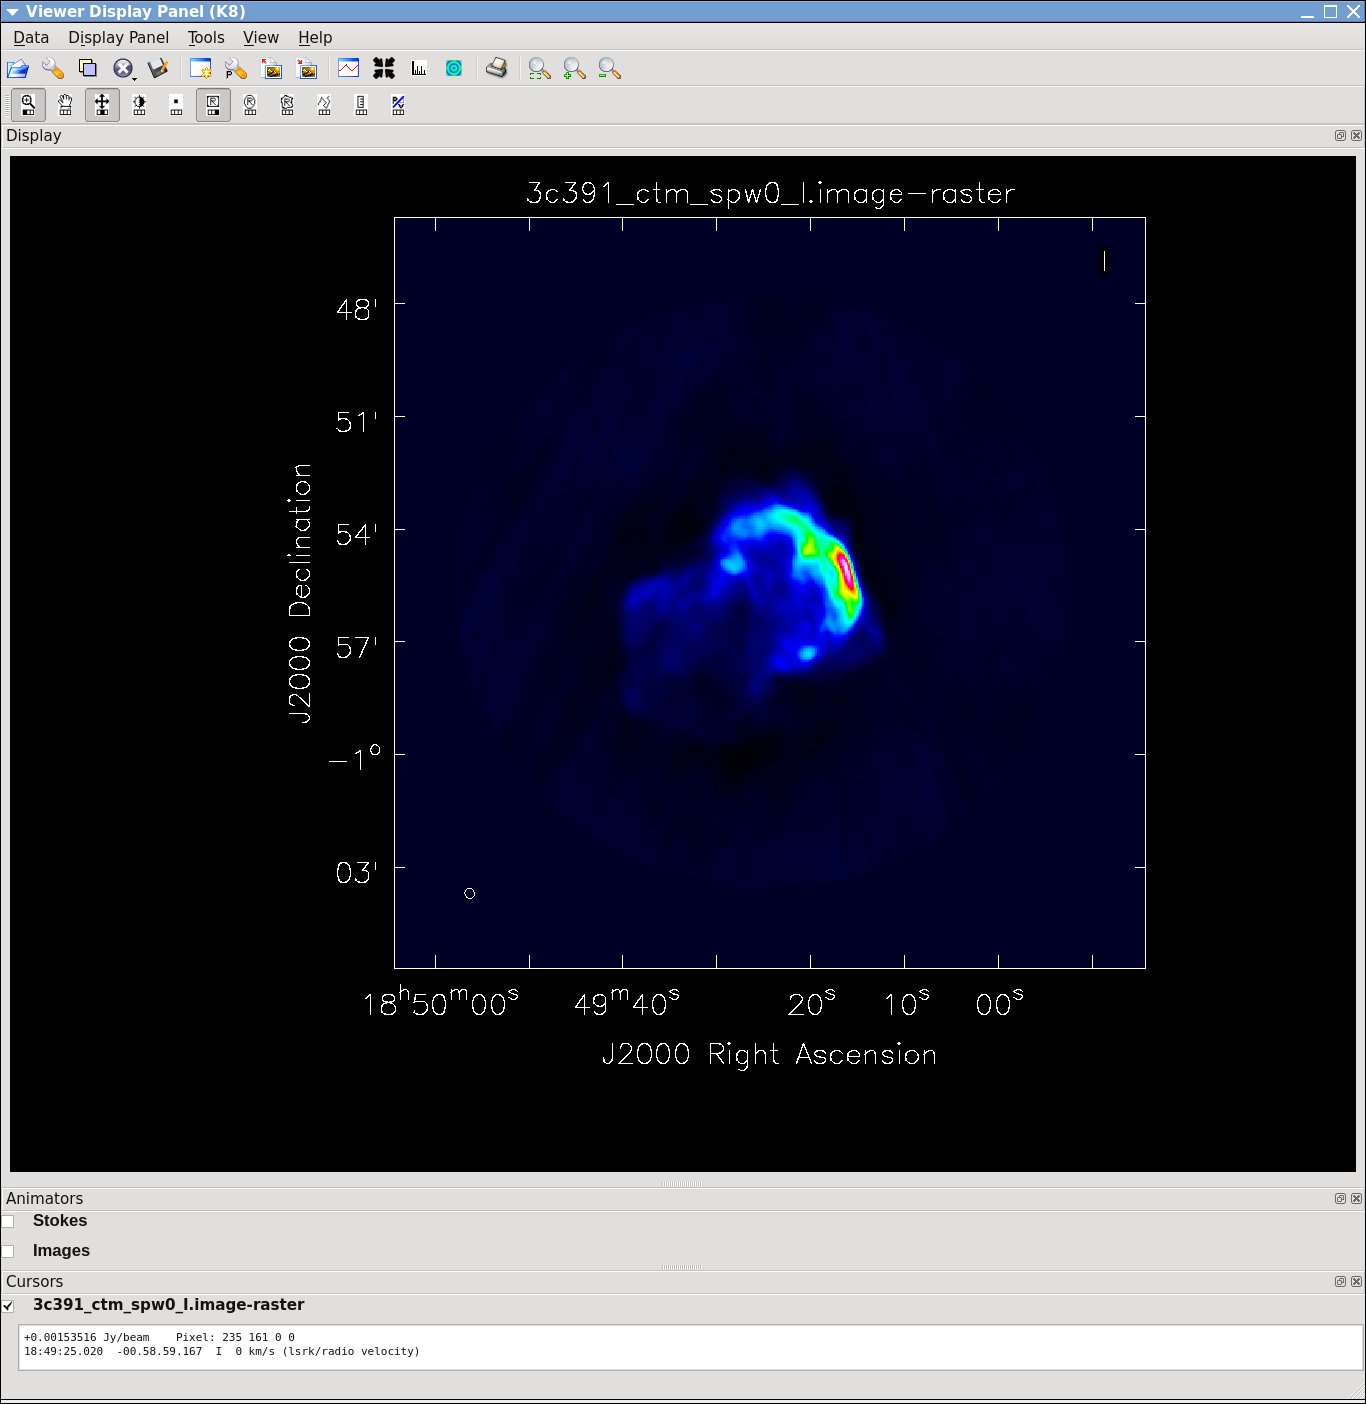
| 19:48, 28 November 2018 | 3c391-tclean-final CASA5.4.0.jpeg (file) |  |
145 KB | 1 | |
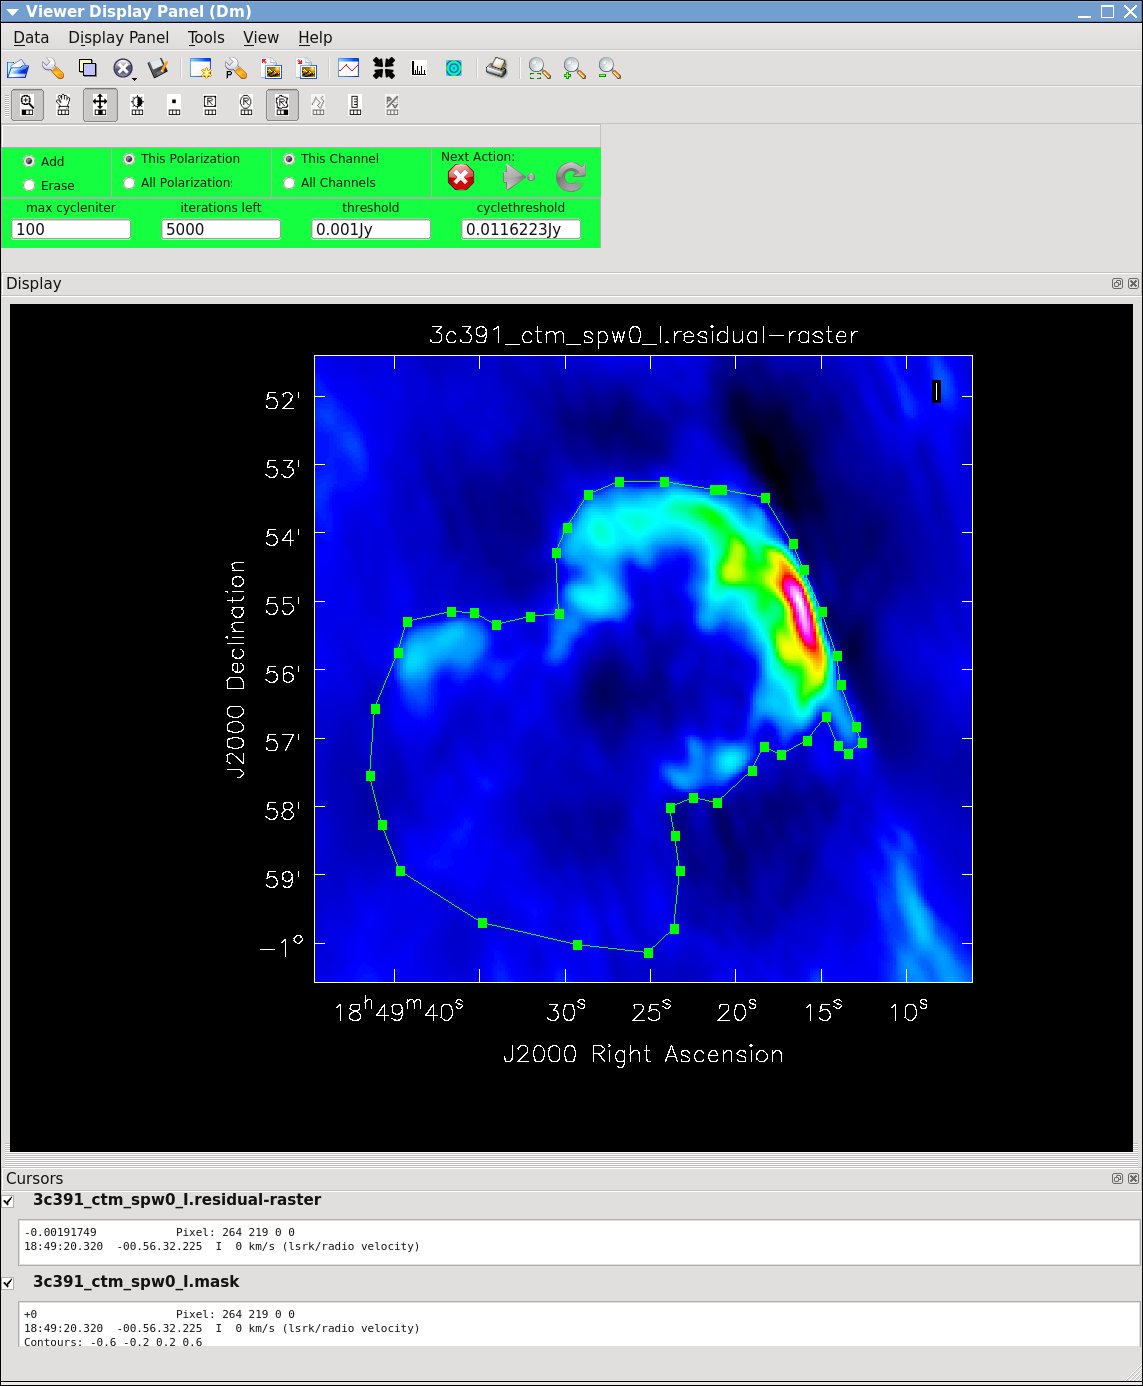
| 15:50, 28 November 2018 | 3c391-tclean-interactive-iter3000 CASA5.4.0.jpeg (file) |  |
206 KB | 1 | |
| 15:50, 28 November 2018 | 3c391-tclean-interactive-start CASA5.4.0.jpeg (file) |  |
185 KB | 1 | |
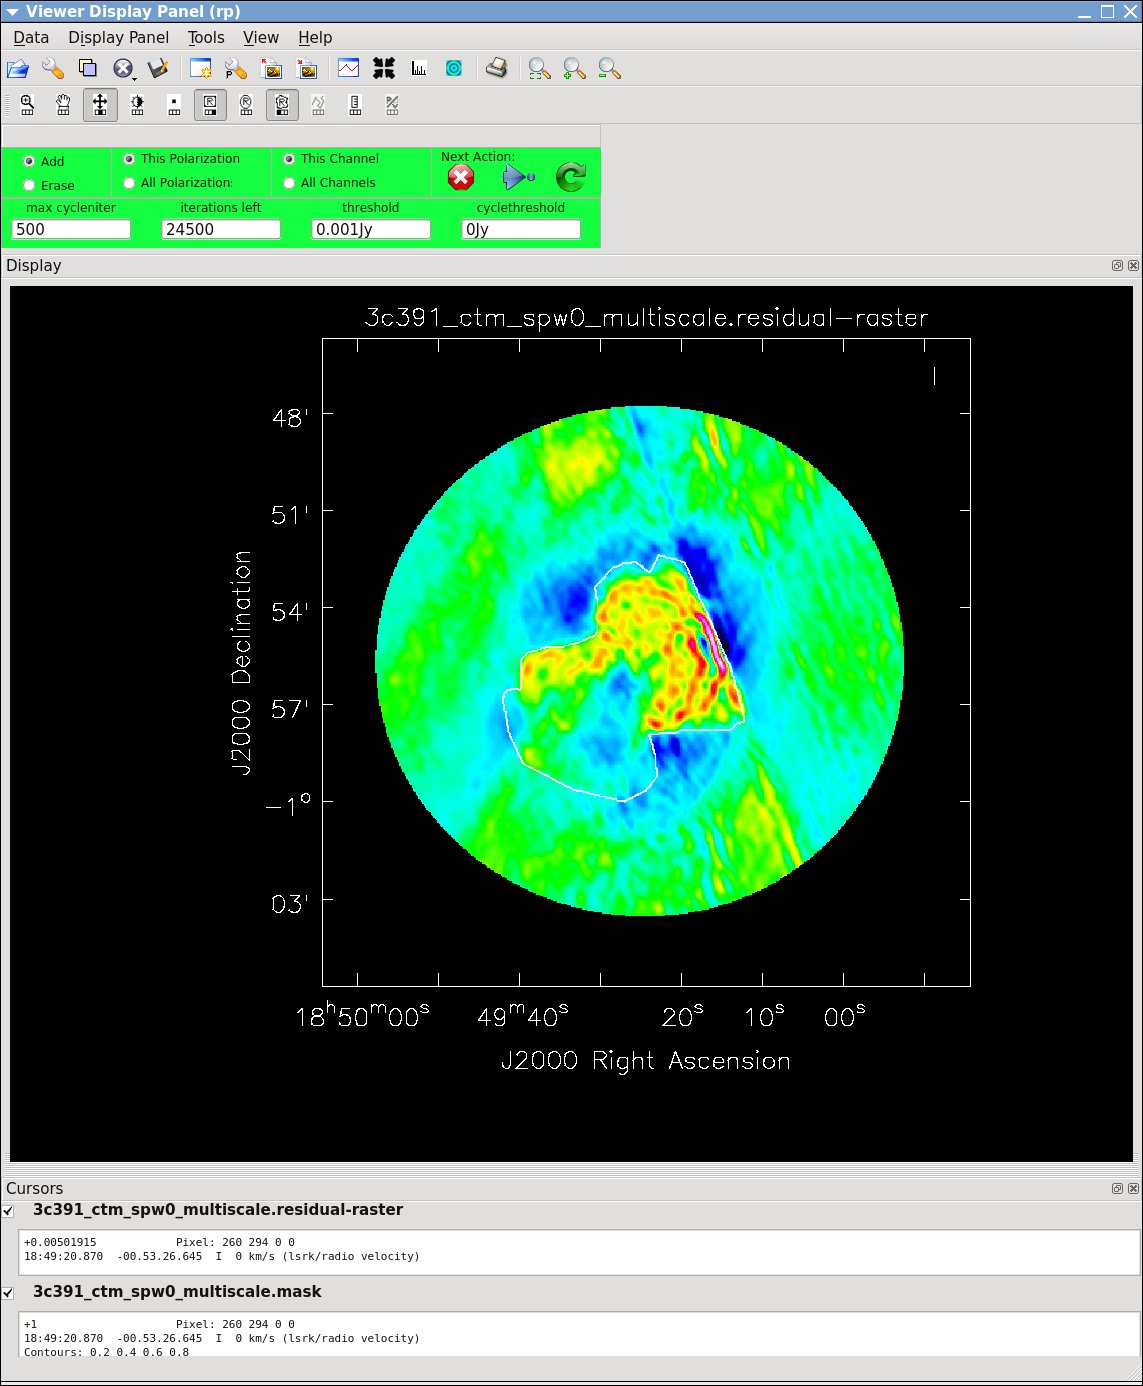
| 13:59, 29 November 2018 | 3c391-tclean-multiscale-500iters CASA5.4.0.jpeg (file) |  |
197 KB | 1 | |
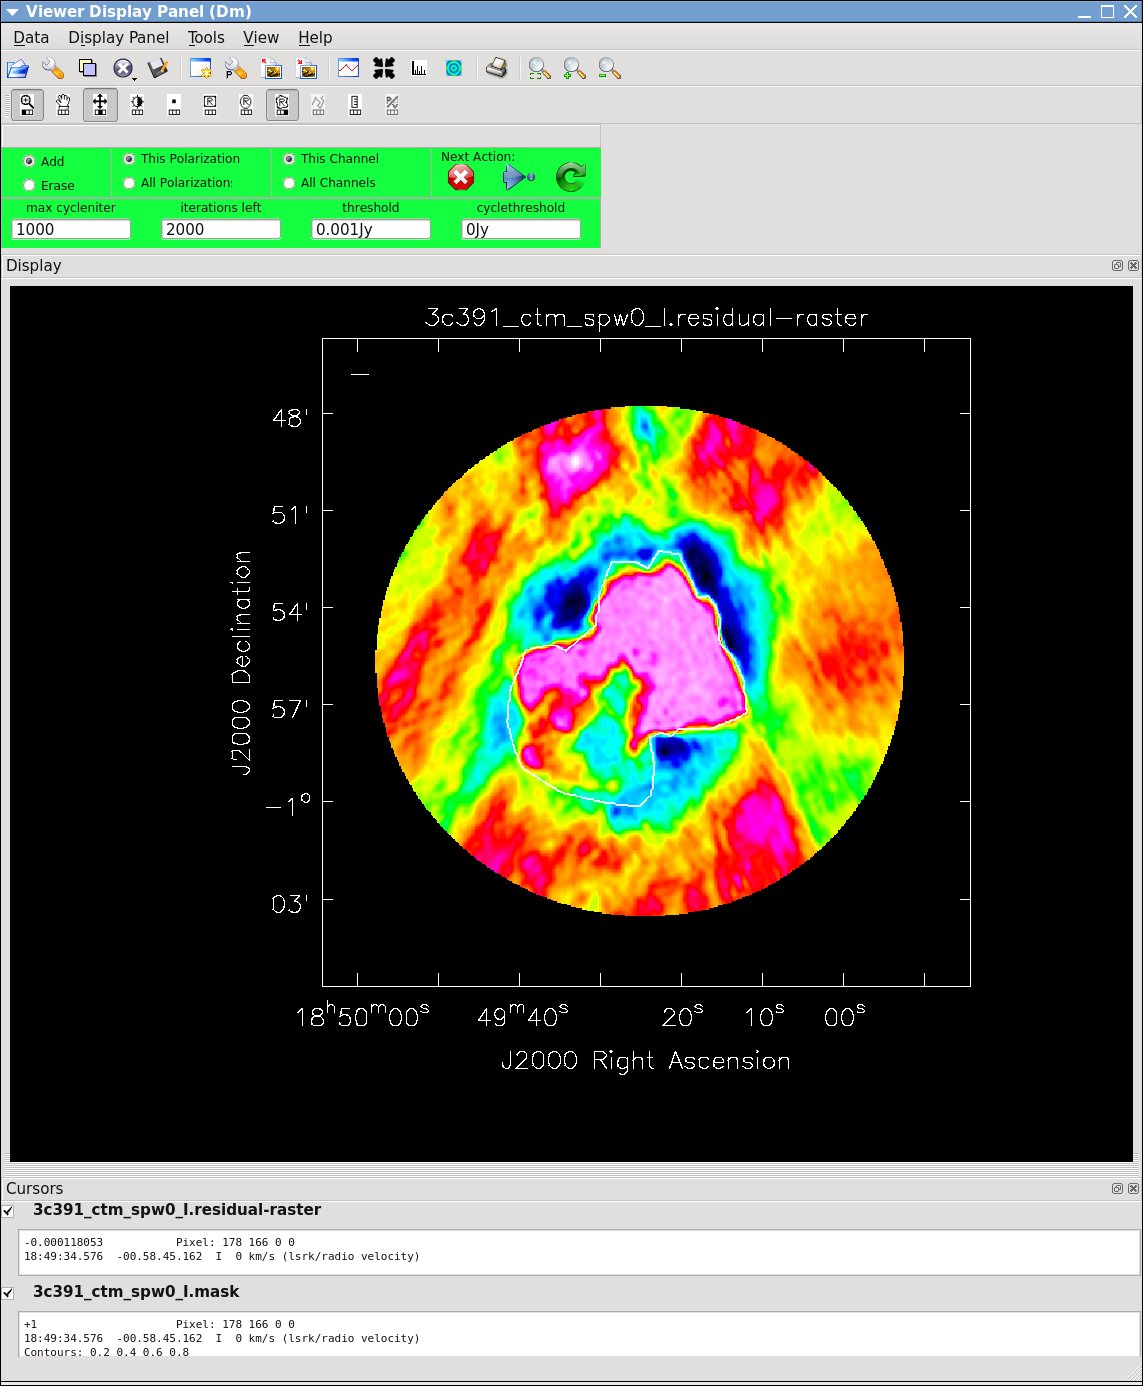
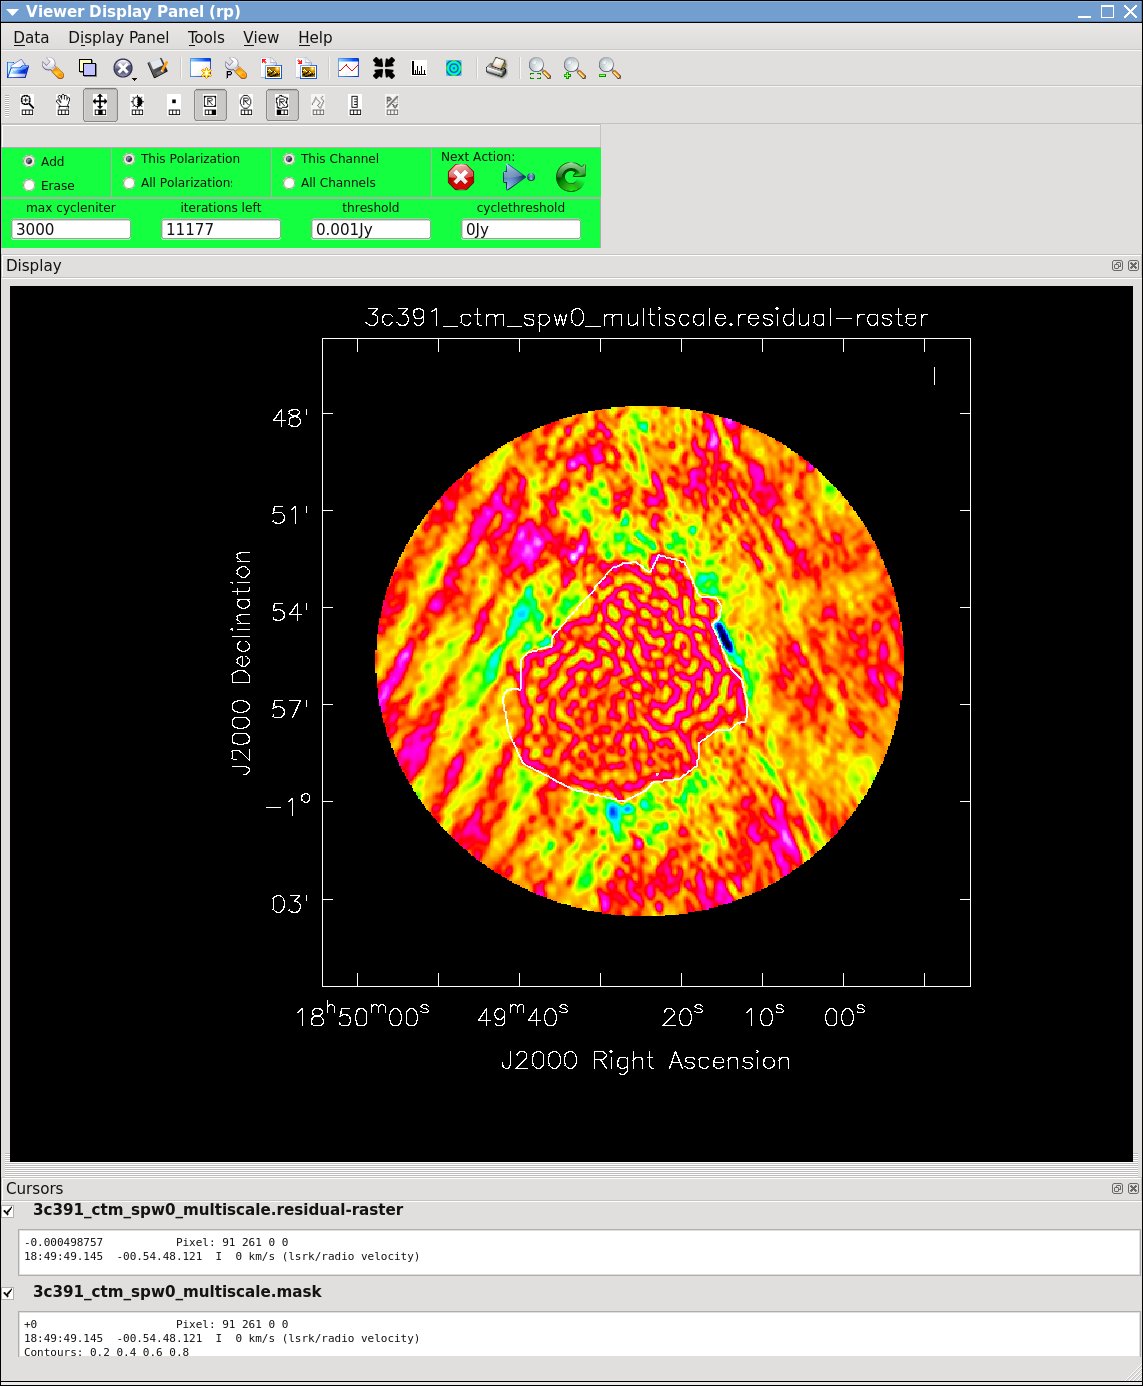
| 14:42, 29 November 2018 | 3c391-tclean-residuals CASA5.4.0.jpeg (file) |  |
232 KB | 1 | |
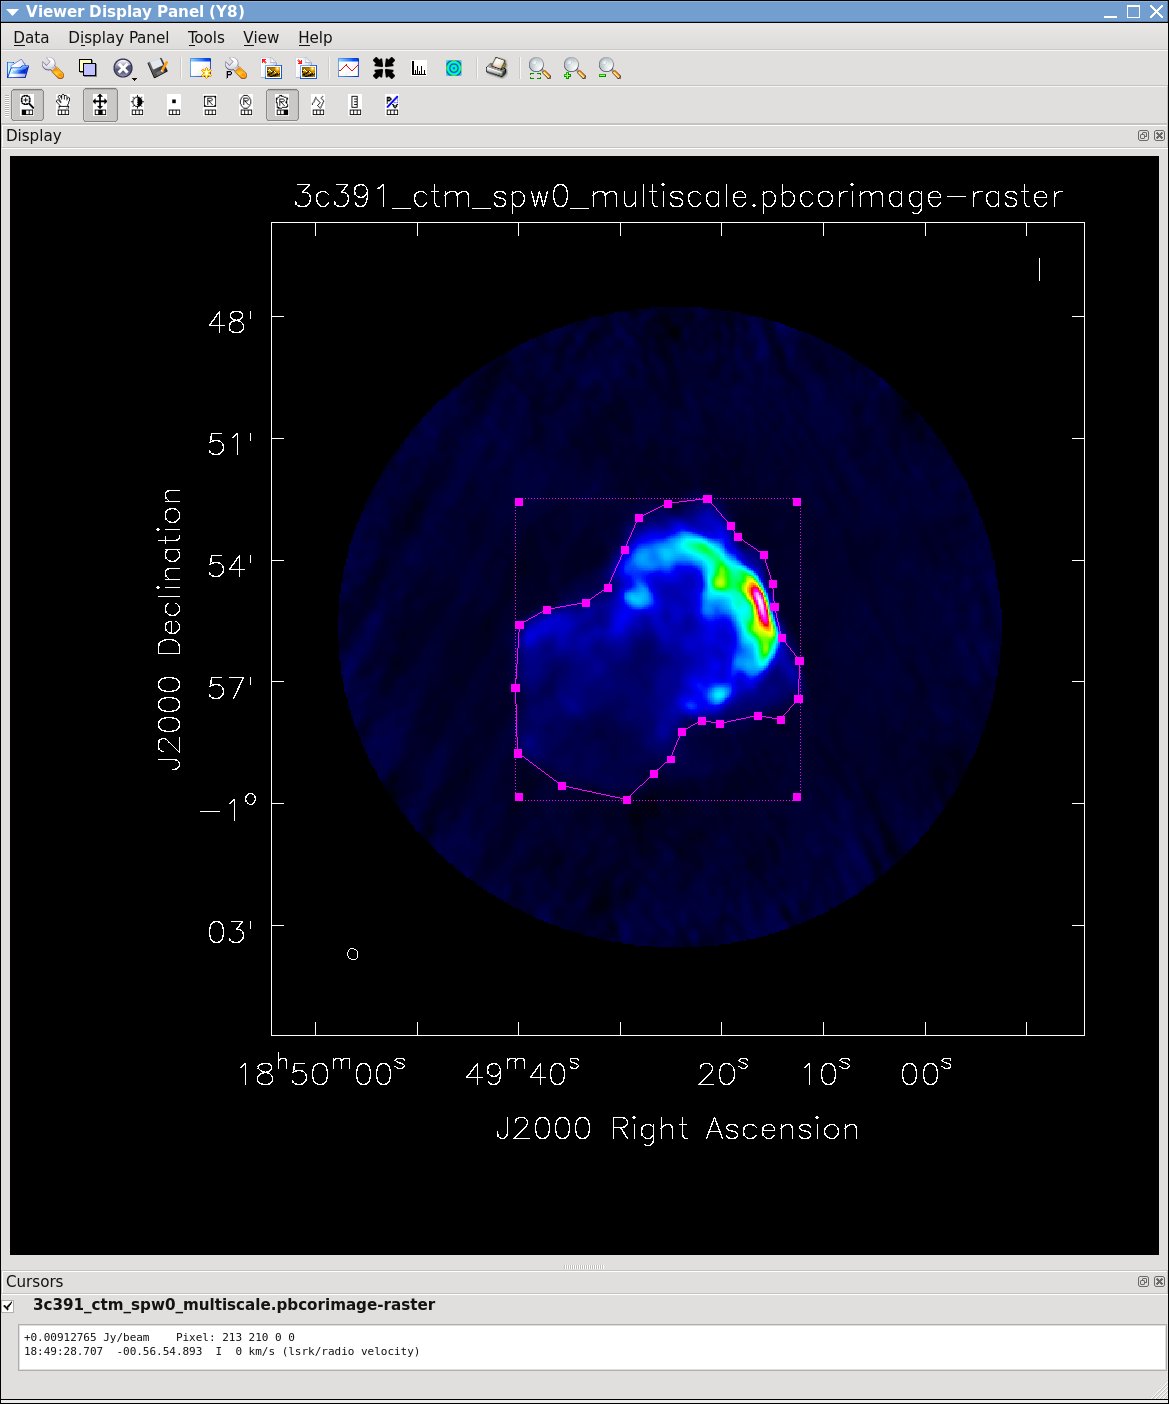
| 16:31, 29 November 2018 | 3c391-viewer-final-polygon CASA5.4.0.jpeg (file) |  |
151 KB | 1 | |
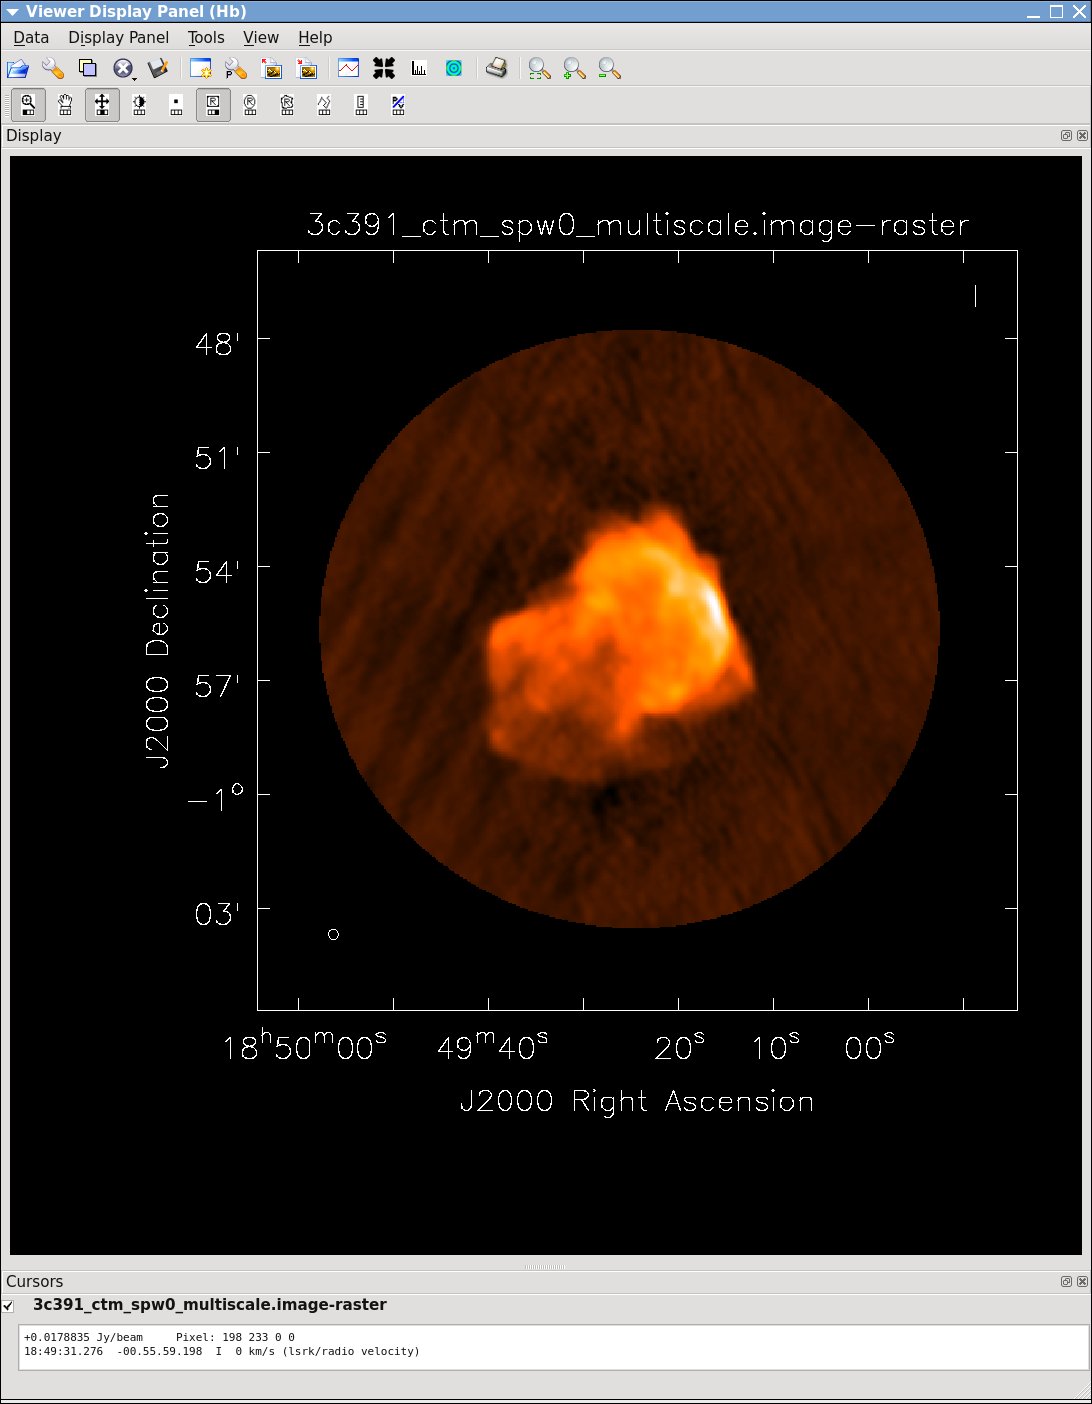
| 14:49, 29 November 2018 | 3c391-viewer-multiscale-final CASA5.4.0.jpeg (file) |  |
146 KB | 1 | |
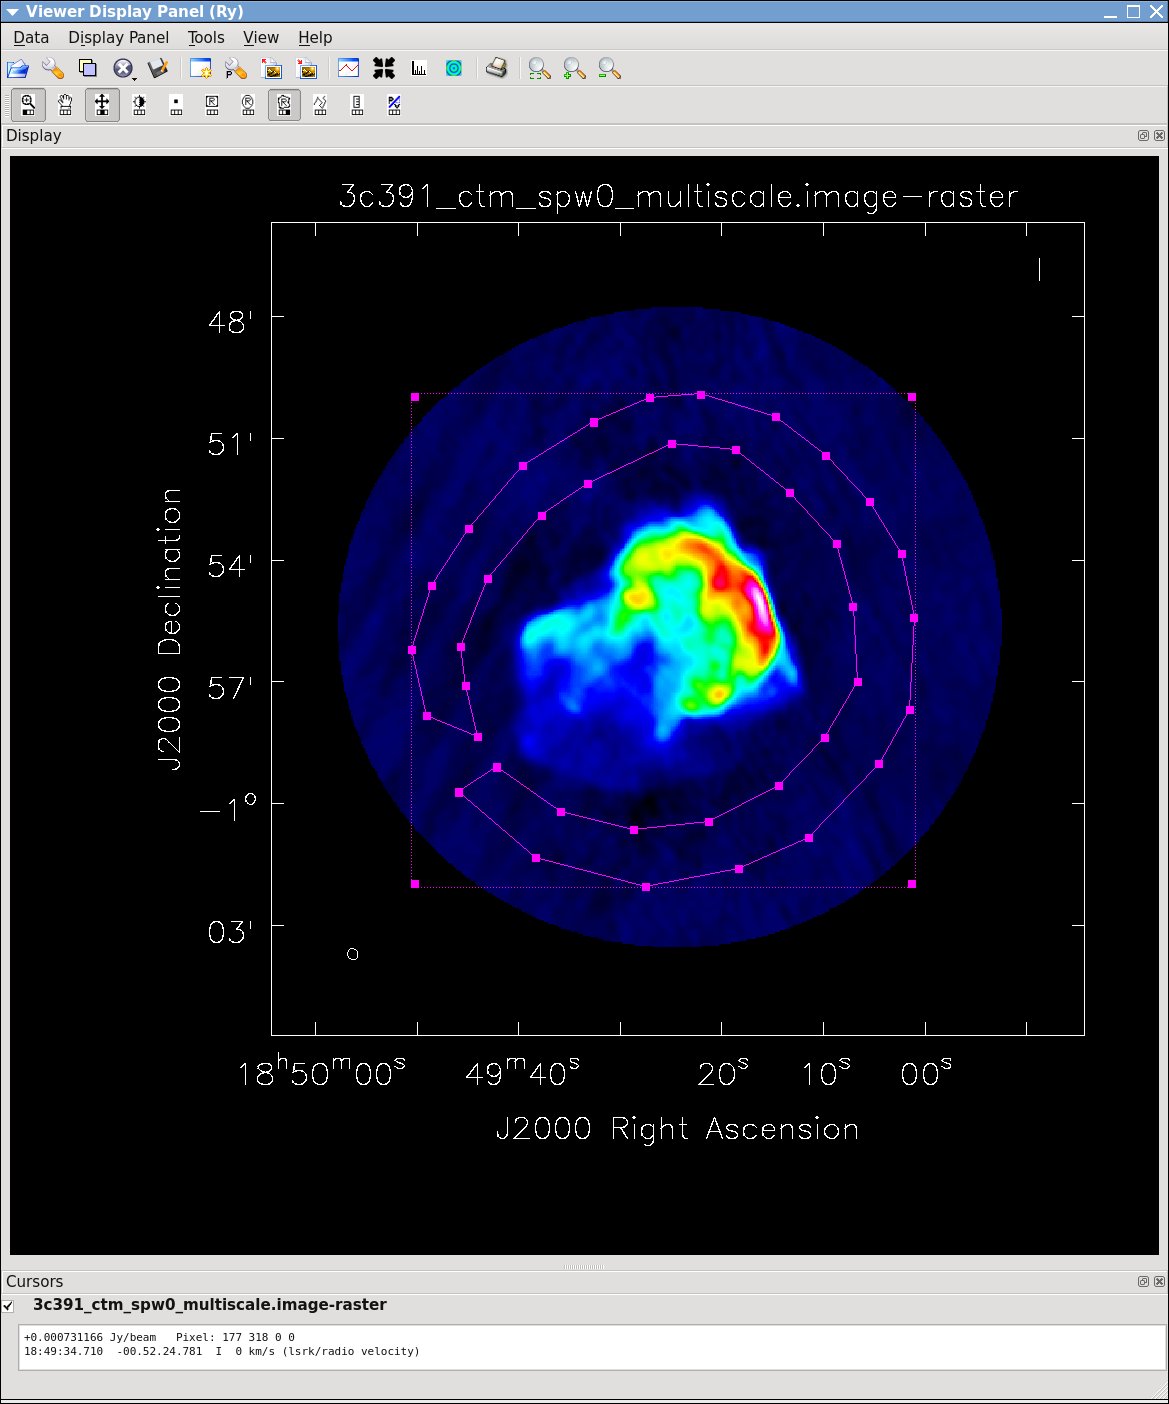
| 16:38, 29 November 2018 | 3c391-viewer-polygon-forrms CASA5.4.0.jpeg (file) |  |
170 KB | 1 | |
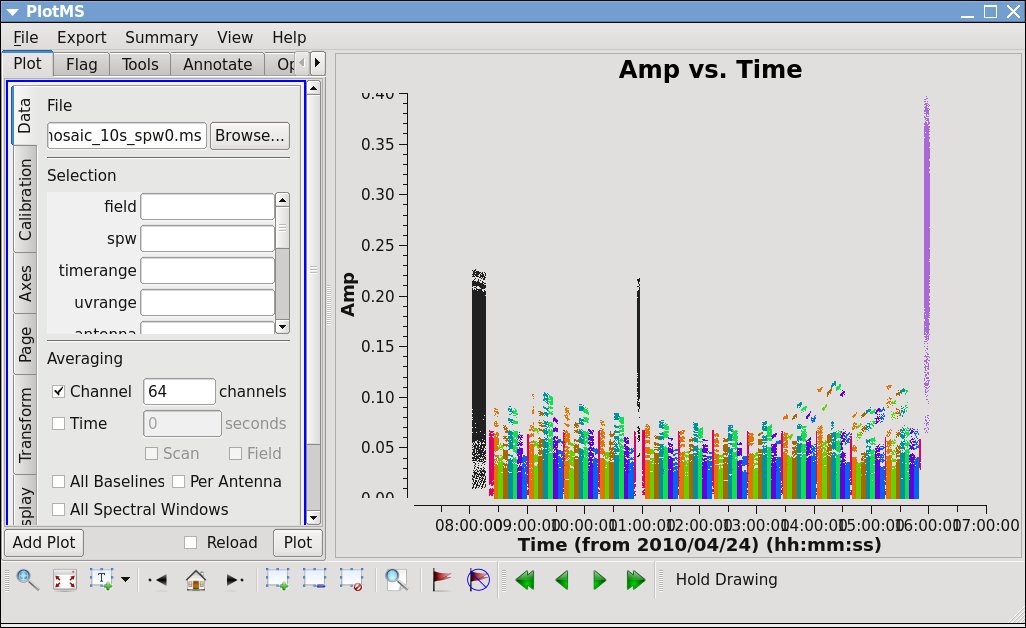
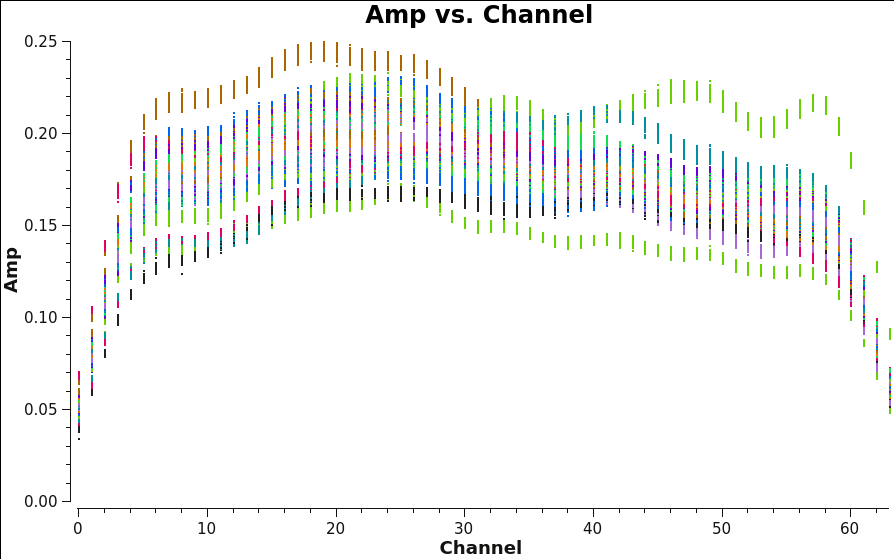
| 17:30, 14 October 2010 | AmpVfreq colorspw.png (file) |  |
87 KB | For mm/submm guide: SMA line data. To demonstrate that there is overlap between spectral windows. Plotms of amplitude vs frequency, averaged over time, scan, baseline, colored by spw. | 1 |
| 12:59, 21 April 2016 | Colorbyfield 4.6.jpeg (file) |  |
142 KB | 2 | |
| 19:15, 30 October 2018 | Colorbyfield CASA5.4.0.jpeg (file) |  |
120 KB | 2 | |
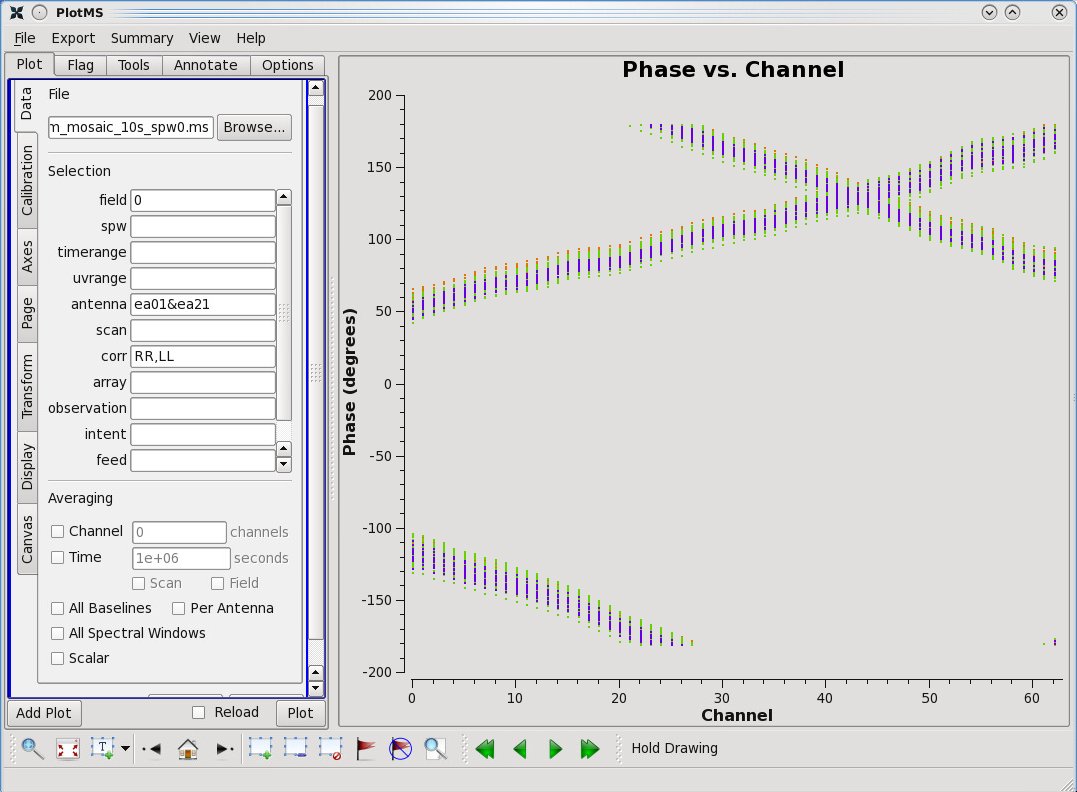
| 18:23, 21 April 2016 | Delays ea01ea21 4.6.jpeg (file) |  |
125 KB | An example of delays across the bandpass that need solving for. | 1 |
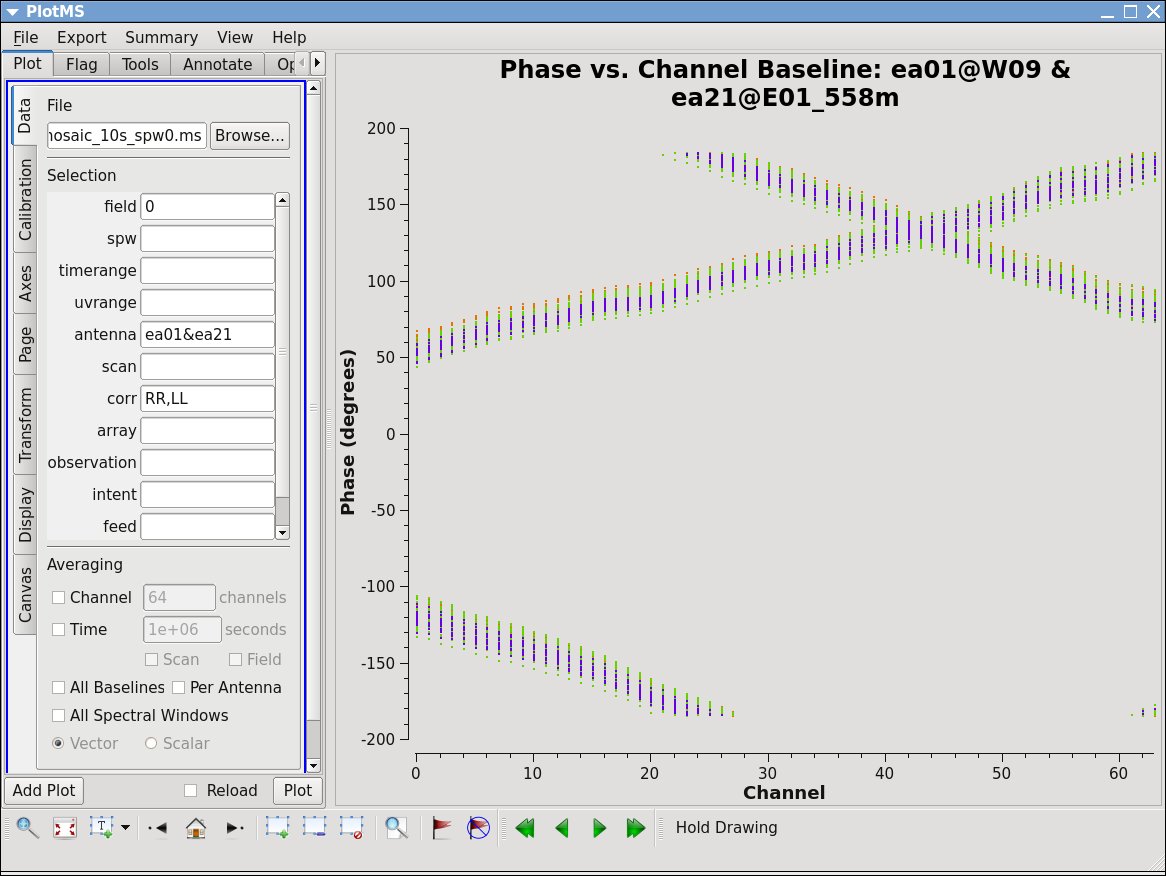
| 19:23, 30 October 2018 | Delays ea01ea21 CASA5.4.0.jpeg (file) |  |
141 KB | 1 | |
| 13:40, 30 April 2011 | Einstein es extended 10min.gif (file) |  |
42 KB | 1 | |
| 13:43, 30 April 2011 | Einstein es extended 4hr.gif (file) |  |
31 KB | 1 | |
| 13:48, 30 April 2011 | Einstein fs cfg16 1hr.gif (file) |  |
54 KB | 2 | |
| 17:32, 29 April 2011 | Einstein fs cfg8 10min.gif (file) |  |
44 KB | Reverted to version as of 19:25, 29 April 2011 | 4 |
| 13:33, 30 April 2011 | Einstein fs cfg8 1hr.gif (file) |  |
40 KB | Reverted to version as of 17:32, 30 April 2011 | 4 |
| 13:46, 30 April 2011 | Einstein fs cfg8 8hr.gif (file) |  |
41 KB | 2 | |
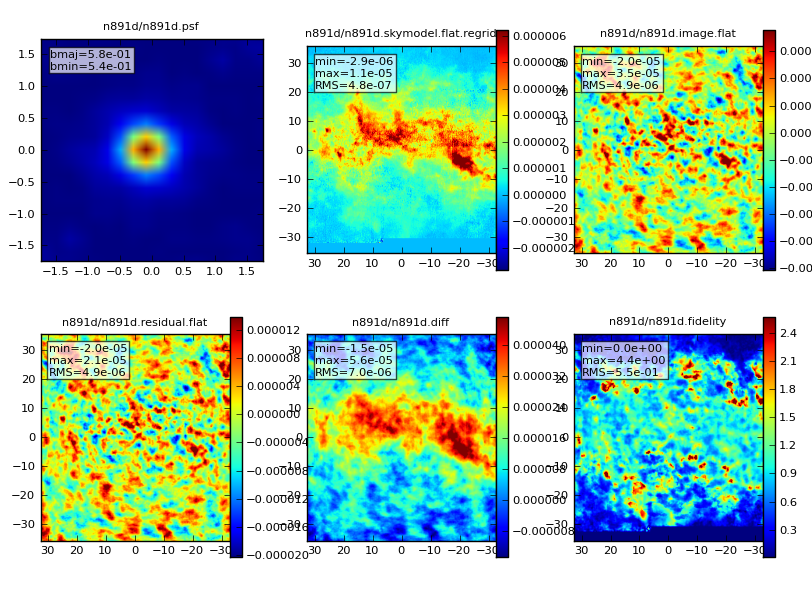
| 14:16, 30 April 2011 | N891d.analysis.png (file) |  |
497 KB | 2 | |
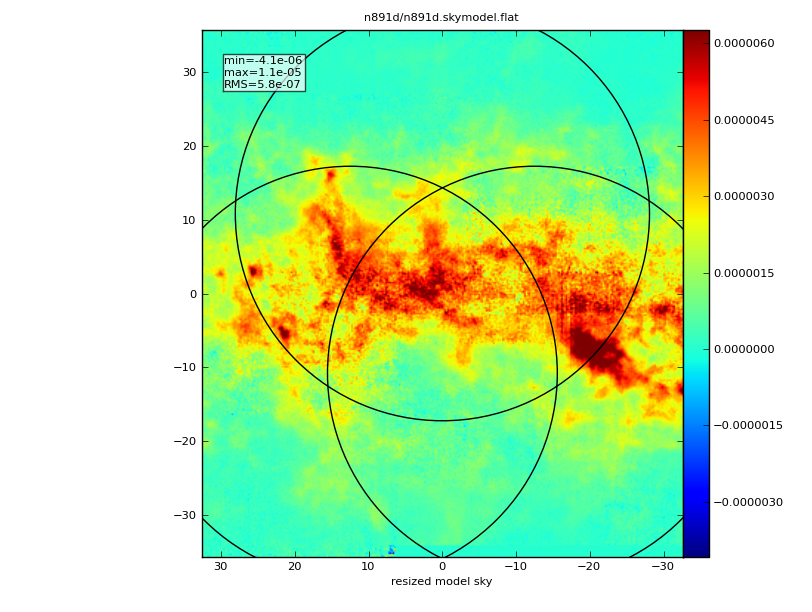
| 14:14, 30 April 2011 | N891d.skymodel.png (file) |  |
401 KB | 2 | |
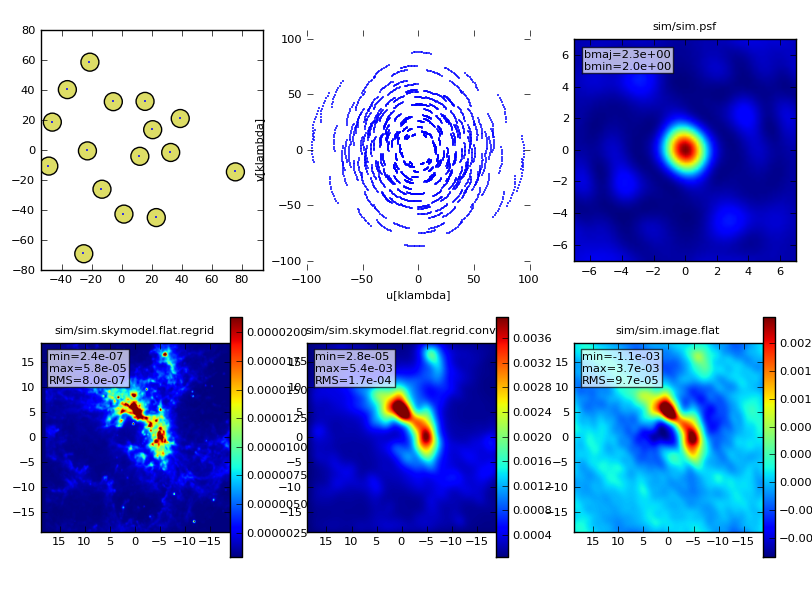
| 17:47, 17 May 2011 | NewUsersGuide.3.2 sim.analysis.png (file) |  |
203 KB | 2 | |
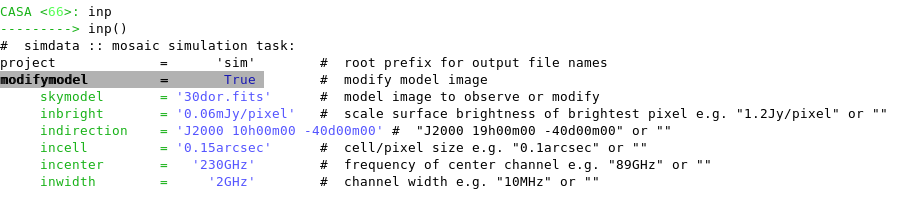
| 17:42, 17 May 2011 | NewUsersGuide.modifymodel.png (file) | 34 KB | 3 | ||
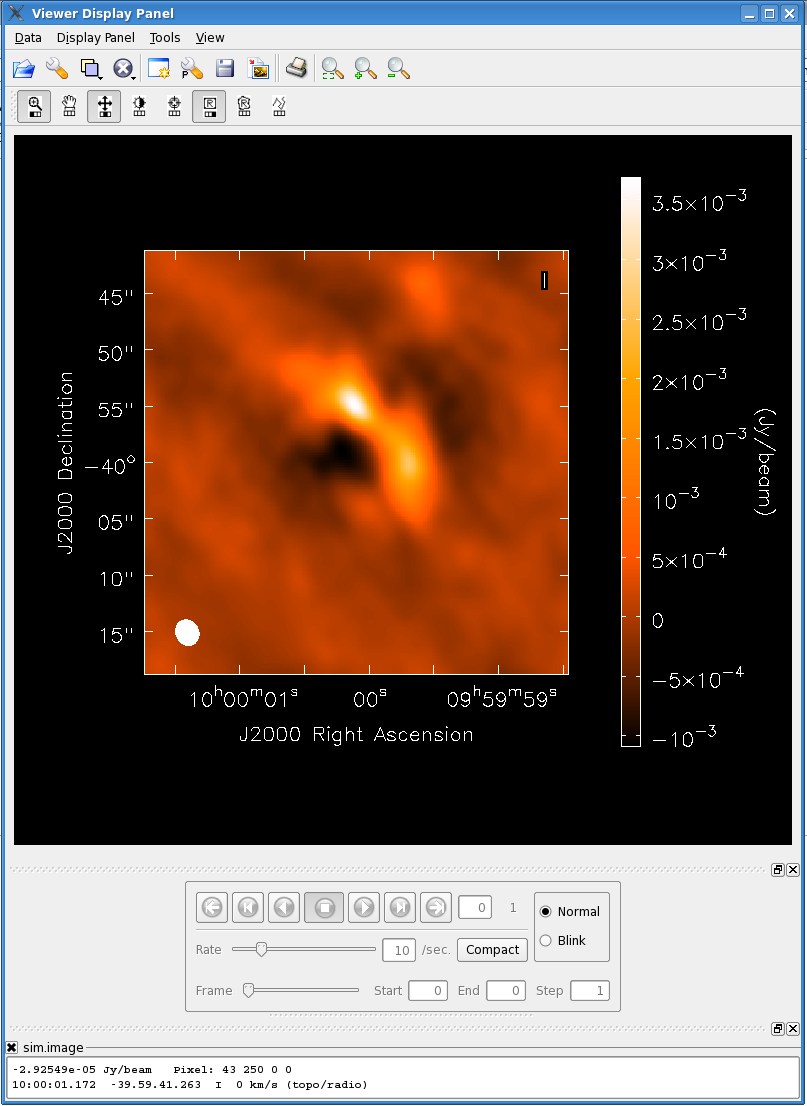
| 17:51, 17 May 2011 | NewUsersGuide3.2.Viewer.Image.png (file) |  |
74 KB | 2 | |
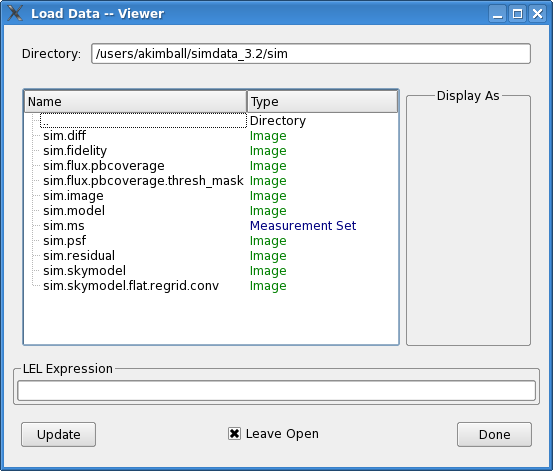
| 18:10, 28 April 2011 | NewUsersGuide3.2.Viewer.Load.png (file) |  |
38 KB | 2 | |
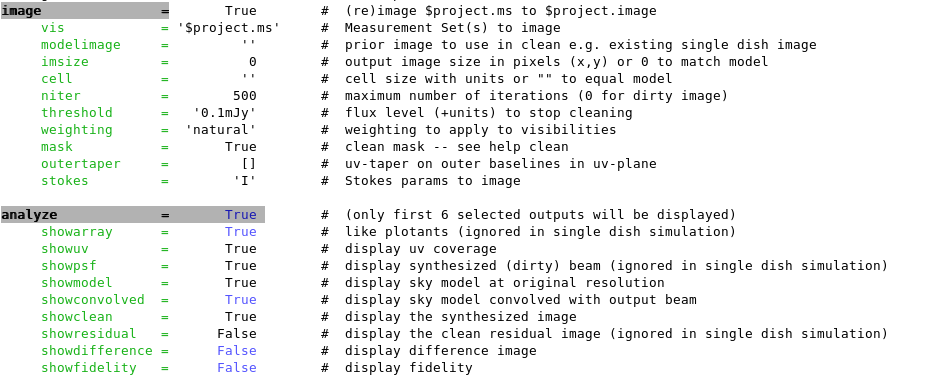
| 17:31, 28 April 2011 | NewUsersGuide3.2.image.analyze.png (file) |  |
73 KB | 1 | |
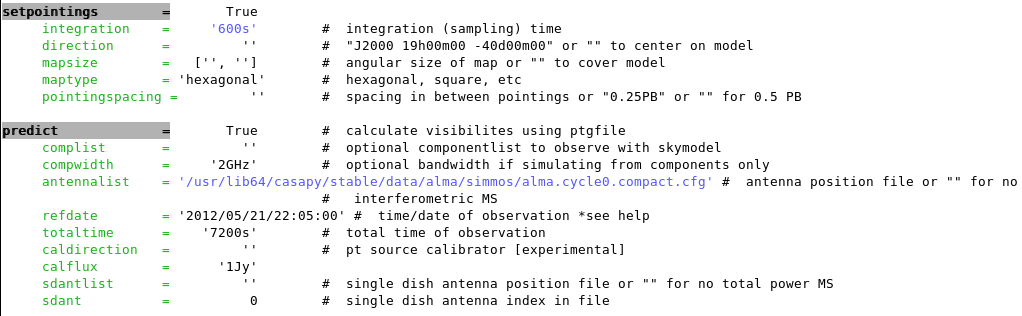
| 17:19, 28 April 2011 | NewUsersGuide3.2.setpointings.predict.png (file) |  |
56 KB | 1 | |
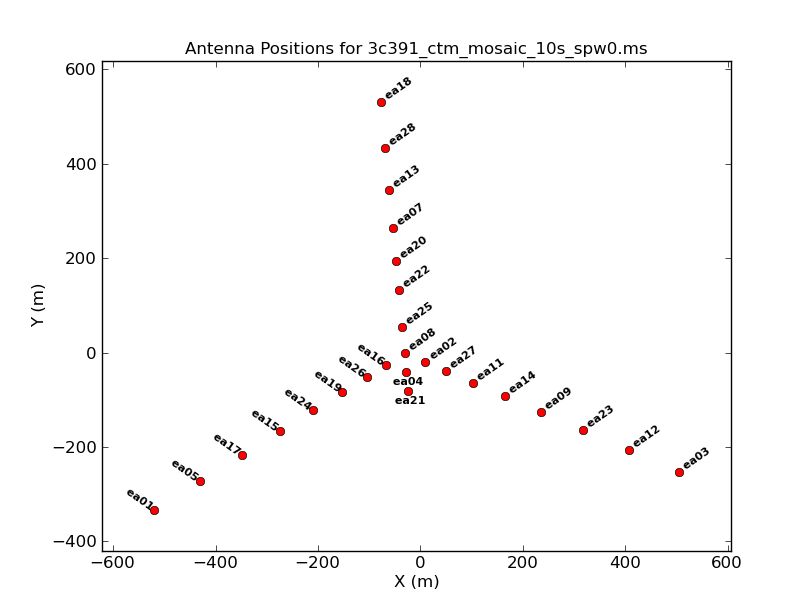
| 18:56, 30 October 2018 | Plotants 3c391 antenna layout CASA5.4.0.png (file) |  |
49 KB | 1 | |
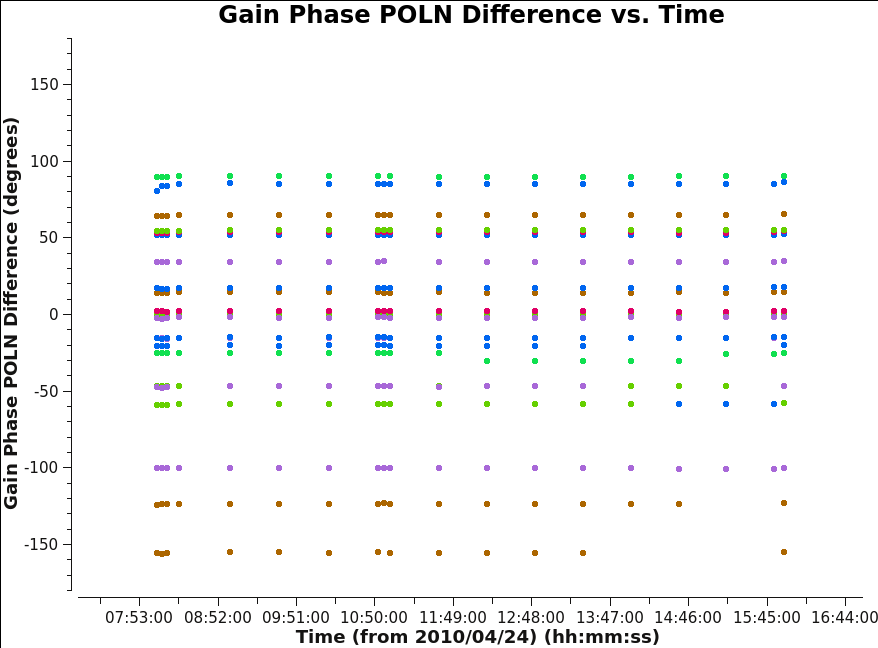
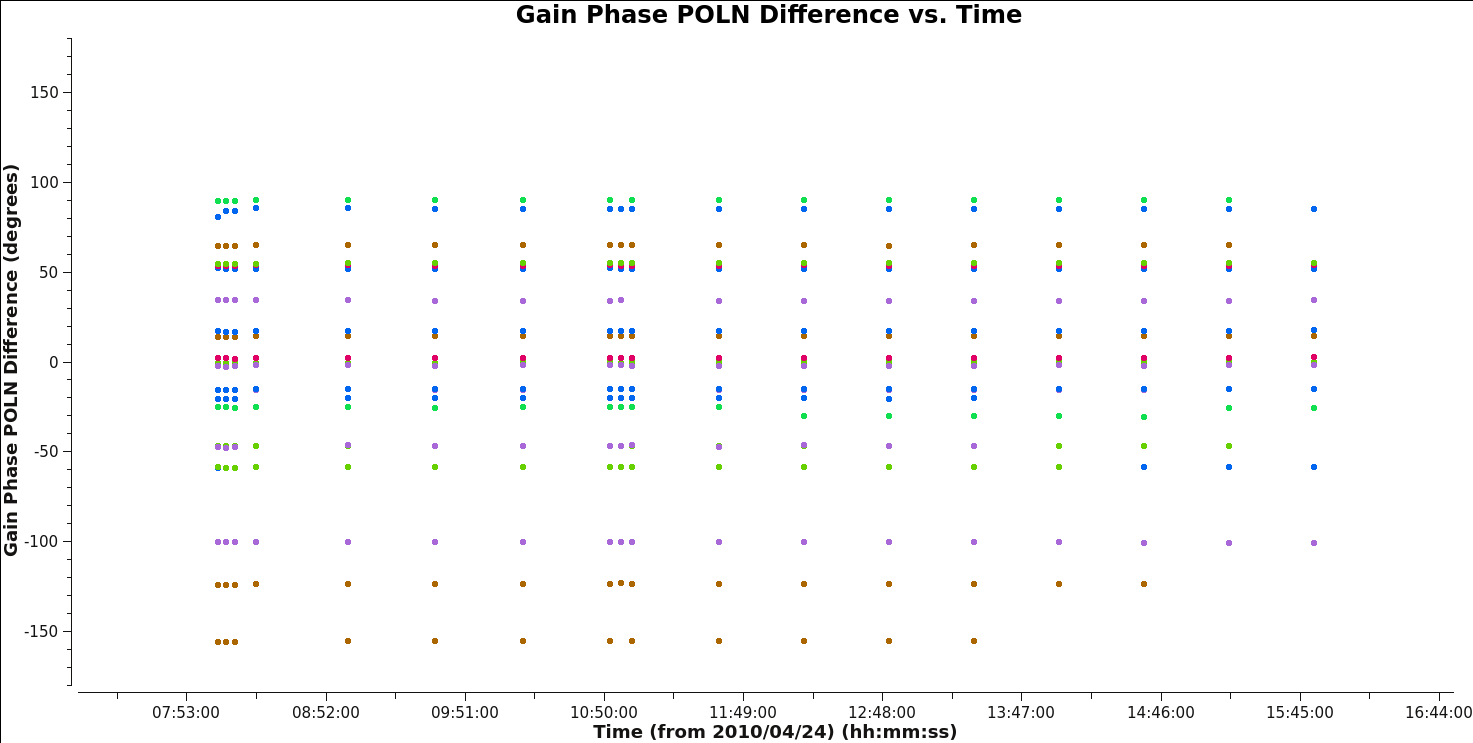
| 16:52, 27 November 2018 | Plotcal 3c391-G1-RLphasediff-CASA5.0.4.png (file) |  |
38 KB | 1 | |
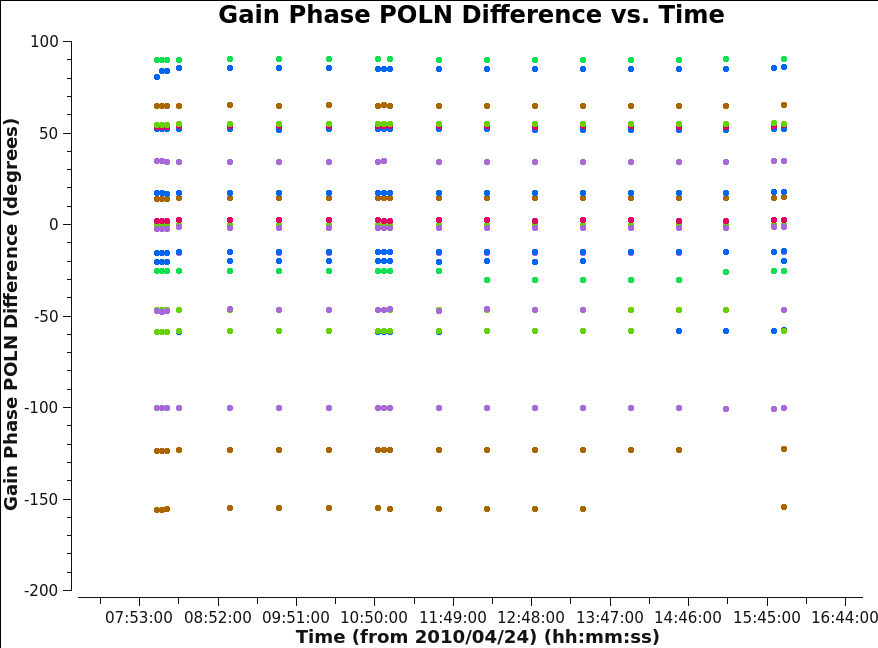
| 16:54, 27 November 2018 | Plotcal 3c391-G1-RLphasediff-CASA5.4.0.png (file) |  |
38 KB | 1 | |
| 17:32, 4 June 2019 | Plotcal 3c391-G1-RLphasediff-CASA5.5.0.png (file) |  |
42 KB | 1 | |
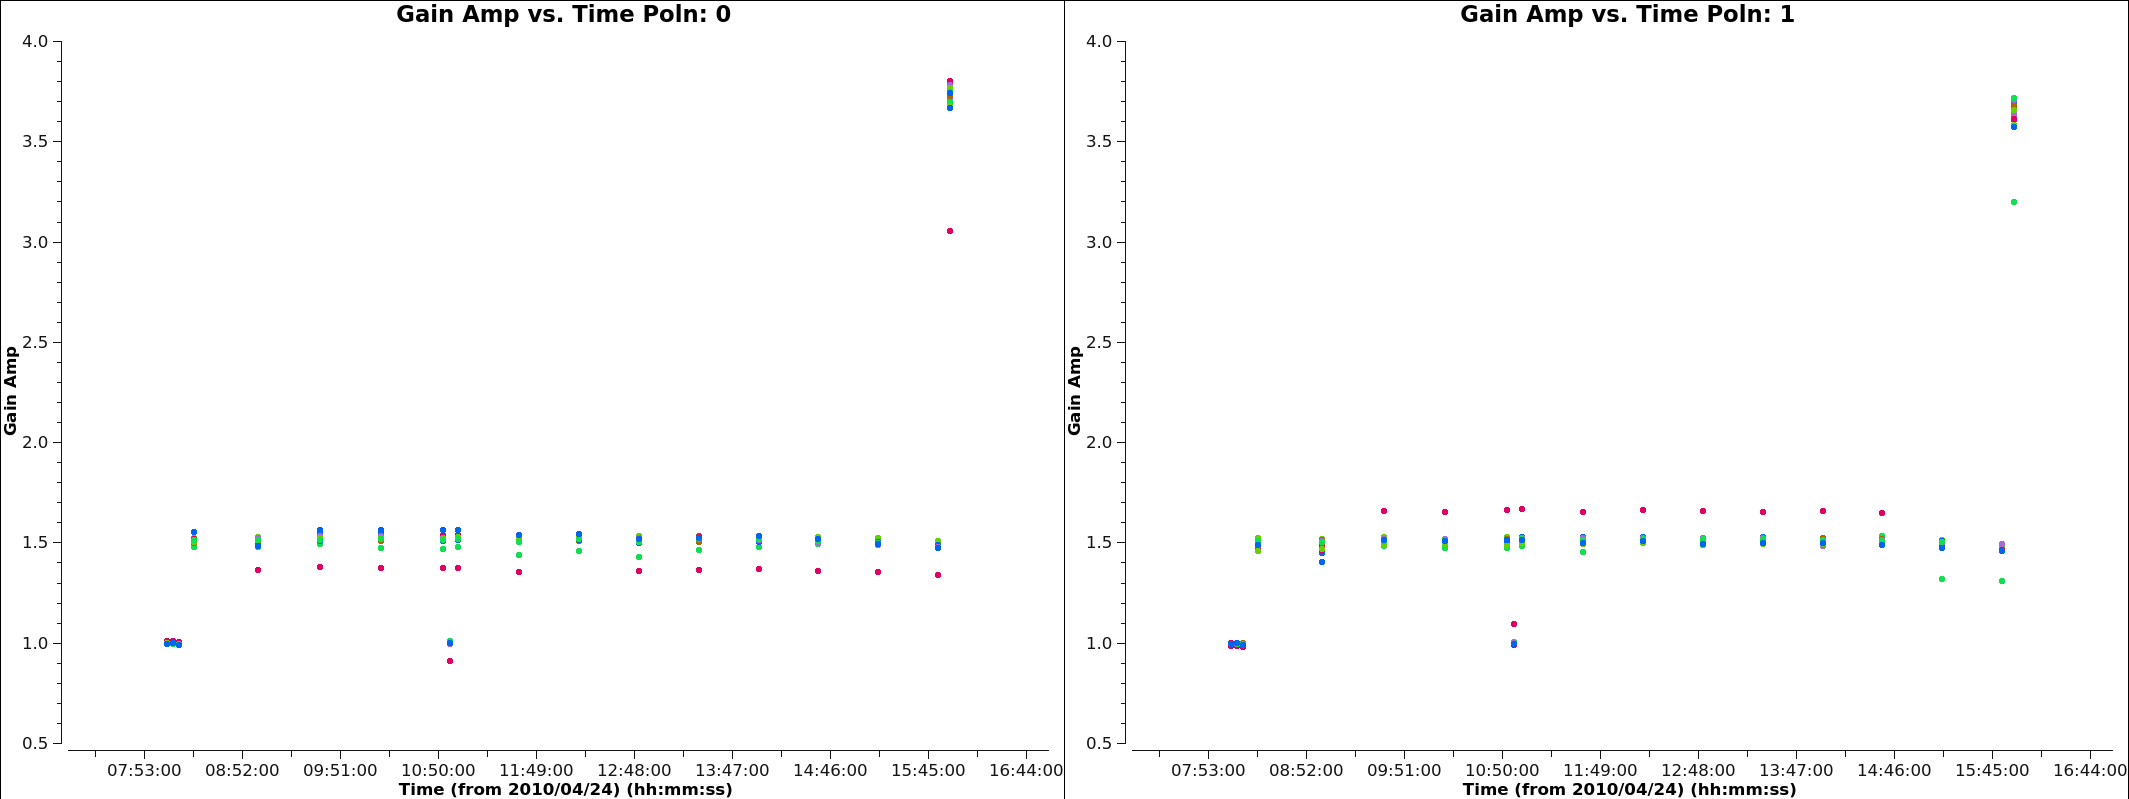
| 18:32, 23 September 2017 | Plotcal 3c391-G1-amp-L-5.0.png (file) |  |
23 KB | 1 | |
| 18:32, 23 September 2017 | Plotcal 3c391-G1-amp-R-5.0.png (file) |  |
22 KB | 1 | |
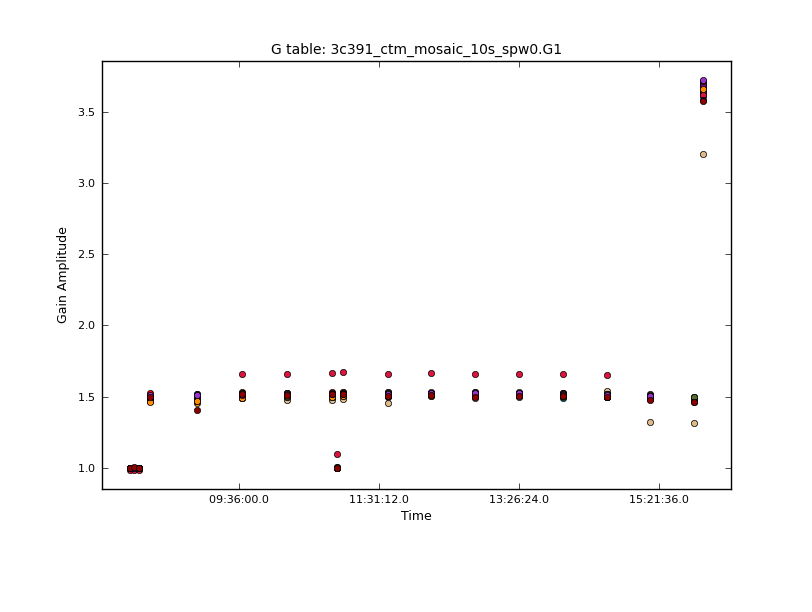
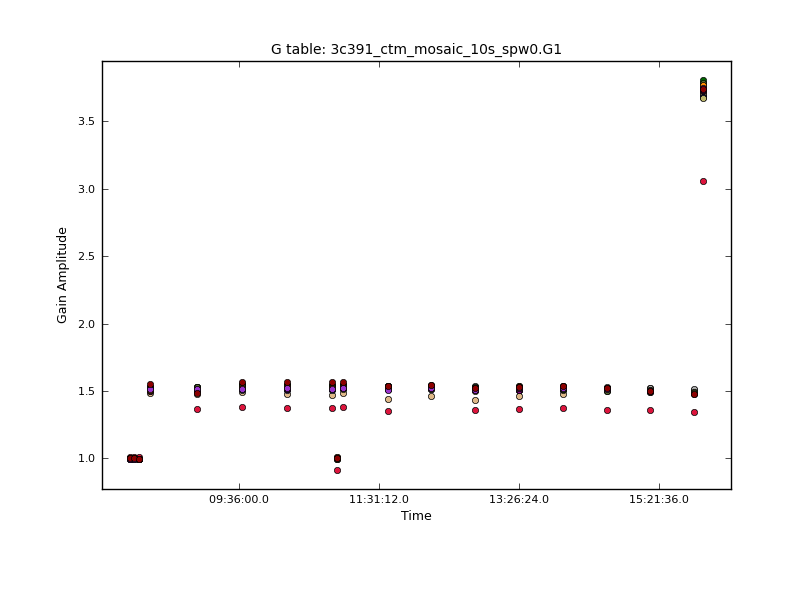
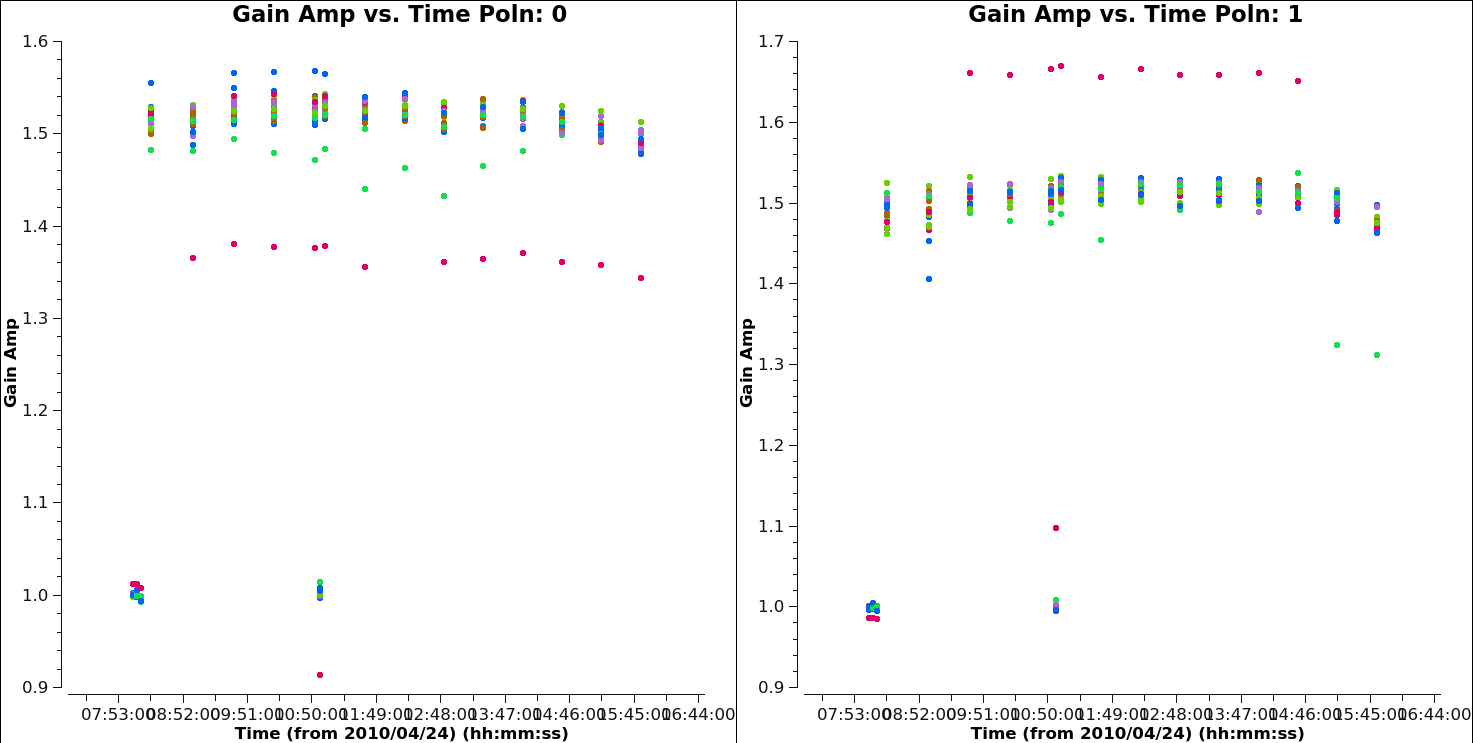
| 16:37, 27 November 2018 | Plotcal 3c391-G1-amp-pol-CASA5.4.0.png (file) |  |
38 KB | 1 | |
| 17:16, 4 June 2019 | Plotcal 3c391-G1-amp-pol-CASA5.5.0.png (file) |  |
39 KB | 1 | |
| 18:32, 23 September 2017 | Plotcal 3c391-G1-phase-L-5.0.png (file) |  |
43 KB | 1 | |
| 18:34, 23 September 2017 | Plotcal 3c391-G1-phase-R-5.0.png (file) |  |
42 KB | 2 | |
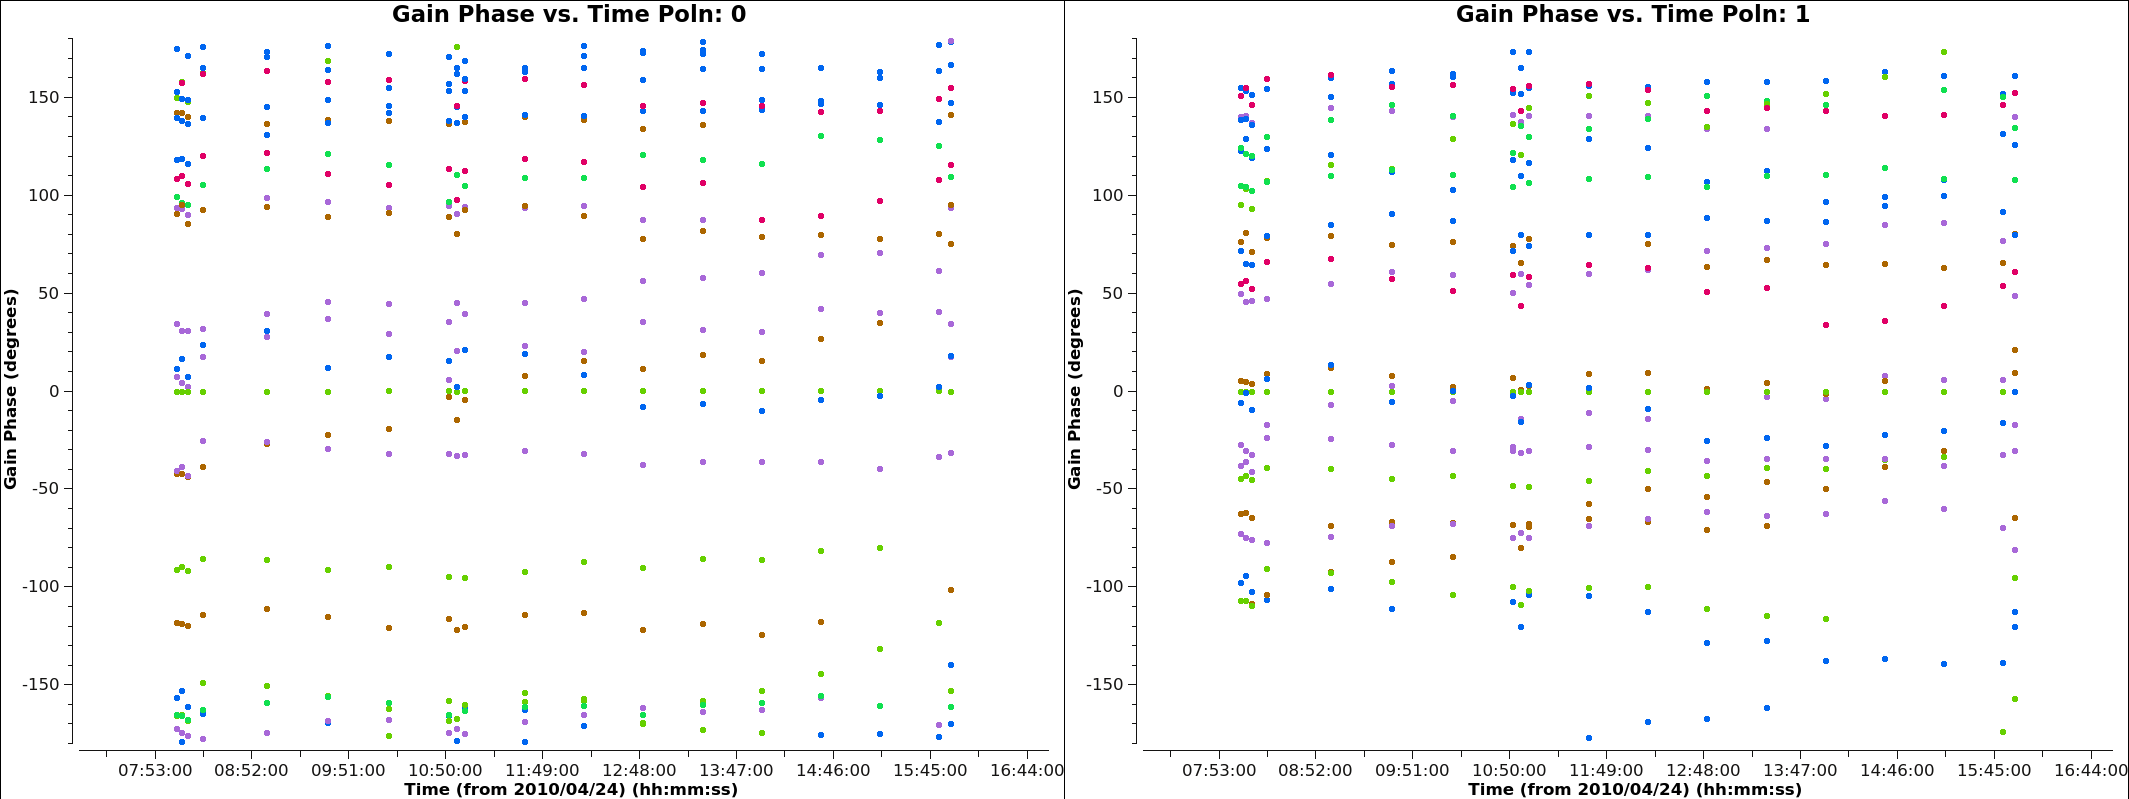
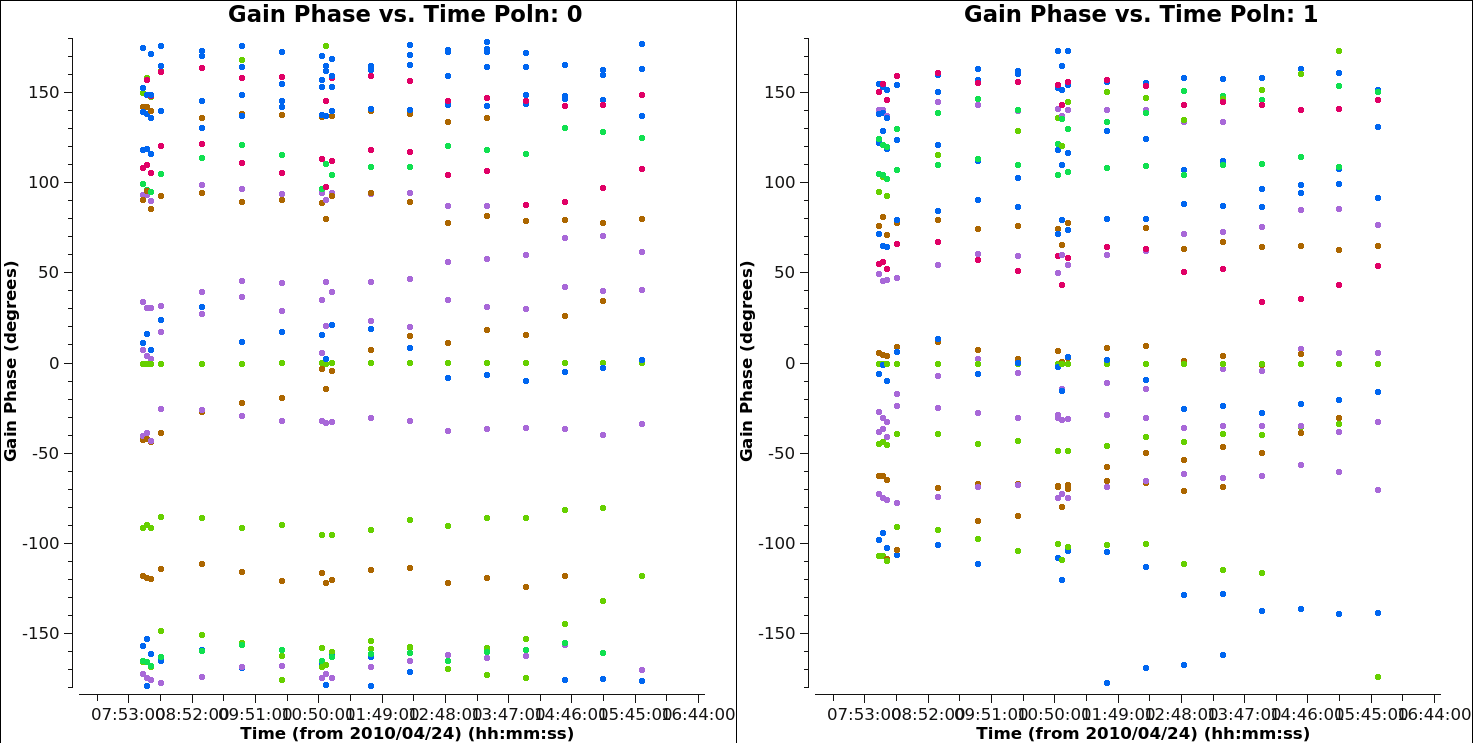
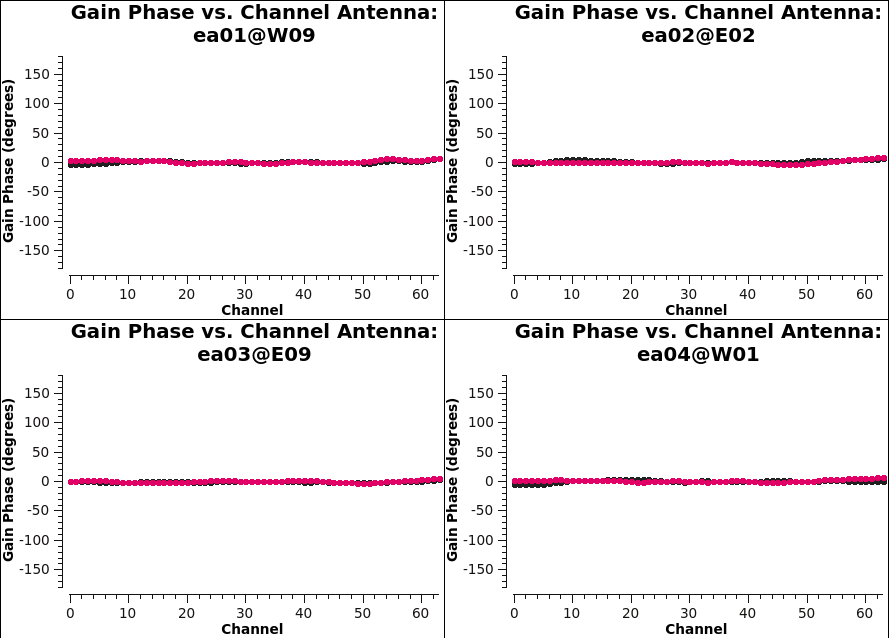
| 16:37, 27 November 2018 | Plotcal 3c391-G1-phase-pol-CASA5.4.0.png (file) |  |
52 KB | 1 | |
| 17:12, 4 June 2019 | Plotcal 3c391-G1-phase-pol-CASA5.5.0.png (file) |  |
47 KB | 1 | |
| 18:37, 23 September 2017 | Plotcal 3c391-G1-phase-rat-5.0.png (file) |  |
32 KB | 1 | |
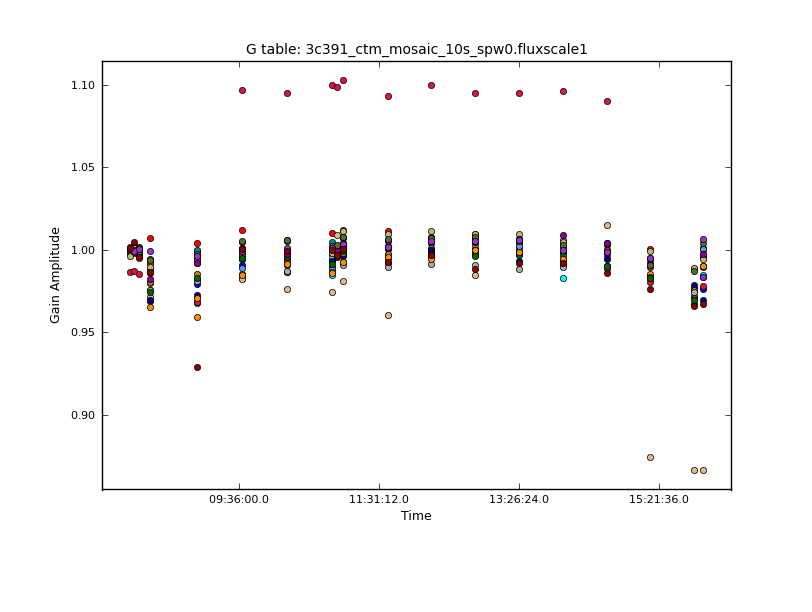
| 19:15, 23 September 2017 | Plotcal 3c391-fluxscale1-amp-L-5.0.png (file) |  |
34 KB | 1 | |
| 19:14, 23 September 2017 | Plotcal 3c391-fluxscale1-amp-R-5.0.png (file) |  |
35 KB | 1 | |
| 15:46, 21 April 2016 | Plotms-3C286-Amp vs UVdist 4.6.jpeg (file) |  |
200 KB | 2 | |
| 20:19, 16 November 2018 | Plotms-3C286-B0-amp-CASA5.4.0.png (file) |  |
49 KB | 1 | |
| 20:20, 16 November 2018 | Plotms-3C286-B0-phase-CASA5.4.0.png (file) |  |
46 KB | 1 | |
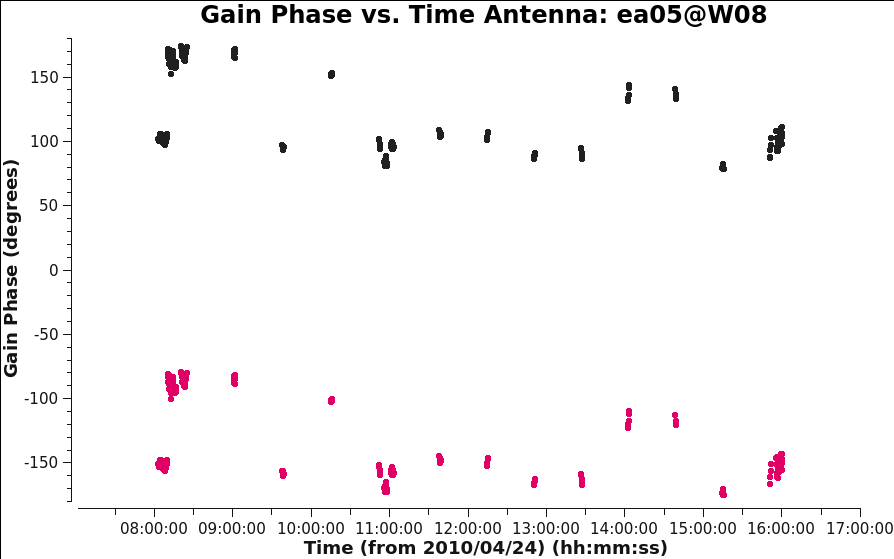
| 19:45, 16 November 2018 | Plotms-3C286-G0all-phase-ea05 CASA5.4.0.png (file) |  |
32 KB | Reverted to version as of 18:12, 16 November 2018 (EST) | 3 |
| 20:08, 16 November 2018 | Plotms-3C286-RRbandpass CASA5.4.0.png (file) |  |
26 KB | 1 | |
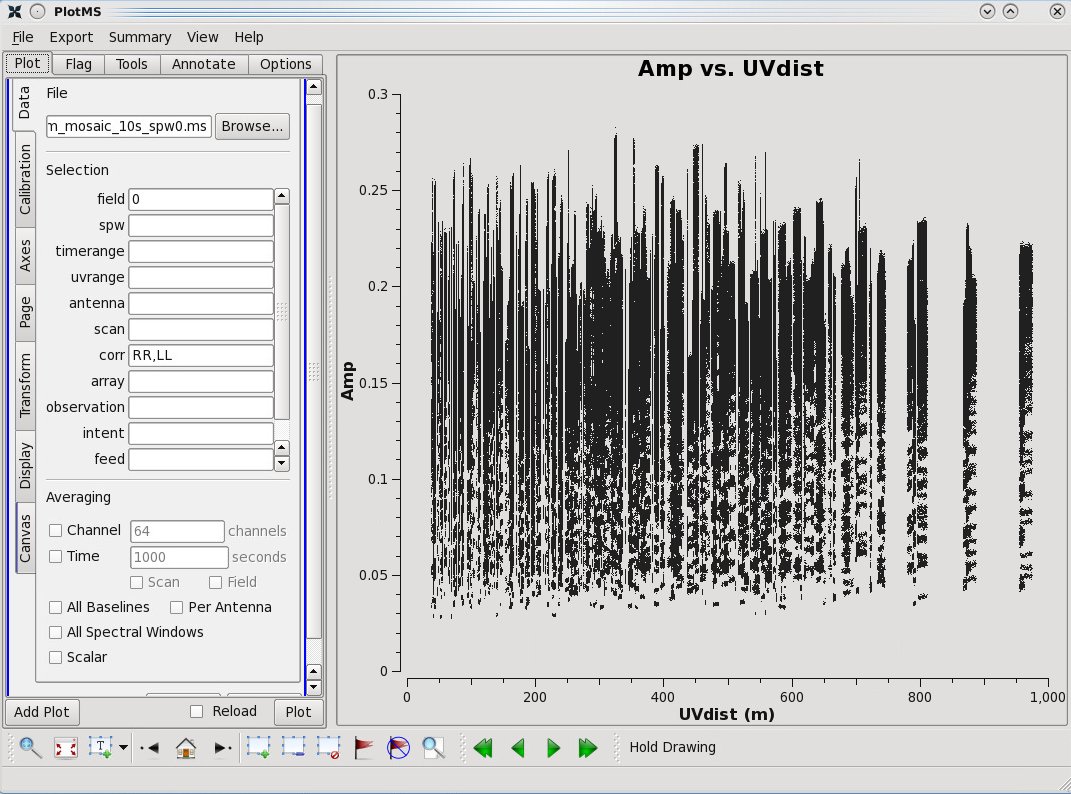
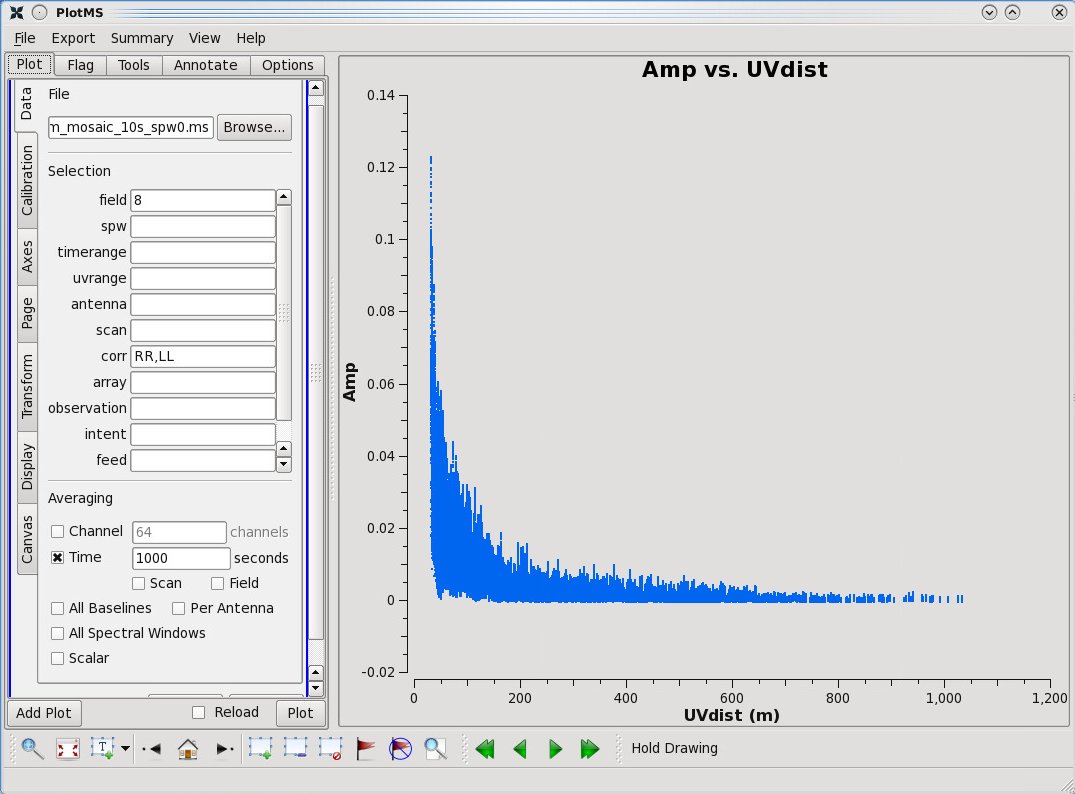
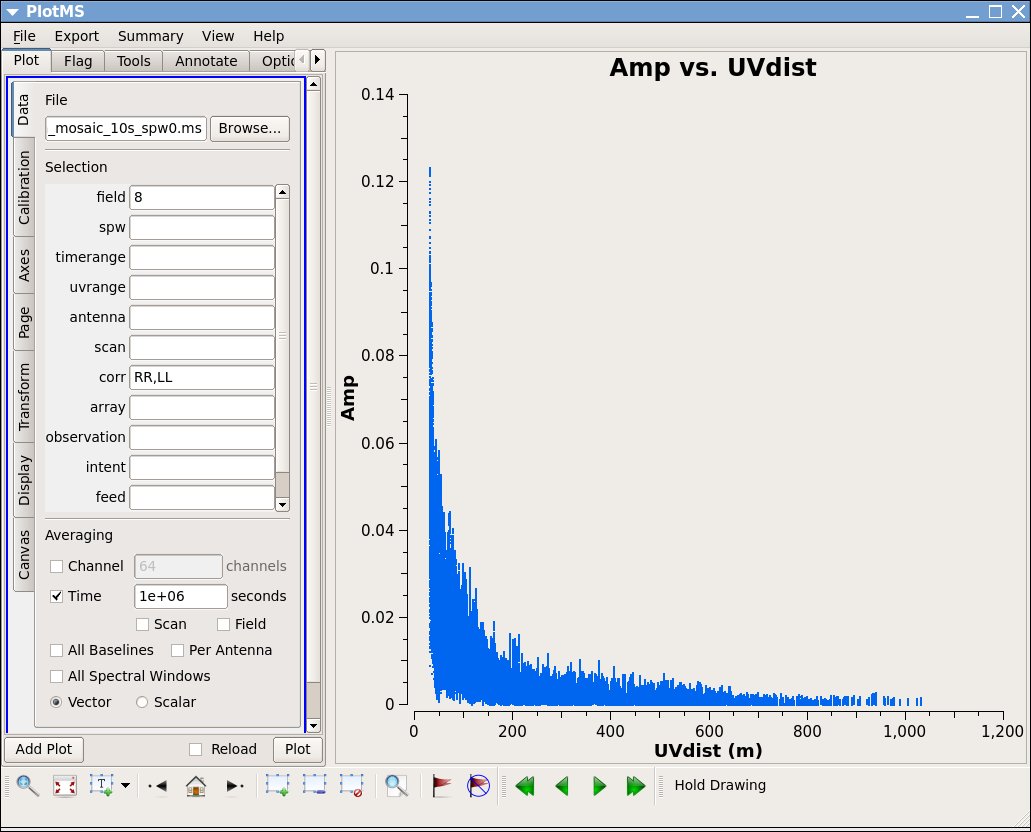
| 15:42, 21 April 2016 | Plotms-3C391-Amp vs UVdist 4.6.jpeg (file) |  |
113 KB | Amplitude vs UV distance for 3C391, a resolved source. Made in CASA version 4.6. | 1 |
| 17:48, 23 September 2017 | Plotms-3C391-Amp vs UVdist 5.0.jpeg (file) |  |
114 KB | 1 | |
| 17:50, 27 November 2018 | Plotms 3c391-D1-amp-ea01 CASA5.4.0.png (file) |  |
28 KB | 1 |