Uploads by Jsalcido
From CASA Guides
Jump to navigationJump to search
This special page shows all uploaded files.
| Date | Name | Thumbnail | Size | Description | Versions |
|---|---|---|---|---|---|
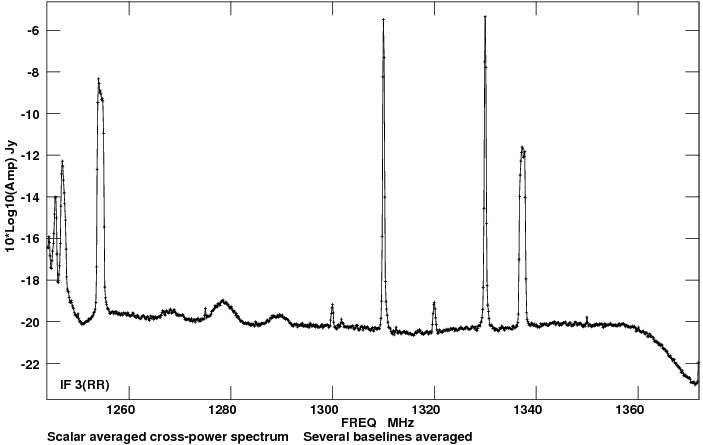
| 13:19, 18 October 2016 | RFI 1244-1372.png (file) |  |
14 KB | 1 | |
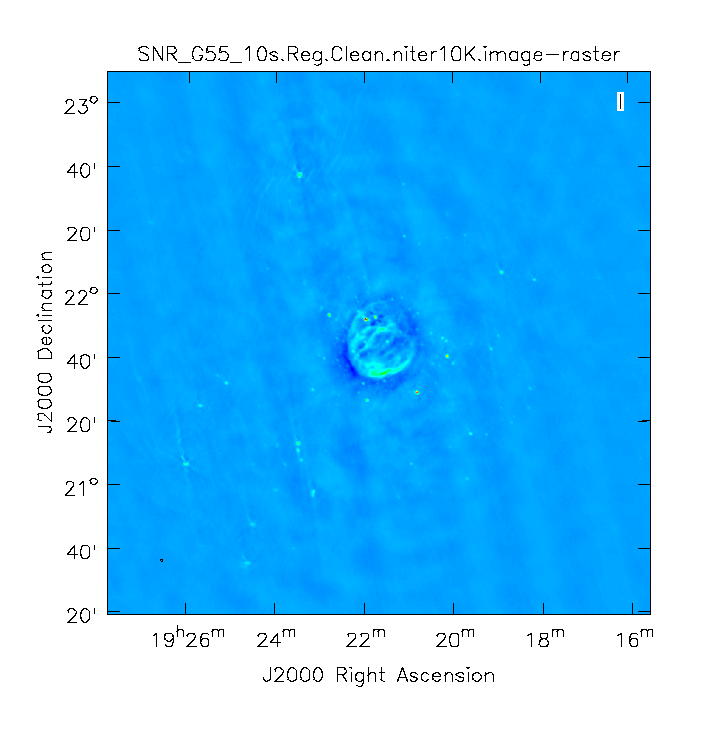
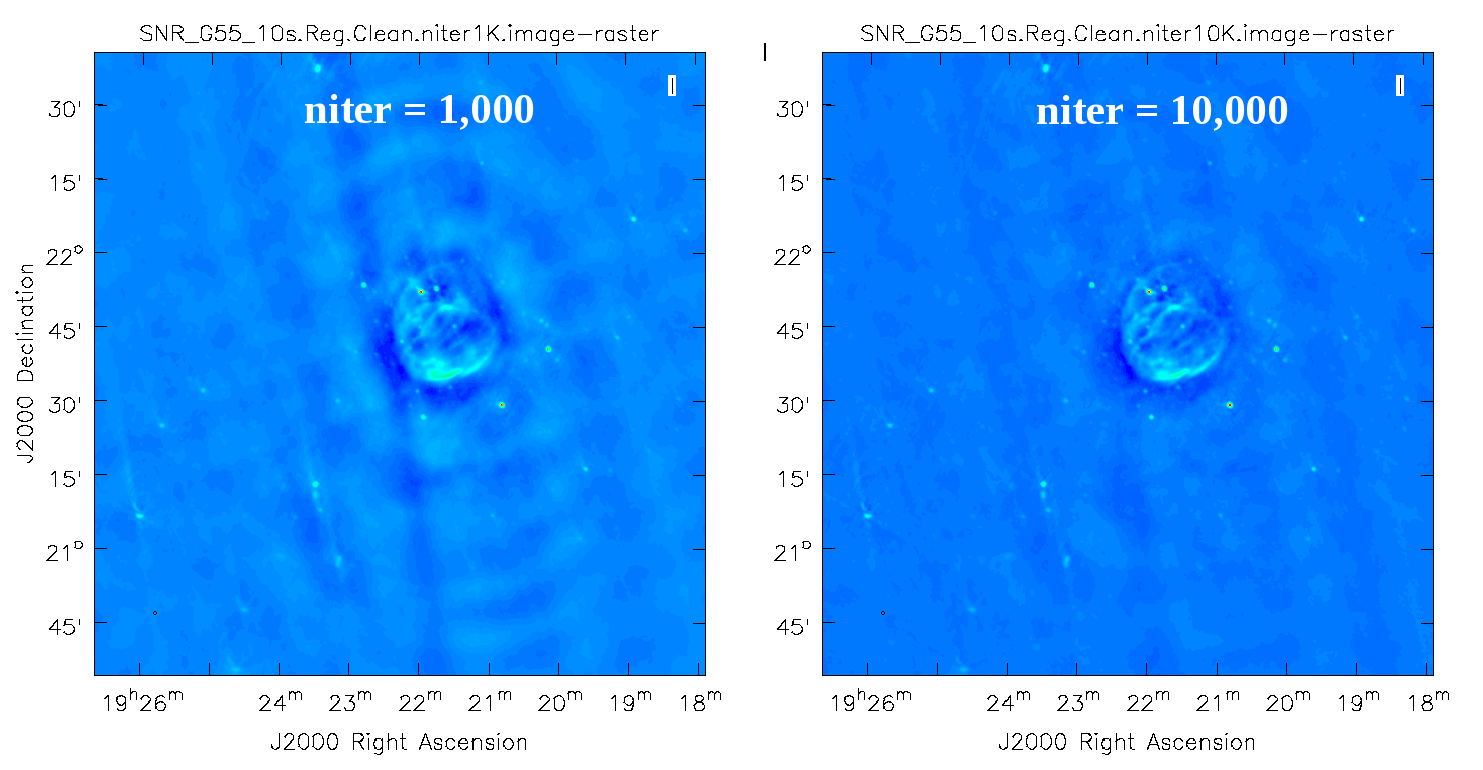
| 15:42, 9 June 2016 | SNR G55 10s.niter.10K 4.6.png (file) |  |
85 KB | 1 | |
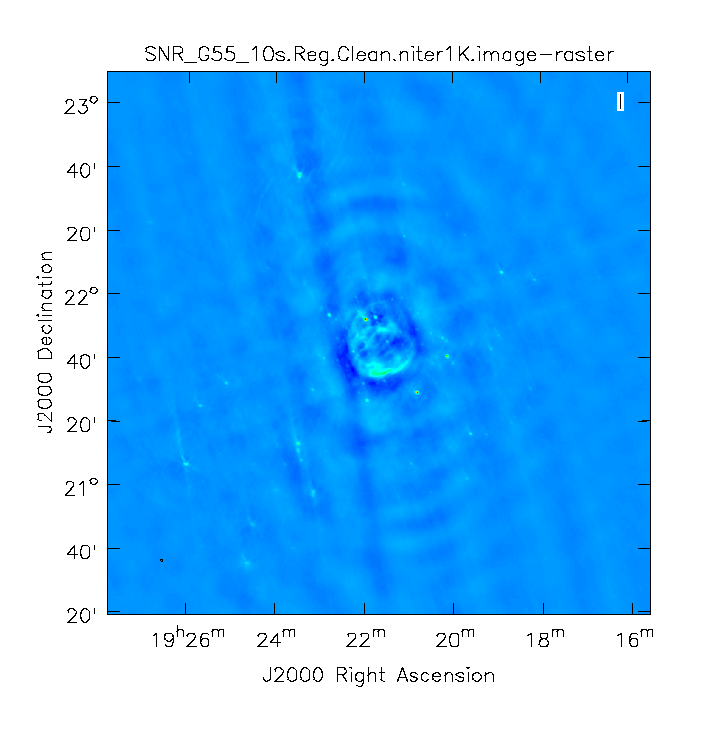
| 15:42, 9 June 2016 | SNR G55 10s.niter.1K 4.6.png (file) |  |
84 KB | 1 | |
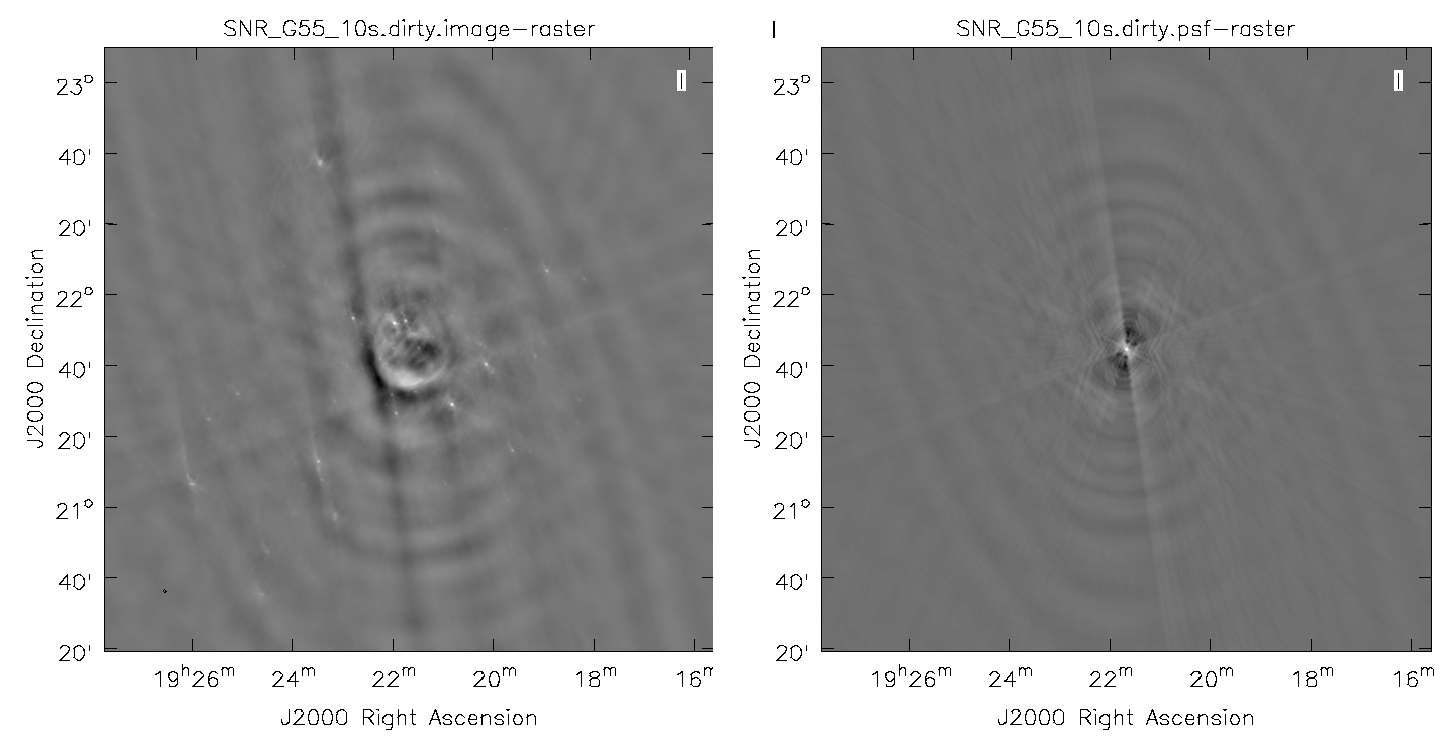
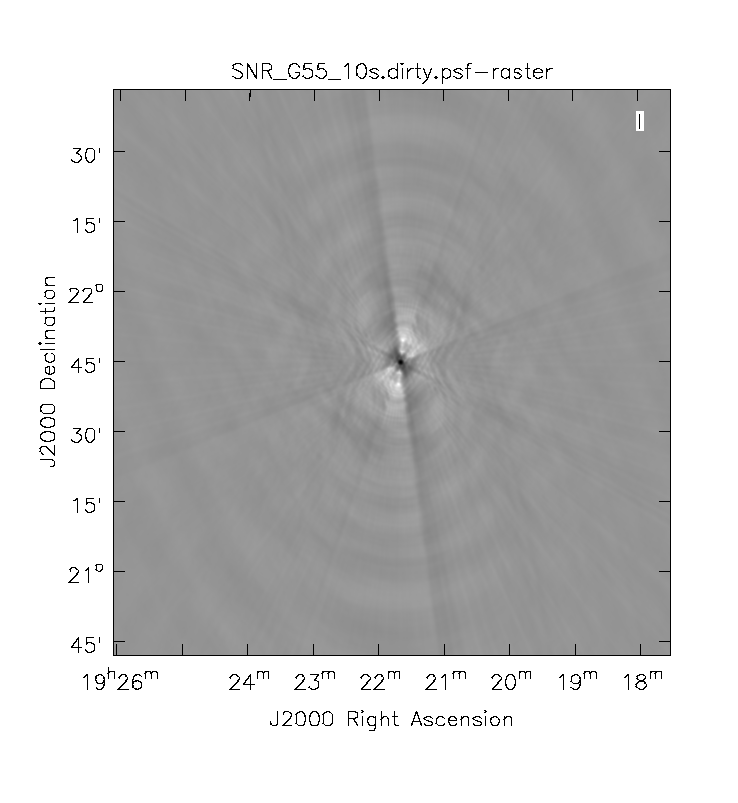
| 13:39, 9 June 2016 | SNR G55 10s.dirty.psf 4.6.png (file) |  |
91 KB | 1 | |
| 13:38, 9 June 2016 | SNR G55 10s.dirty.image 4.6.png (file) |  |
102 KB | 1 | |
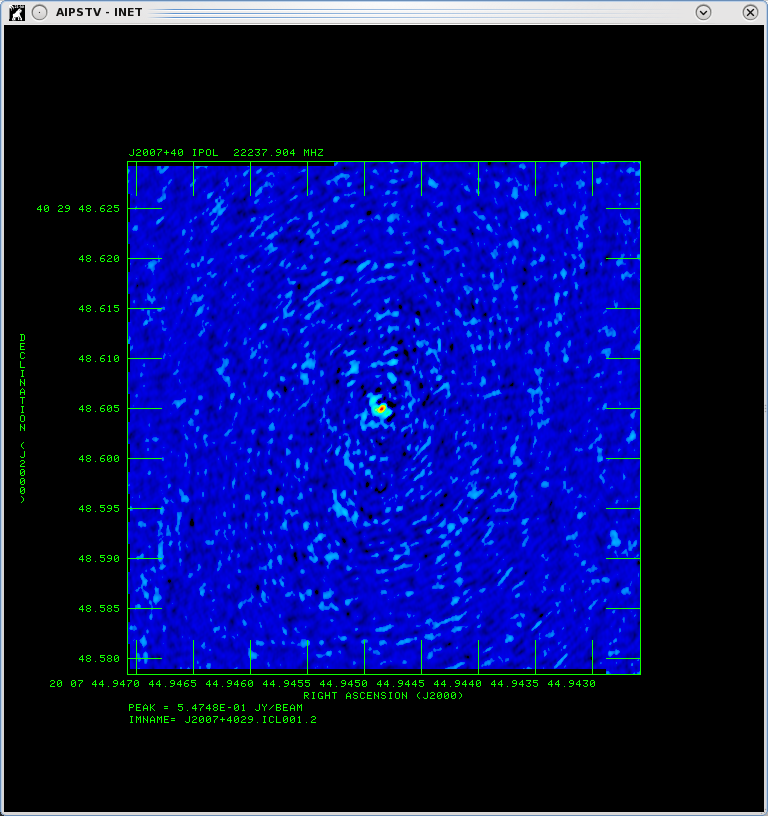
| 10:43, 6 June 2016 | IMAGEJ2007before1.png (file) |  |
278 KB | 1 | |
| 10:42, 6 June 2016 | IMAGEJ2007after1.png (file) |  |
270 KB | 1 | |
| 20:48, 3 June 2016 | POSSMbefore afterDELZN.png (file) |  |
330 KB | 1 | |
| 19:30, 2 June 2016 | IMAGEJ2007before.png (file) |  |
278 KB | 1 | |
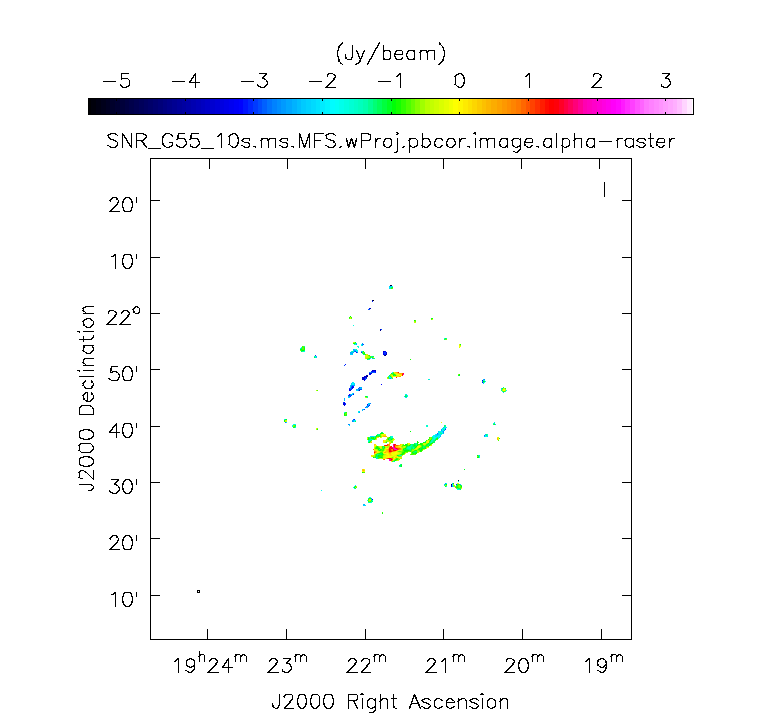
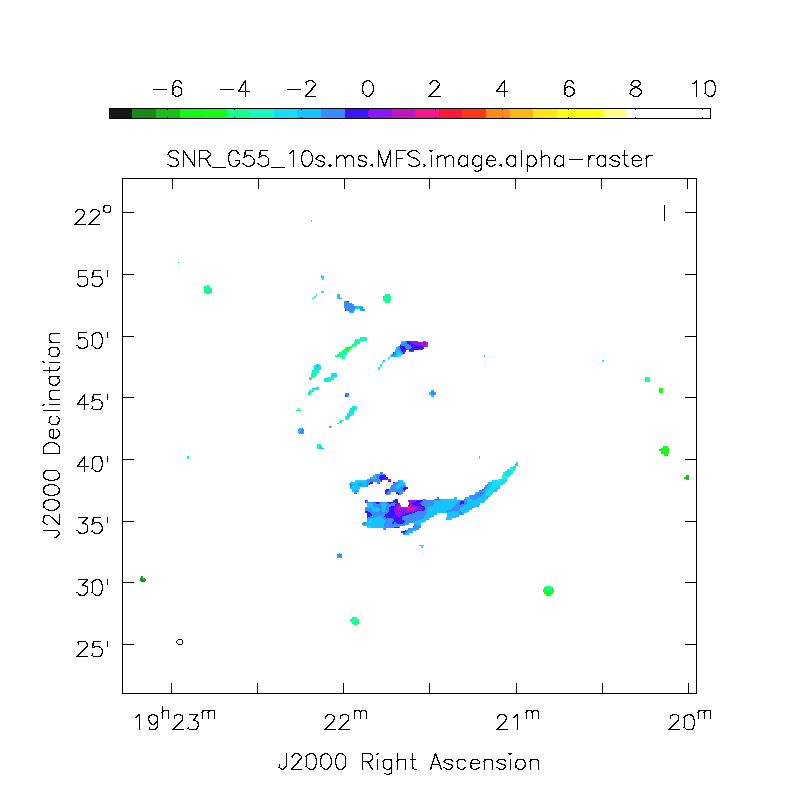
| 17:46, 3 May 2016 | SNR G55 10s.MS.MFS.wProj.pbcor.image.alpha.png (file) |  |
15 KB | 1 | |
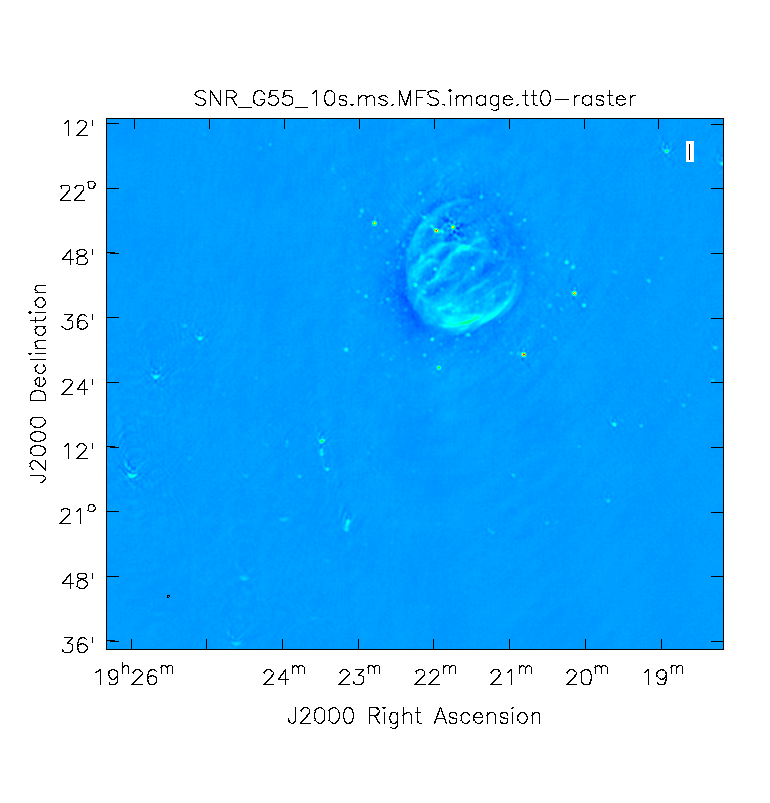
| 12:13, 25 April 2016 | SNR G55 10s.ms.MFS.image.png (file) |  |
113 KB | 1 | |
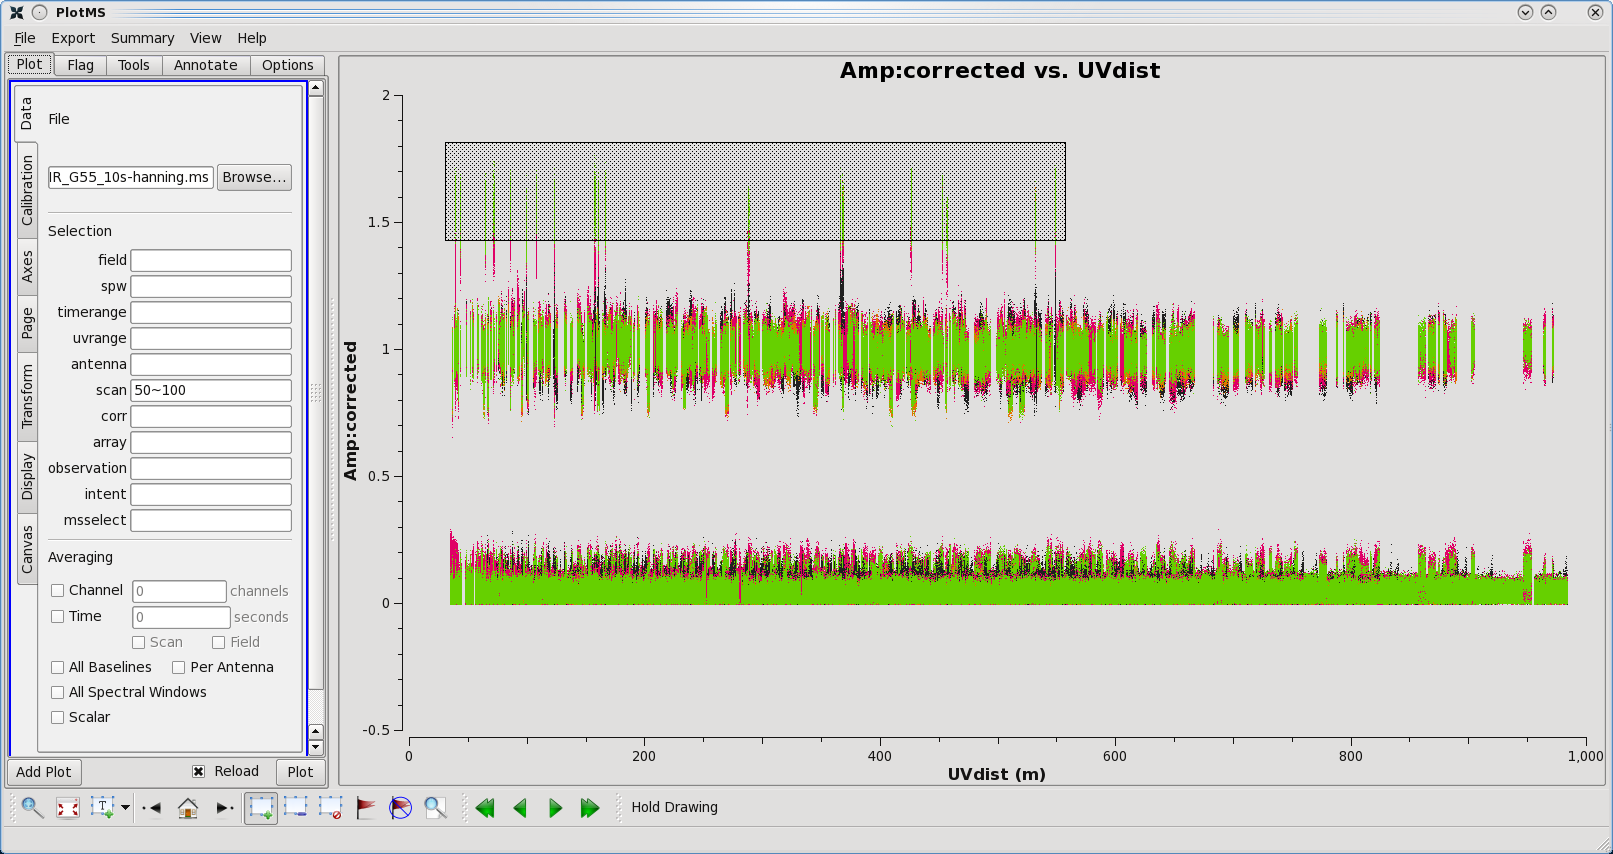
| 15:23, 22 April 2016 | Corr.Amp vs UVdist.flagged.png (file) |  |
174 KB | 1 | |
| 13:47, 22 April 2016 | Corr.Amp vs UVdist.png (file) |  |
151 KB | 1 | |
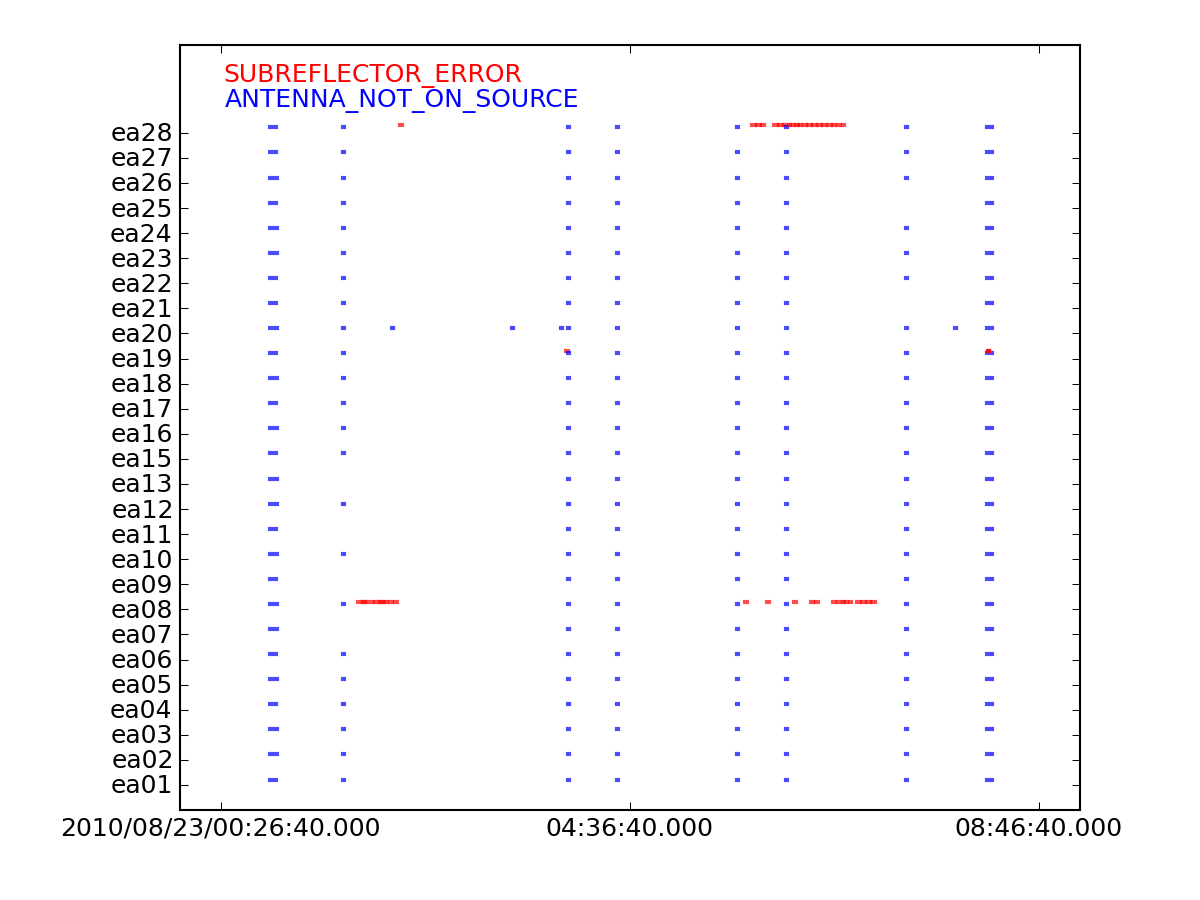
| 12:53, 22 April 2016 | Flaggingreason vs time.png (file) |  |
78 KB | 2 | |
| 18:51, 21 April 2016 | Total Flagged plots.png (file) | 131 KB | 3 | ||
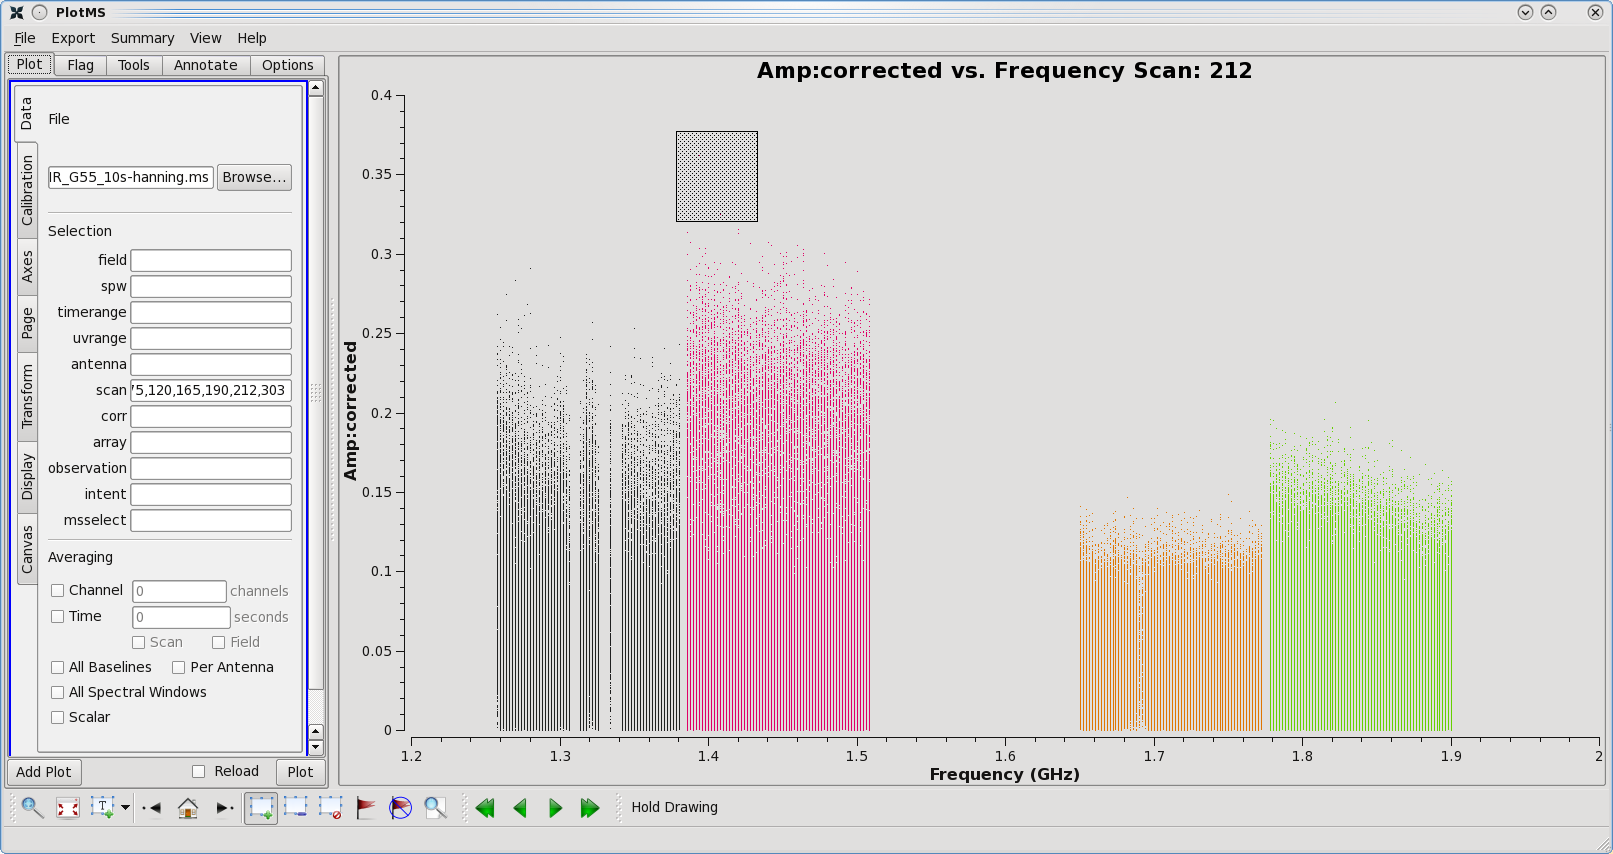
| 18:43, 21 April 2016 | Corr.amp v freq.interactive flagging.png (file) |  |
115 KB | 2 | |
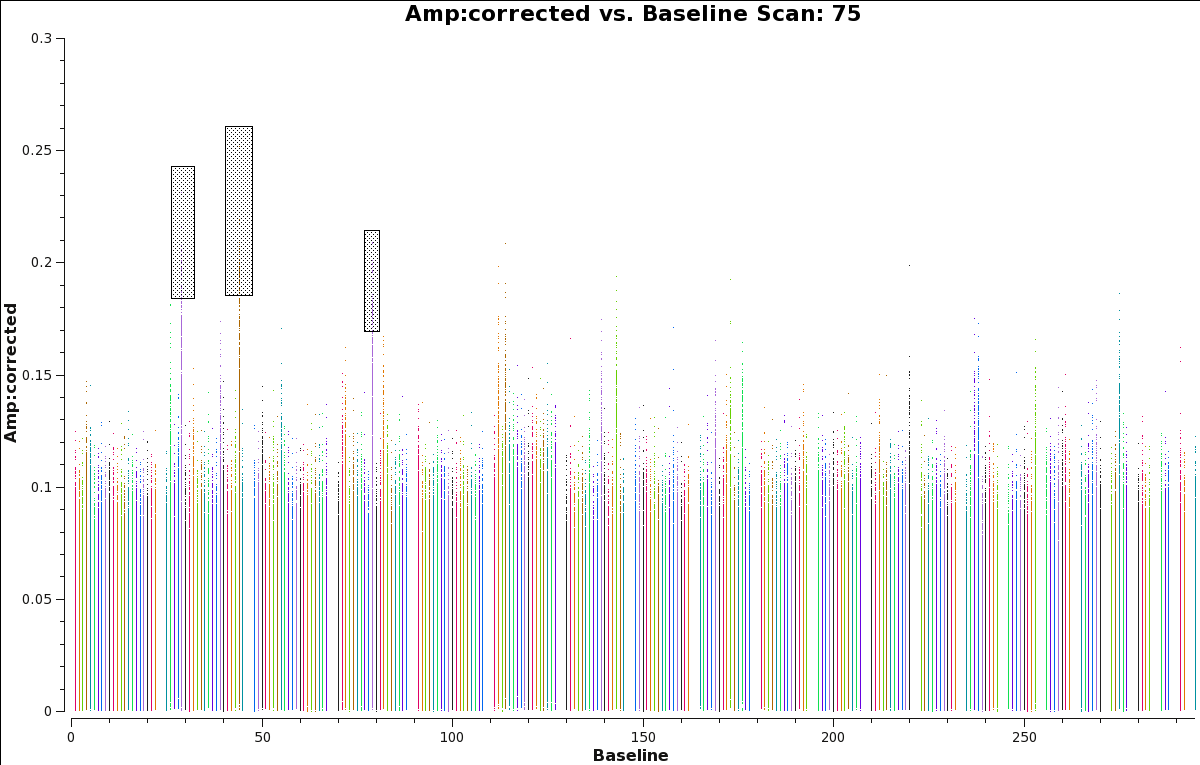
| 18:25, 21 April 2016 | Corr.amp vs baseline scan75.png (file) |  |
39 KB | 1 | |
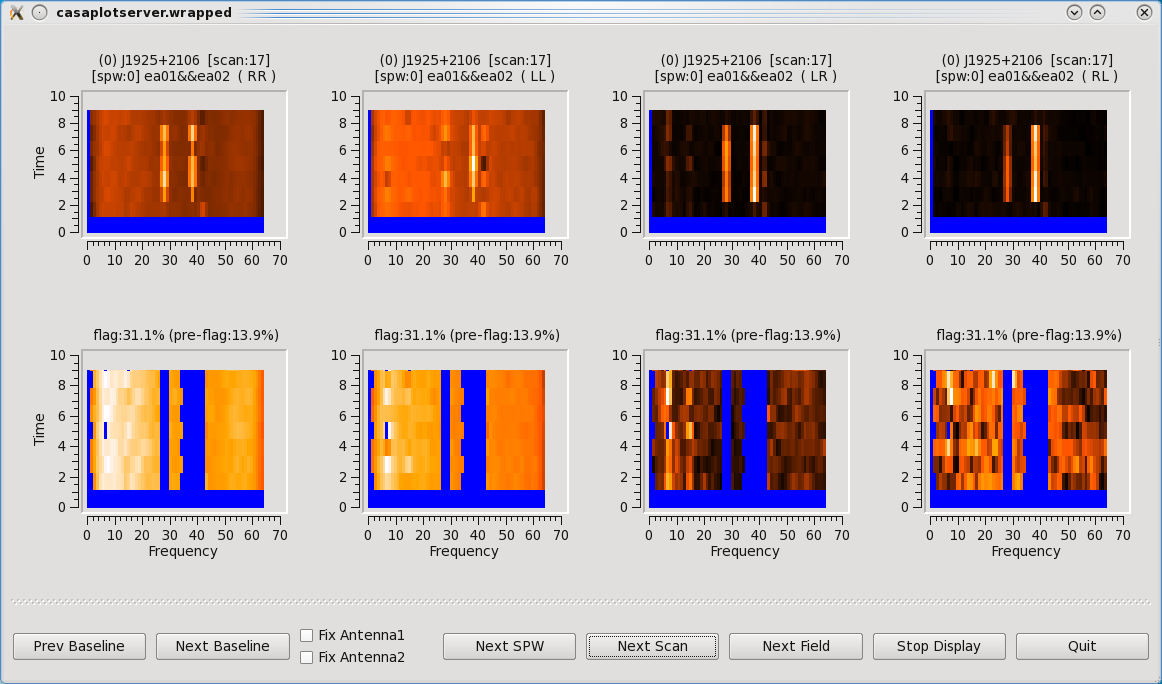
| 17:46, 21 April 2016 | Rflag freq2.5 time3.5.png (file) |  |
56 KB | 1 | |
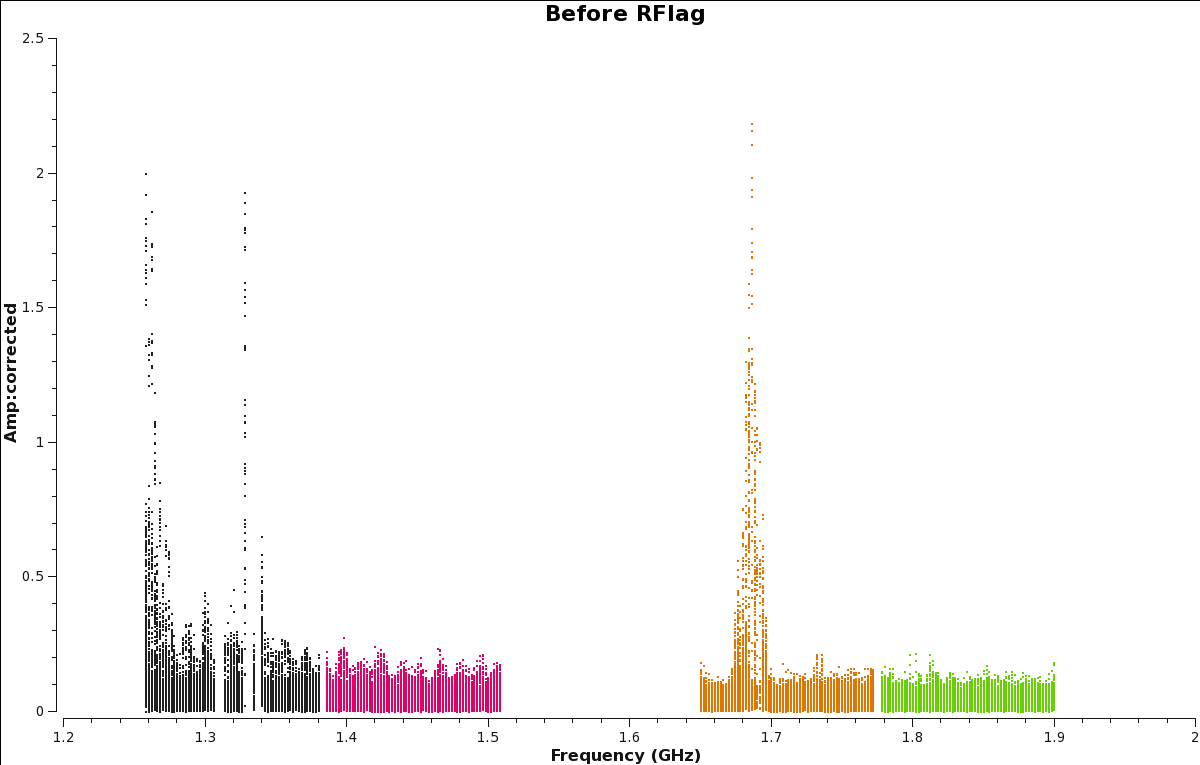
| 17:34, 21 April 2016 | Amp v freq.beforeRFlag.png (file) |  |
24 KB | 1 | |
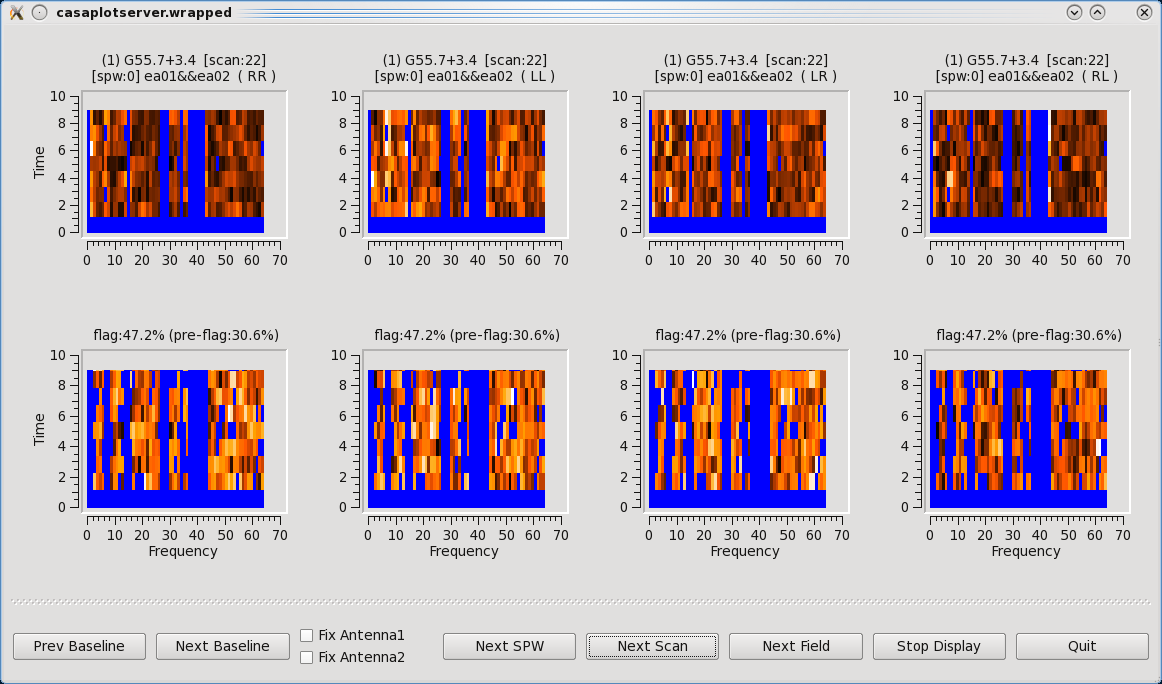
| 13:25, 21 April 2016 | Tfcrop.png (file) |  |
54 KB | 2 | |
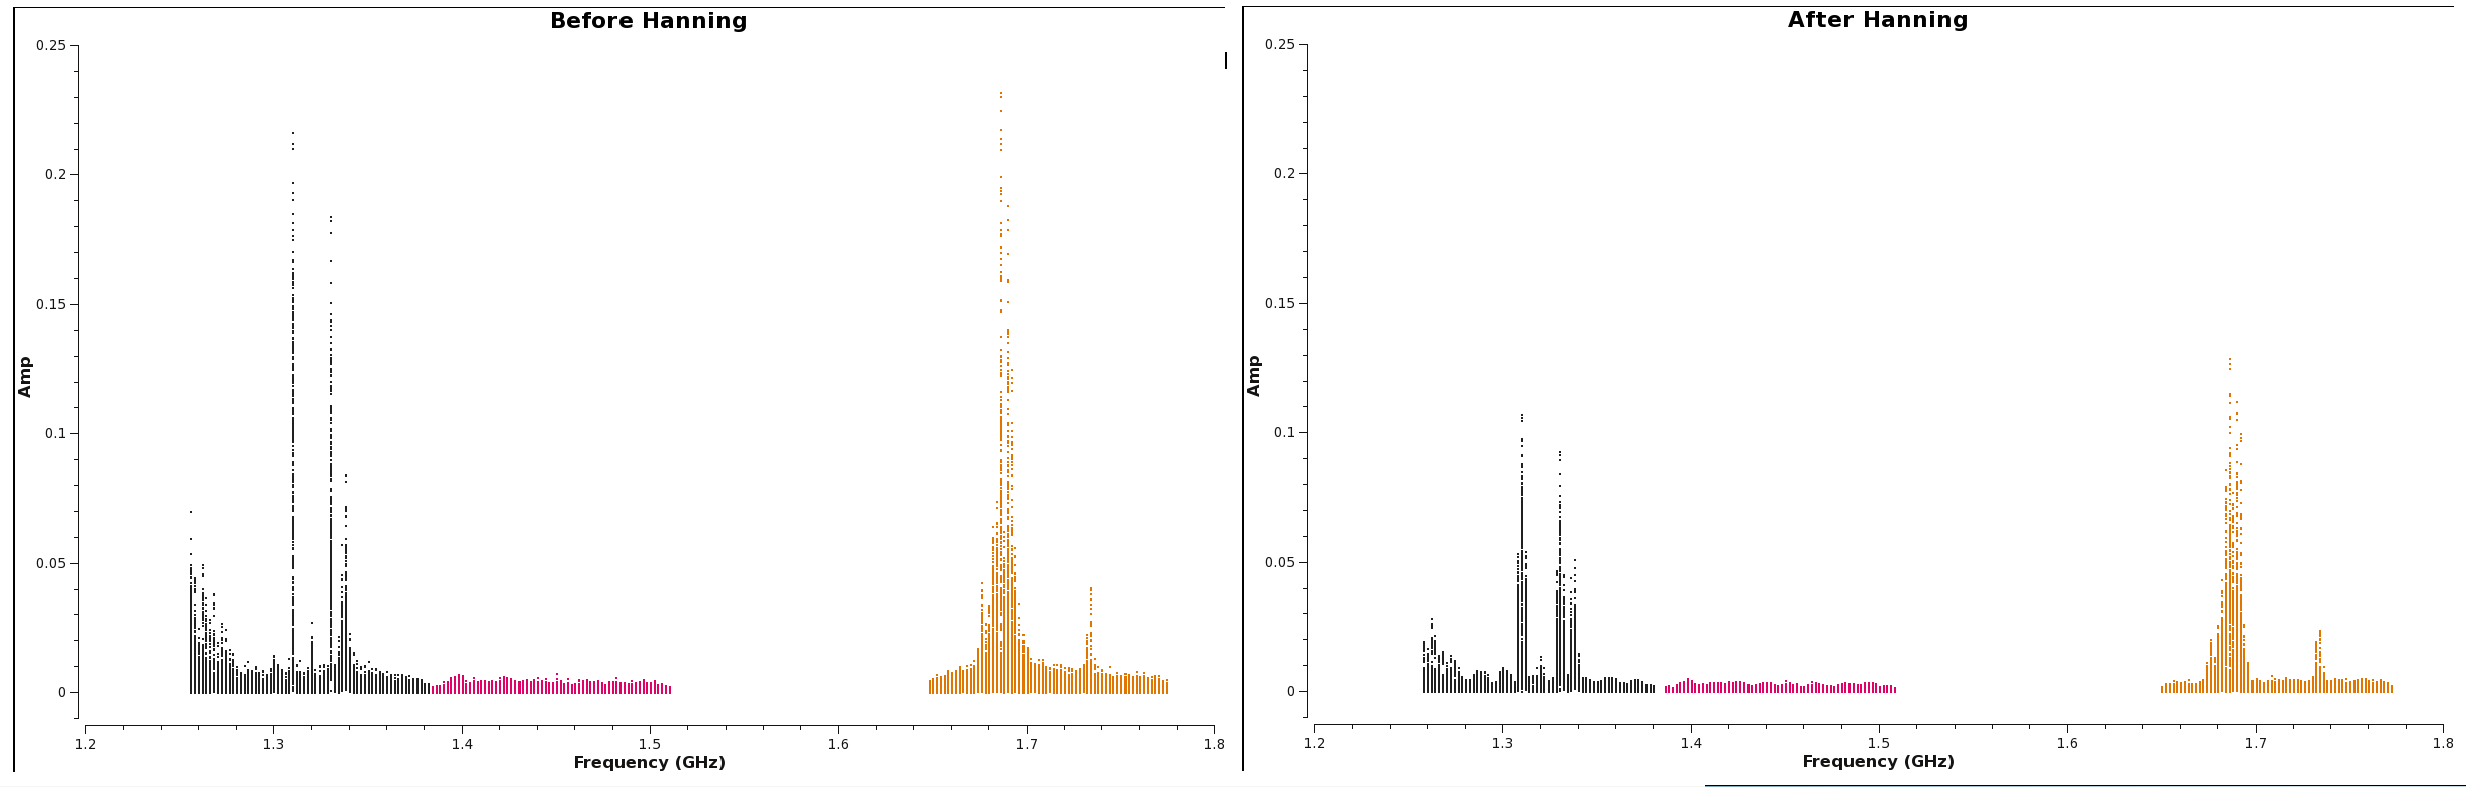
| 12:02, 21 April 2016 | Amp v freq before after hanning.png (file) |  |
29 KB | 2 | |
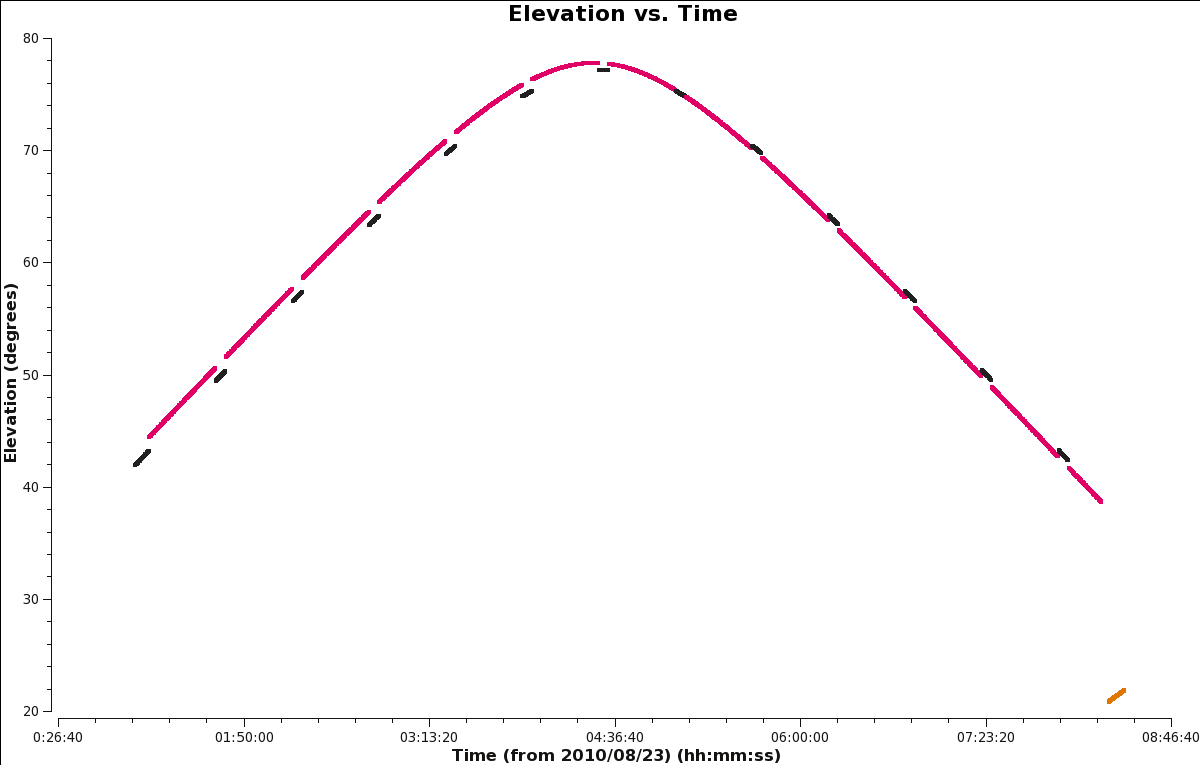
| 11:58, 21 April 2016 | Elevation vs Time.png (file) |  |
26 KB | 3 | |
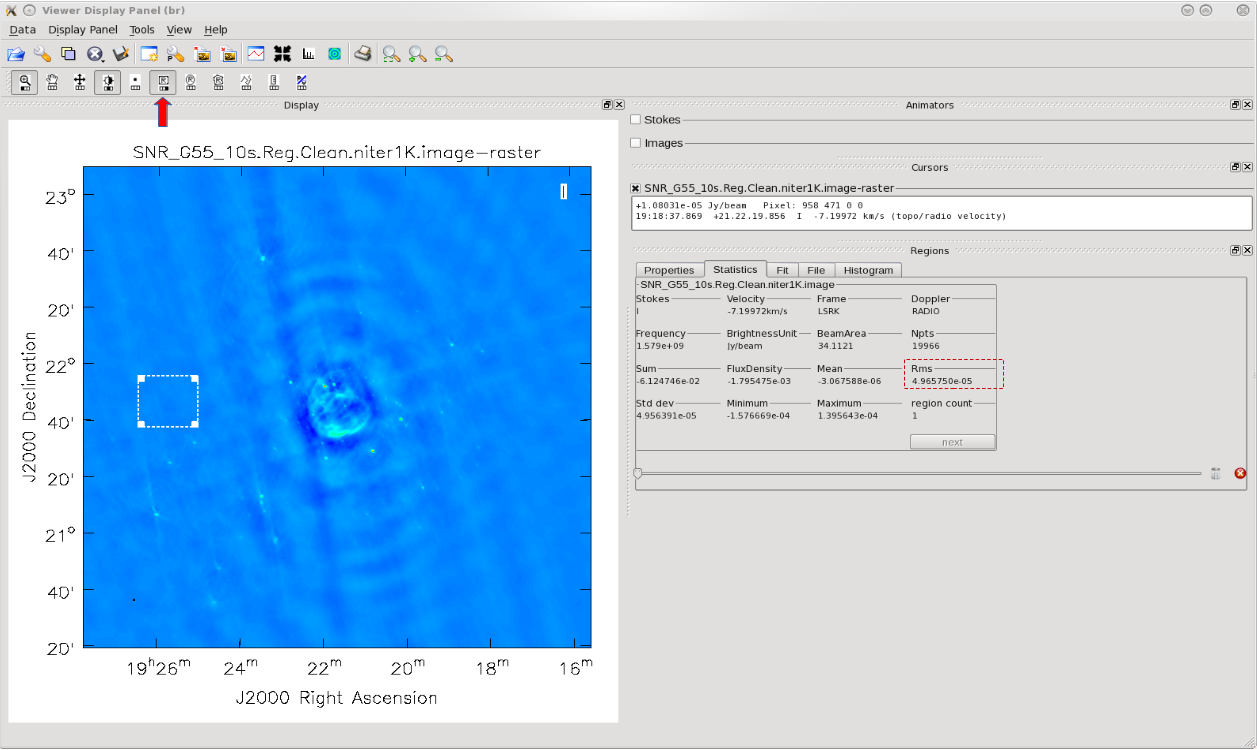
| 17:24, 19 April 2016 | SNR G55 10s.rms.screen.png (file) |  |
244 KB | 2 | |
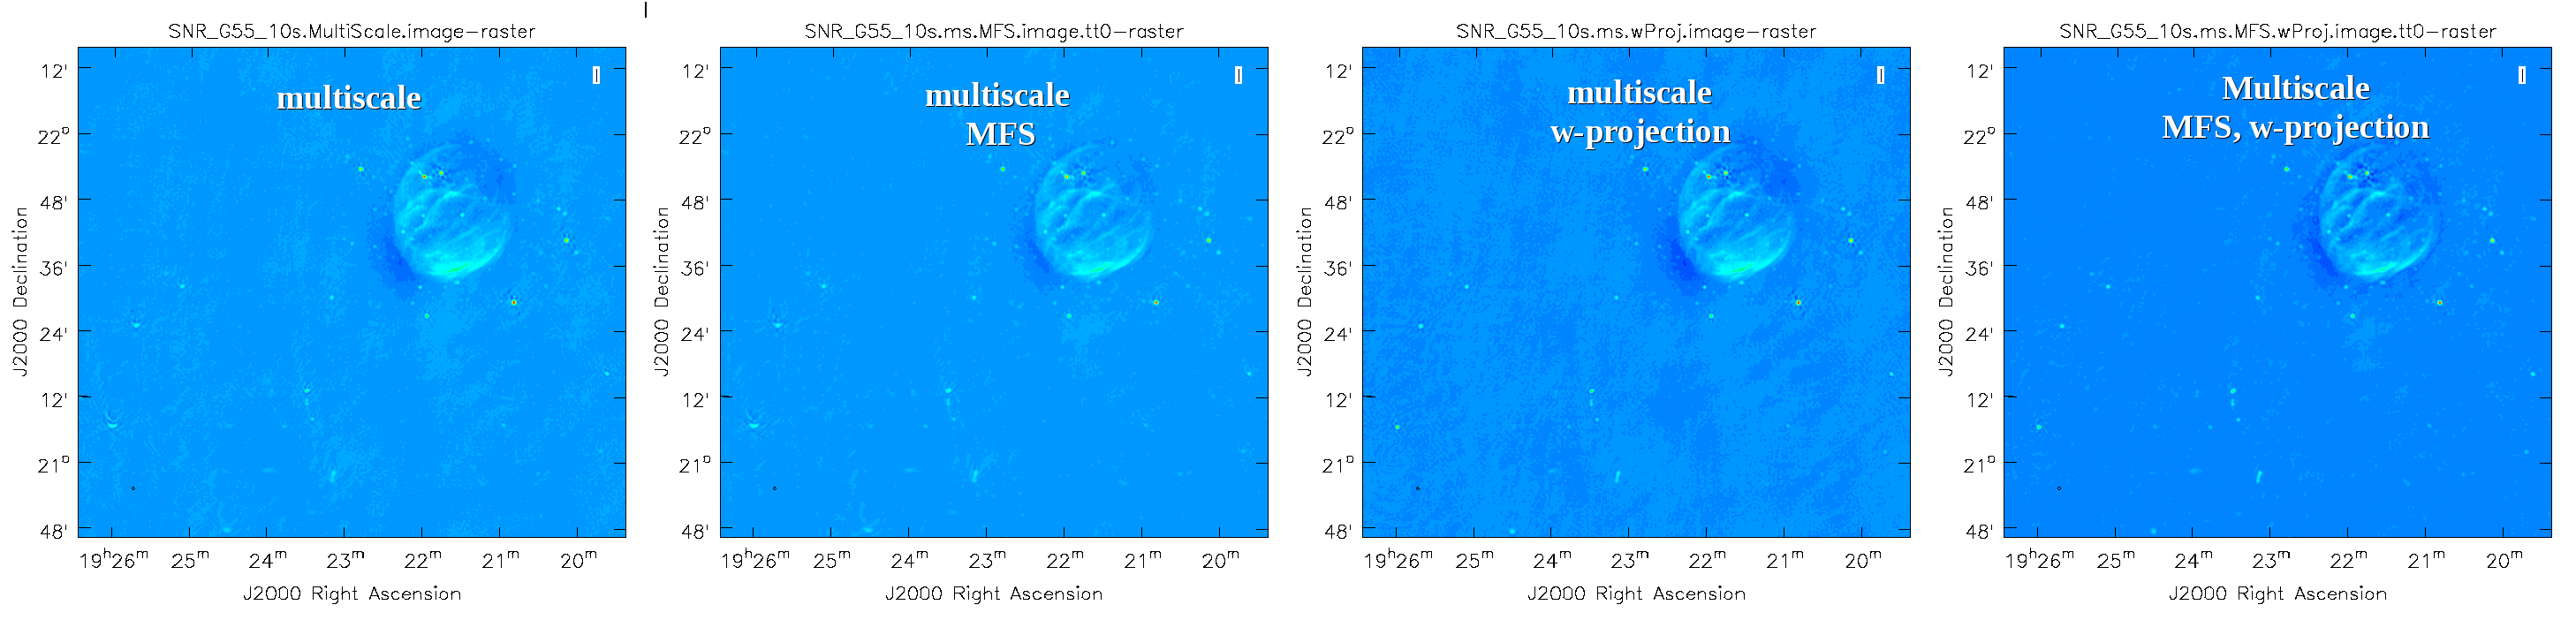
| 17:03, 19 April 2016 | SNR G55 MS.MFS.wProj.png (file) | 222 KB | 2 | ||
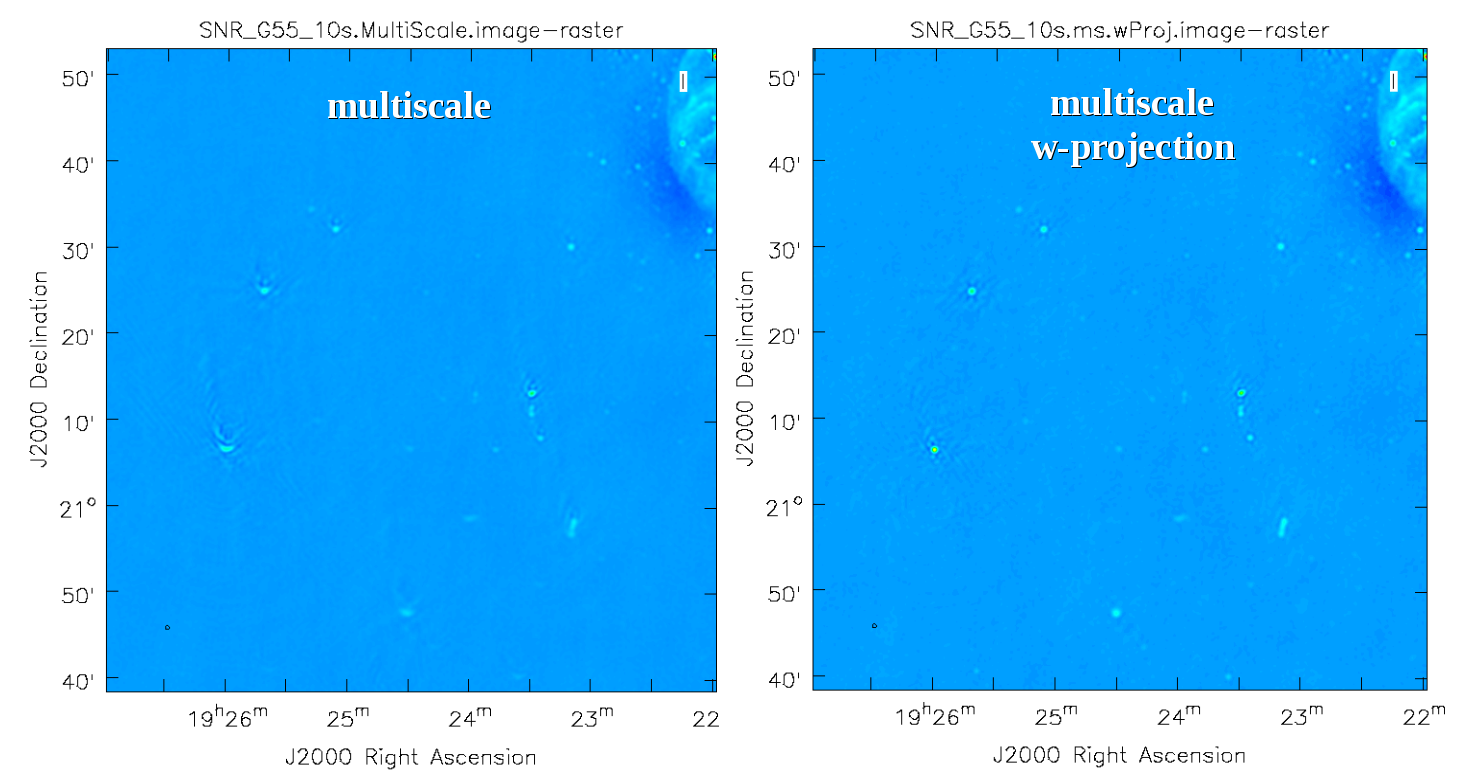
| 16:40, 19 April 2016 | SNR G55 MS vs MS.wProj.png (file) |  |
324 KB | 1 | |
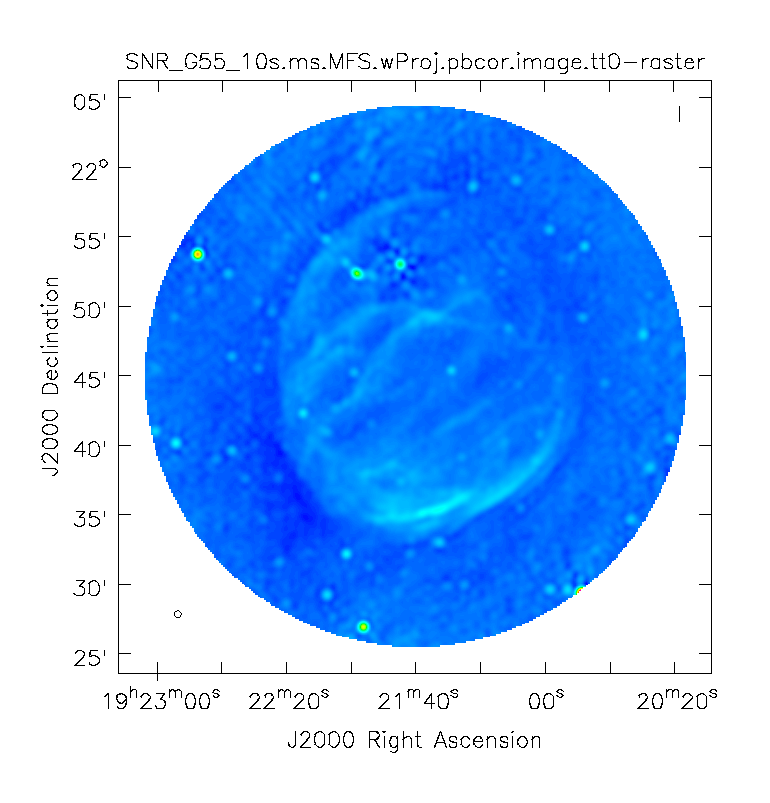
| 15:21, 19 April 2016 | SNR G55 10s.MS.MFS.wProj.pbcor.image.png (file) |  |
88 KB | 2 | |
| 11:37, 19 April 2016 | SNR G55 10s.niter.1K vs 10K.png (file) |  |
116 KB | 1 | |
| 11:36, 19 April 2016 | SNR G55 10s.niter.500 vs 10K.png (file) |  |
116 KB | 2 | |
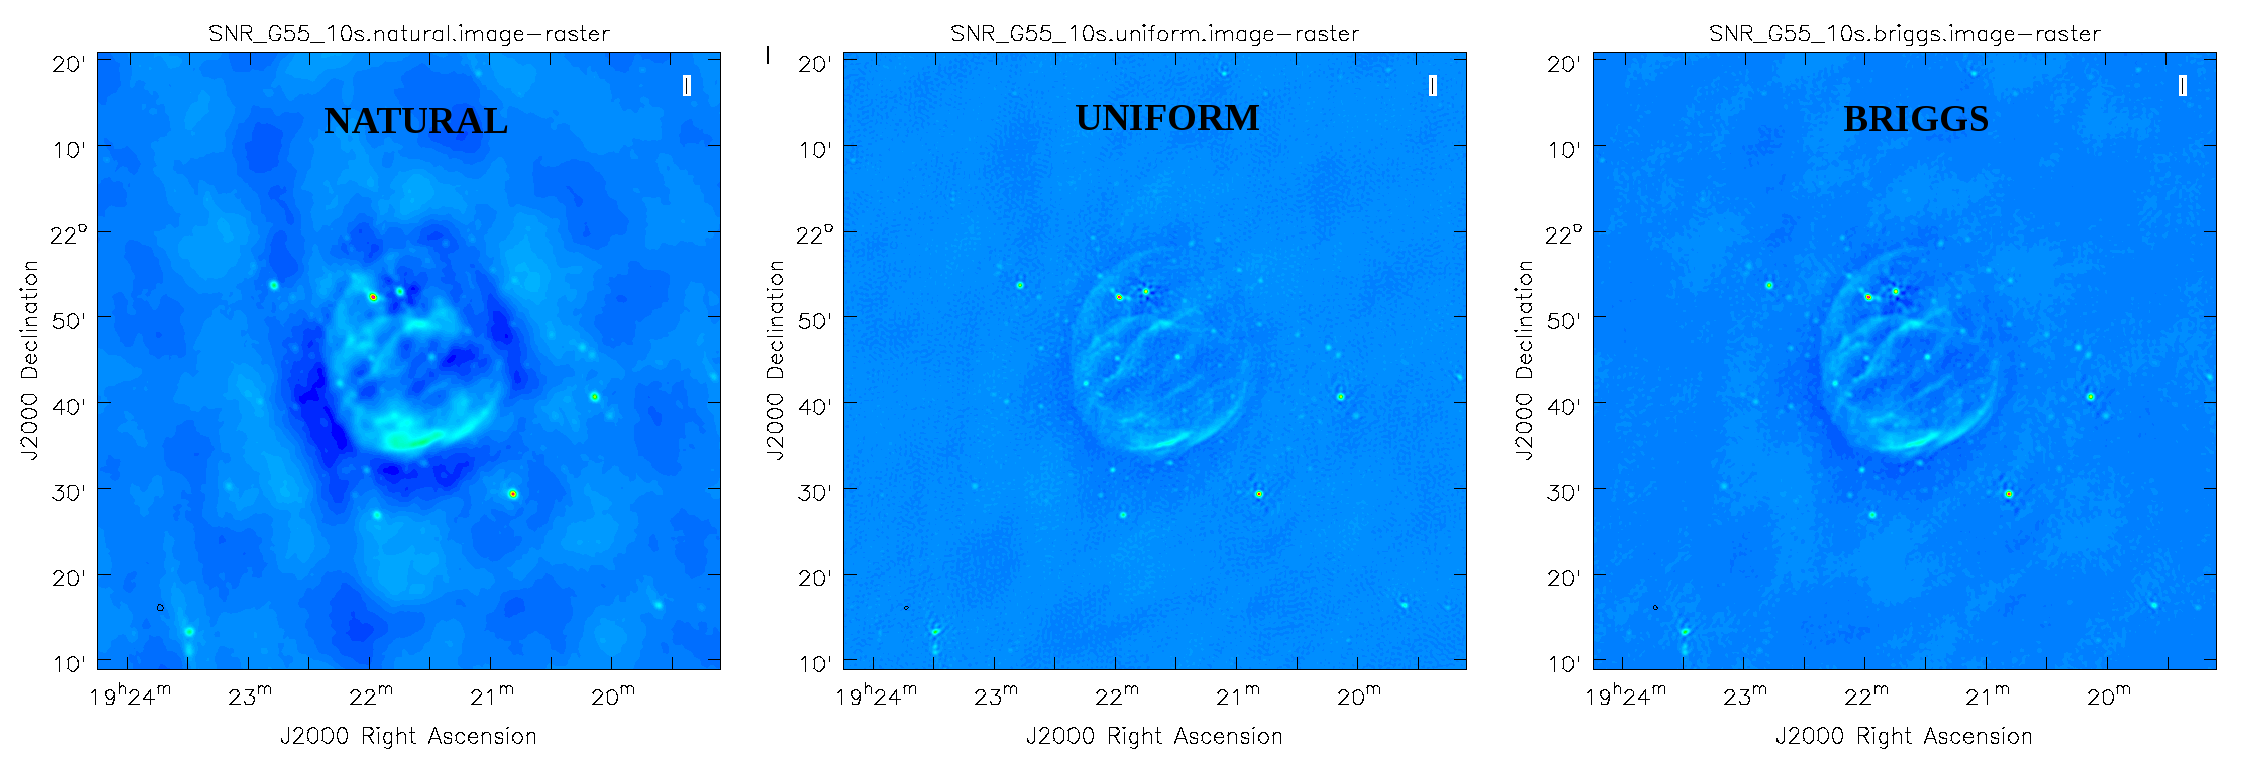
| 17:32, 18 April 2016 | SNR G55 11s.nat.uni.briggs.png (file) |  |
193 KB | 1 | |
| 12:16, 18 April 2016 | SN G55 10s.dirty.image.psf.png (file) |  |
215 KB | 3 | |
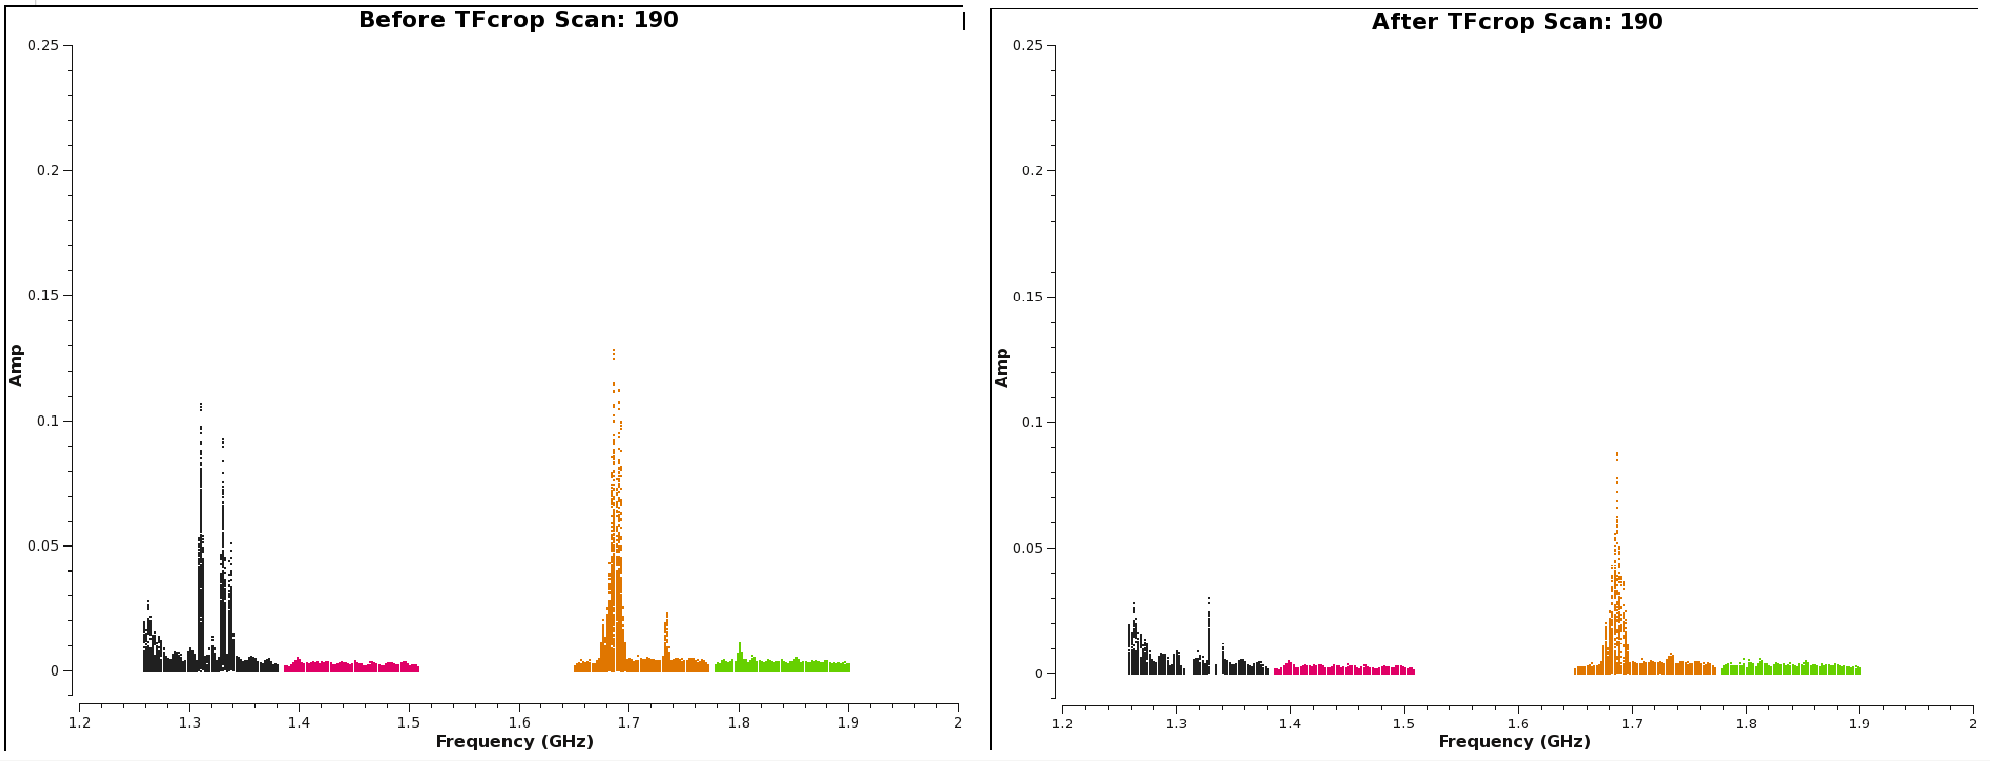
| 17:25, 15 April 2016 | Amp v freq before after tfcrop scan190.png (file) |  |
28 KB | 1 | |
| 19:21, 13 April 2016 | Amp v freq before after tfcrop scan190.gif (file) |  |
24 KB | 3 | |
| 16:55, 12 April 2016 | Flagged Perc perAnt RFI.png (file) |  |
41 KB | 1 | |
| 16:55, 12 April 2016 | Flagged Perc perSpw RFI.png (file) |  |
37 KB | 1 | |
| 12:18, 12 April 2016 | SN G55 10s.dirty.image.PSF.png (file) |  |
100 KB | 1 | |
| 18:21, 8 April 2016 | SNR.G55.images.gif (file) |  |
129 KB | 1 | |
| 16:45, 8 April 2016 | SN G55 MS.to.MS wProj.gif (file) |  |
119 KB | 1 | |
| 16:33, 8 April 2016 | SN G55 MultiScale.artifacts.png (file) |  |
99 KB | 4 | |
| 16:10, 8 April 2016 | Amp v freq.before after RFlag.gif (file) |  |
29 KB | 1 | |
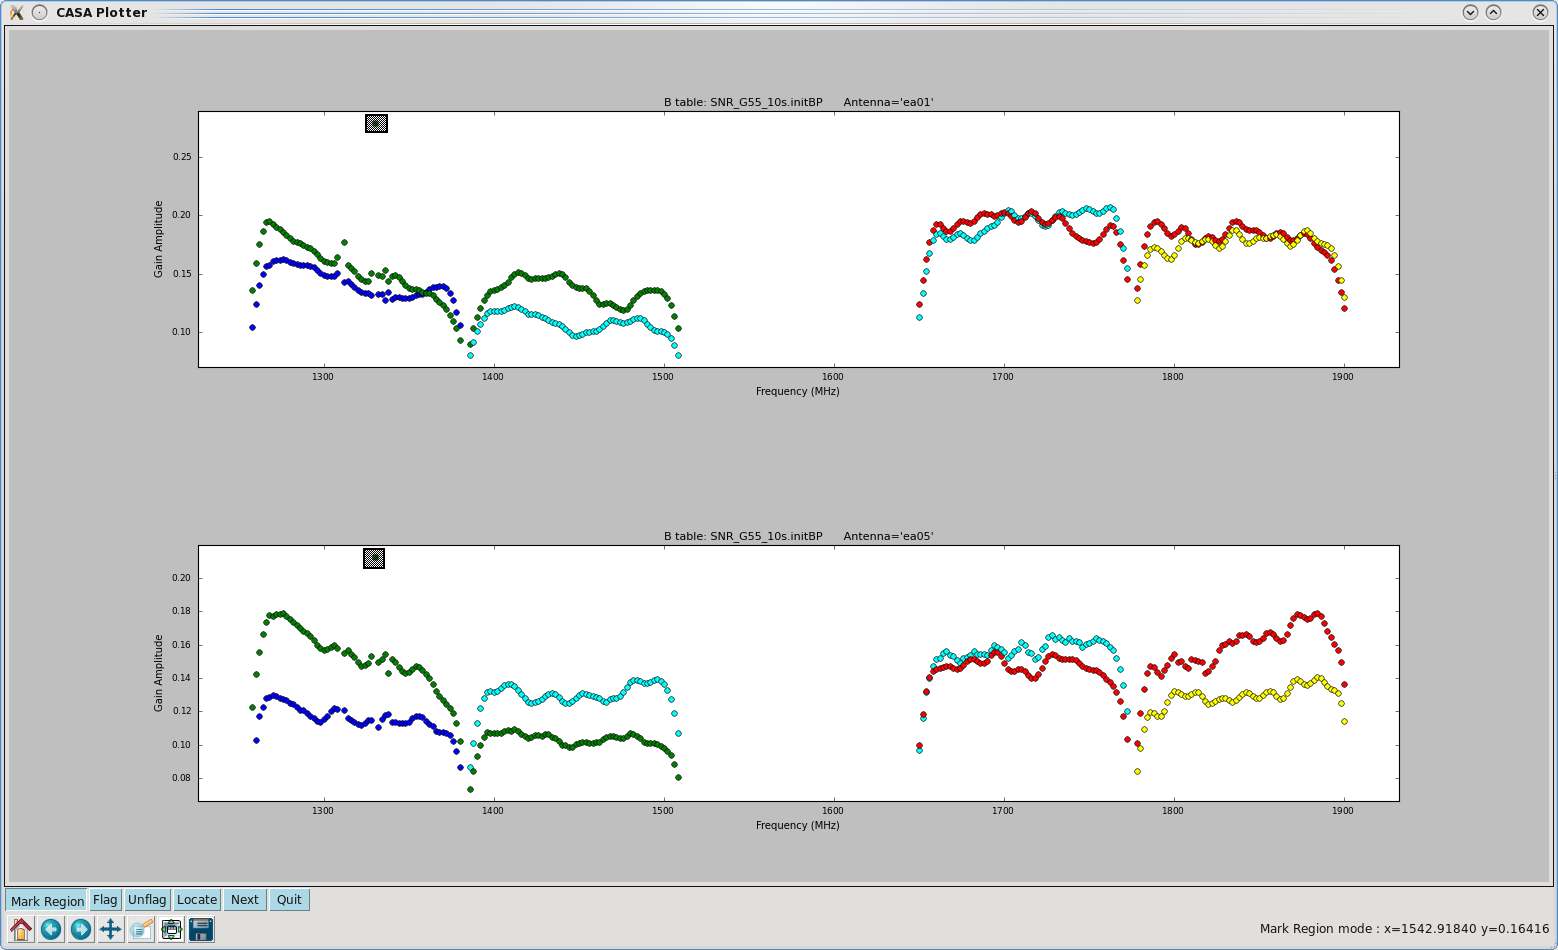
| 13:48, 8 April 2016 | Plotcal ea01ea05 interactive flagging.png (file) |  |
102 KB | 1 | |
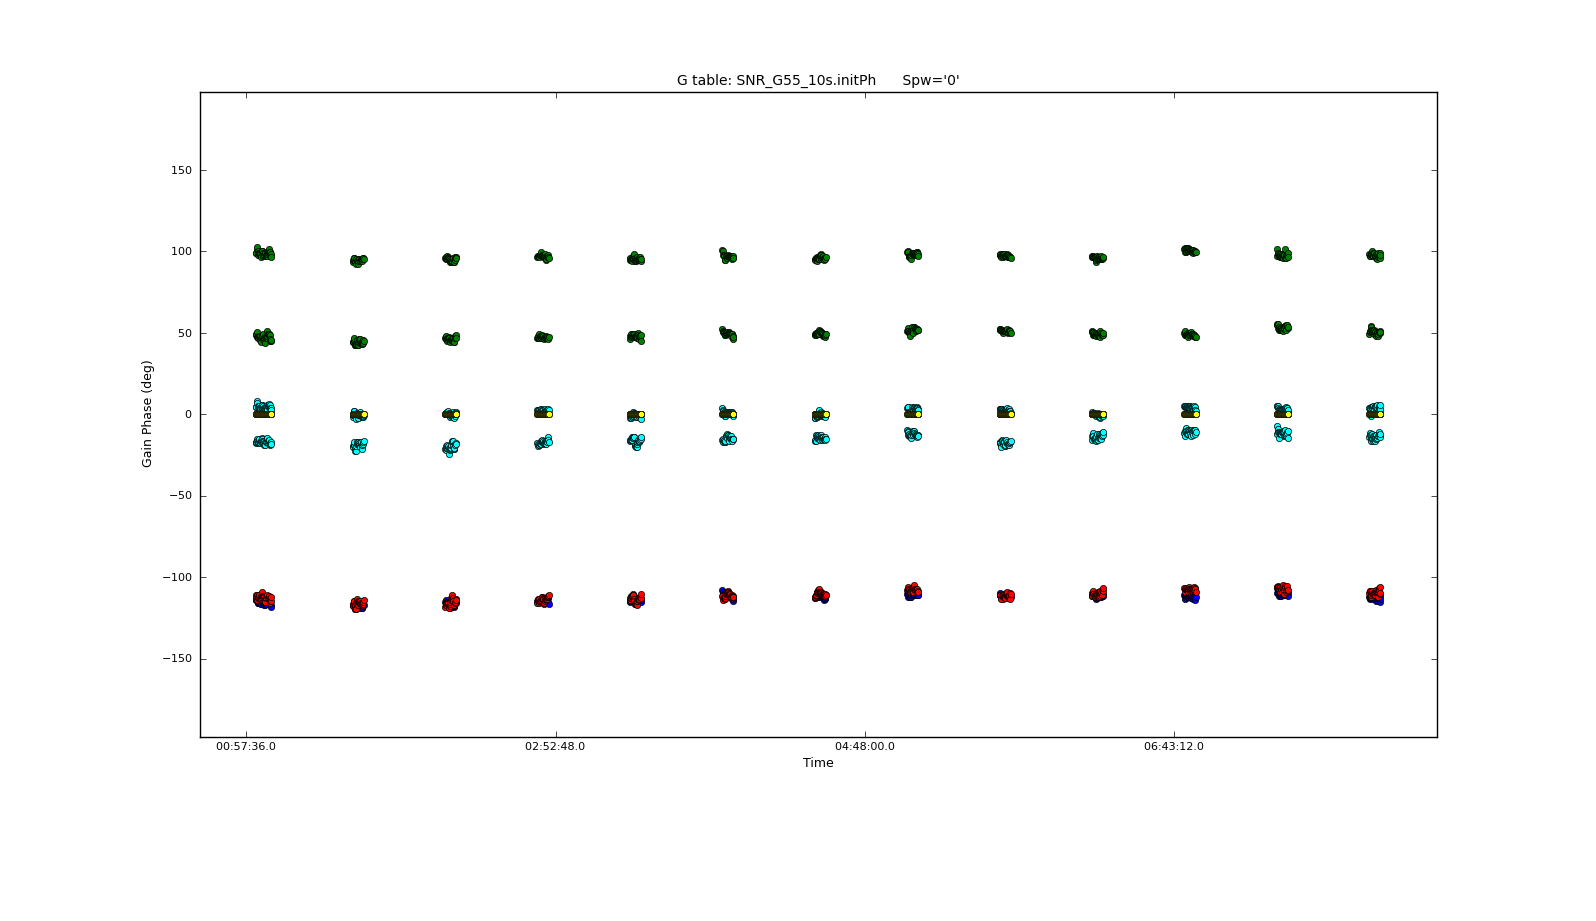
| 13:32, 8 April 2016 | Gain.phase v time.plotcal.png (file) |  |
55 KB | 1 | |
| 12:21, 8 April 2016 | SN G55 MS.MFS.wProj.alpha.png (file) |  |
13 KB | 2 | |
| 12:16, 8 April 2016 | Amp v freq before after hanning.gif (file) |  |
24 KB | 2 | |
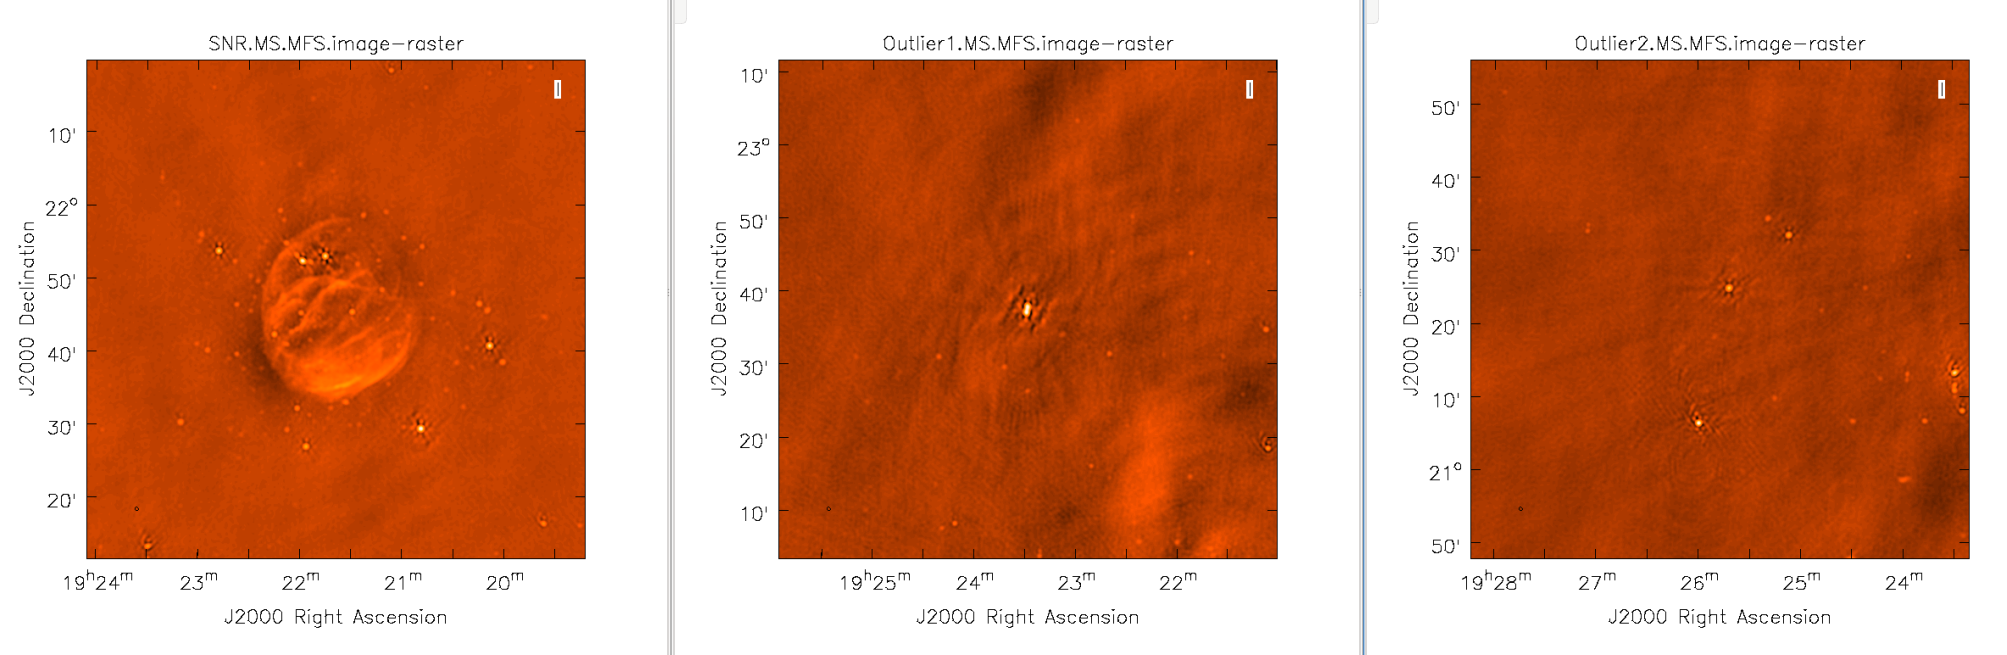
| 16:54, 7 April 2016 | Outlier Fields.png (file) |  |
599 KB | 1 | |
| 13:09, 4 April 2016 | MultiFrequency Synthesis snapshot.png (file) |  |
231 KB | 1 | |
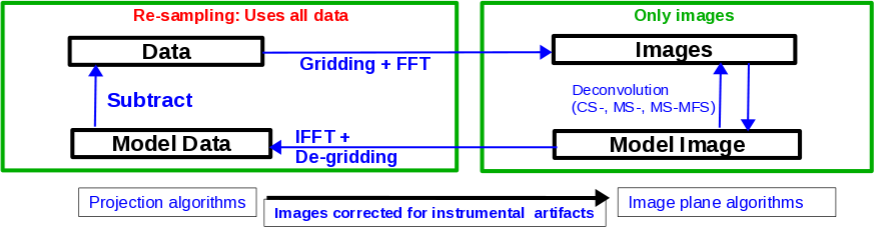
| 11:48, 4 April 2016 | CLEAN Cycle.png (file) | 39 KB | 1 | ||
| 13:28, 1 April 2016 | SNR G55.ms to mfs.wproj.gif (file) |  |
61 KB | 1 | |
| 13:08, 1 April 2016 | SNR G55.ms to mfs.gif (file) |  |
101 KB | 1 | |
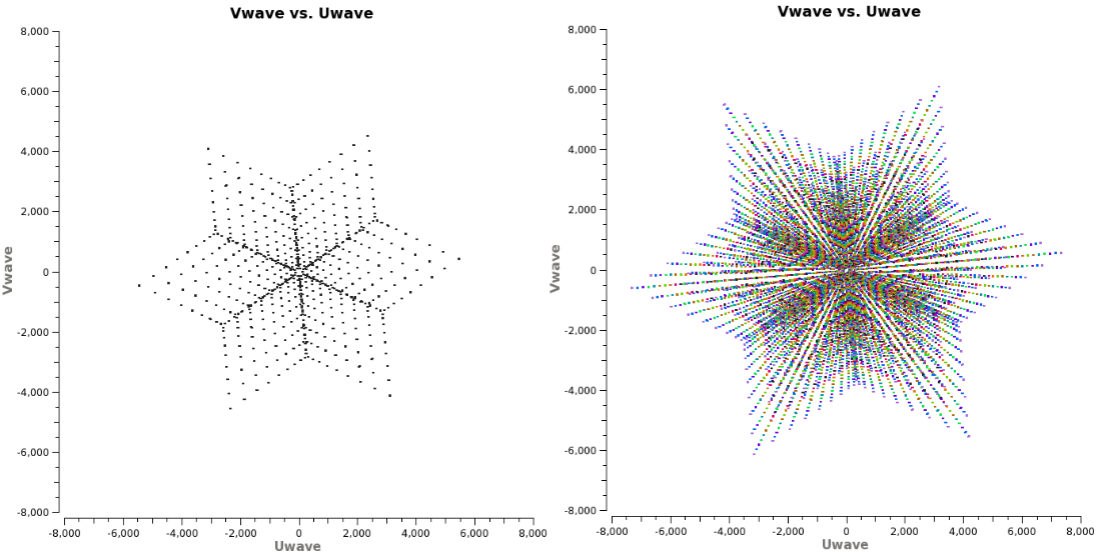
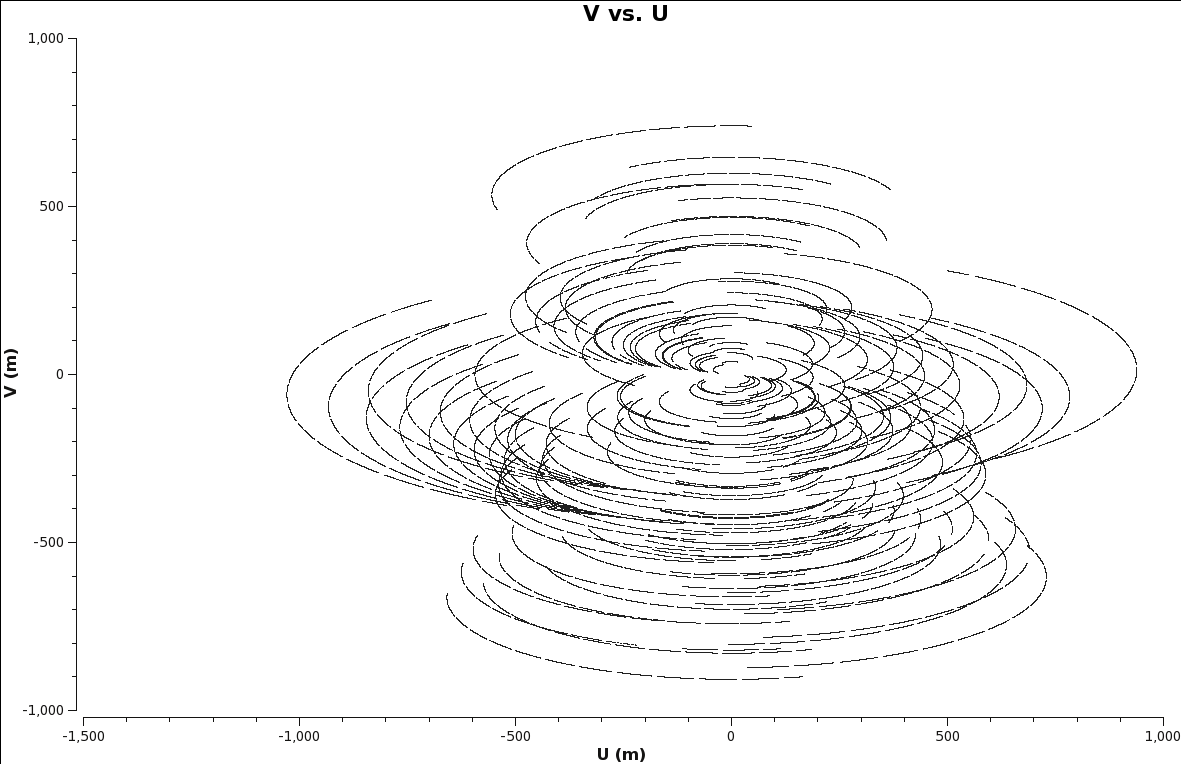
| 12:47, 1 April 2016 | SNR G55 uvcoverage.png (file) |  |
40 KB | 1 | |
| 12:23, 1 April 2016 | IGS TEC.gif (file) |  |
1.7 MB | 1 |