Uploads by Ekeller
From CASA Guides
Jump to navigationJump to search
This special page shows all uploaded files.
| Date | Name | Thumbnail | Size | Description | Versions |
|---|---|---|---|---|---|
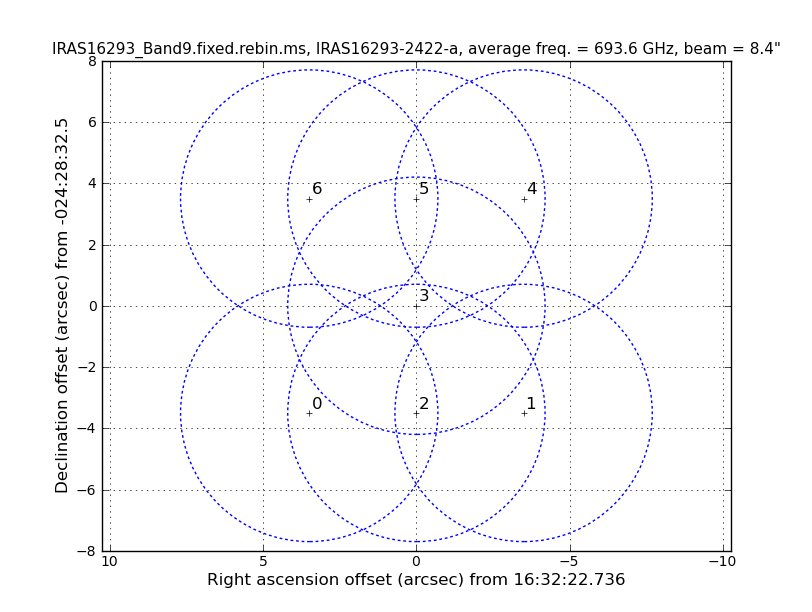
| 20:28, 4 January 2018 | Mosaic pattern 5.1.png (file) |  |
82 KB | 1 | |
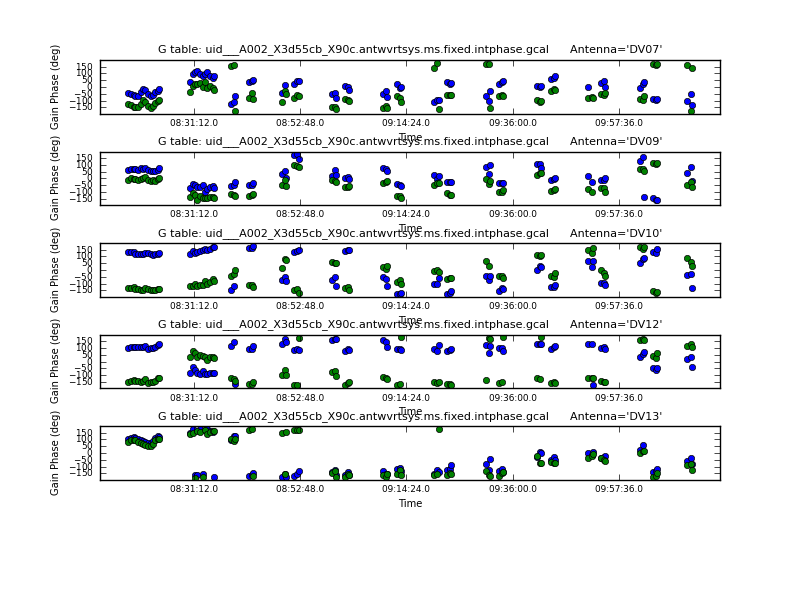
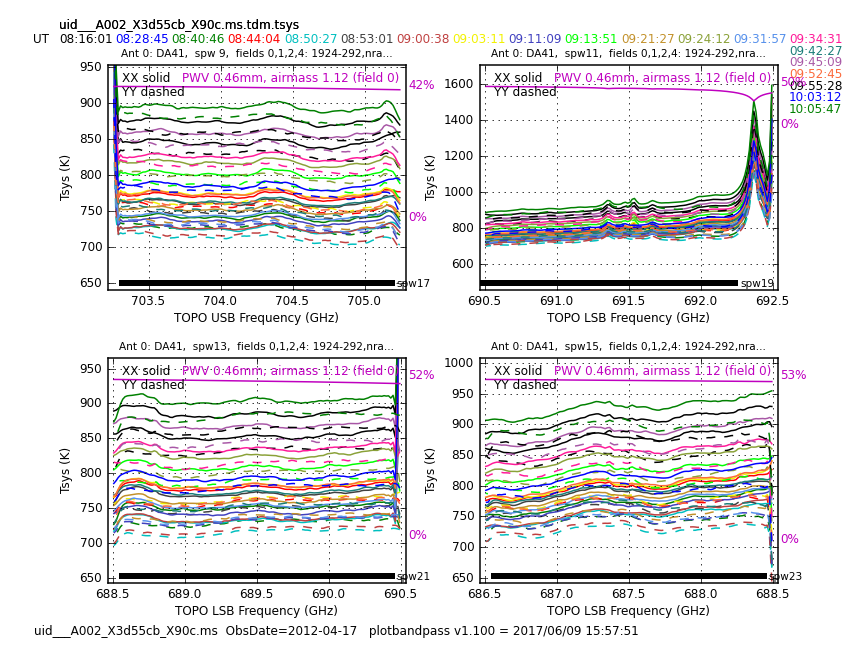
| 21:11, 6 December 2017 | X90c.intphase.5.1.1.png (file) |  |
102 KB | 1 | |
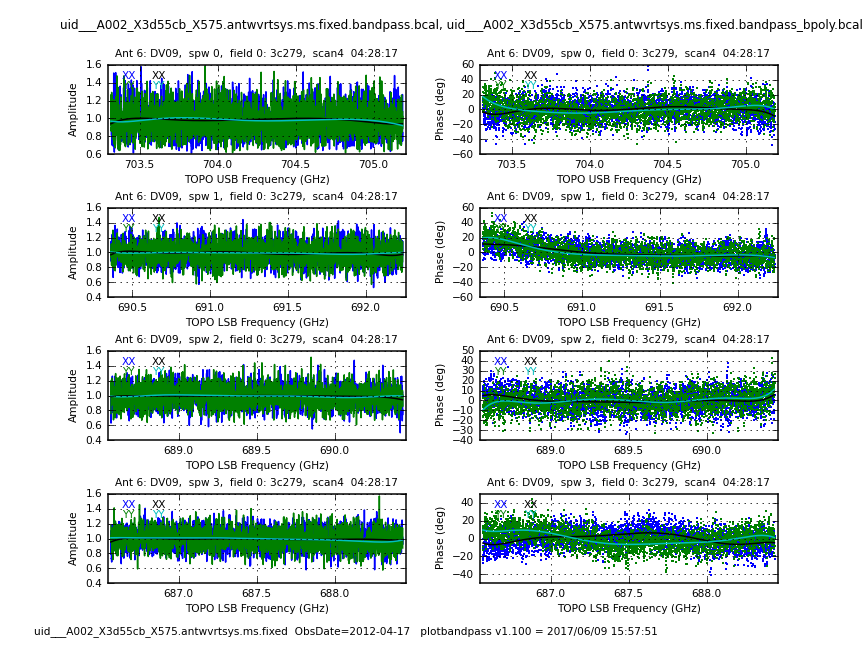
| 18:09, 6 December 2017 | X575 bp DV09 5.1.1.png (file) |  |
170 KB | 1 | |
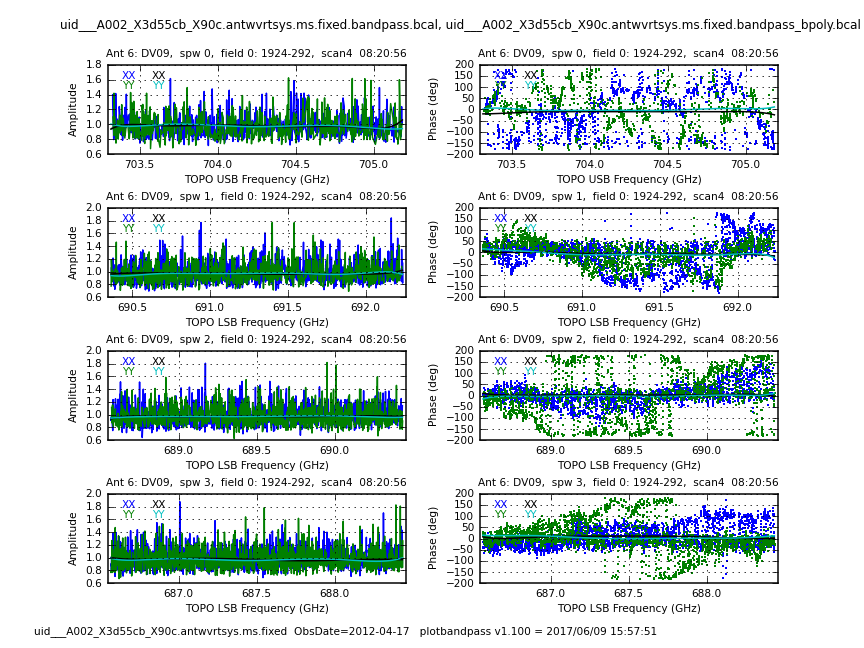
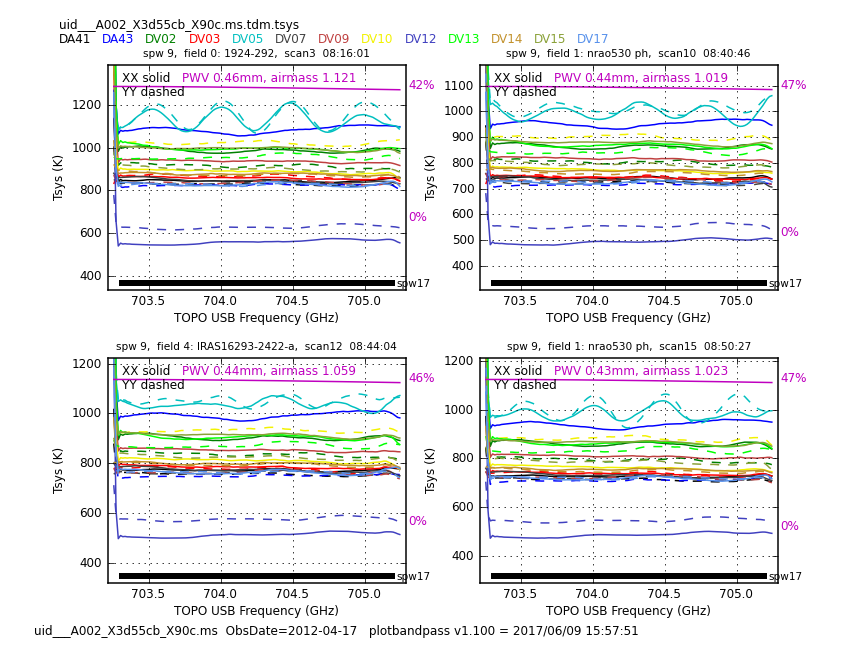
| 18:06, 6 December 2017 | X90c bp DV09 5.1.1.png (file) |  |
186 KB | 1 | |
| 17:36, 6 December 2017 | Horizons2010JunoCASA5.1.1.png (file) |  |
31 KB | Uvdist vs. Amp for the Butler-JPL Horizons 2010 model for Juno. | 1 |
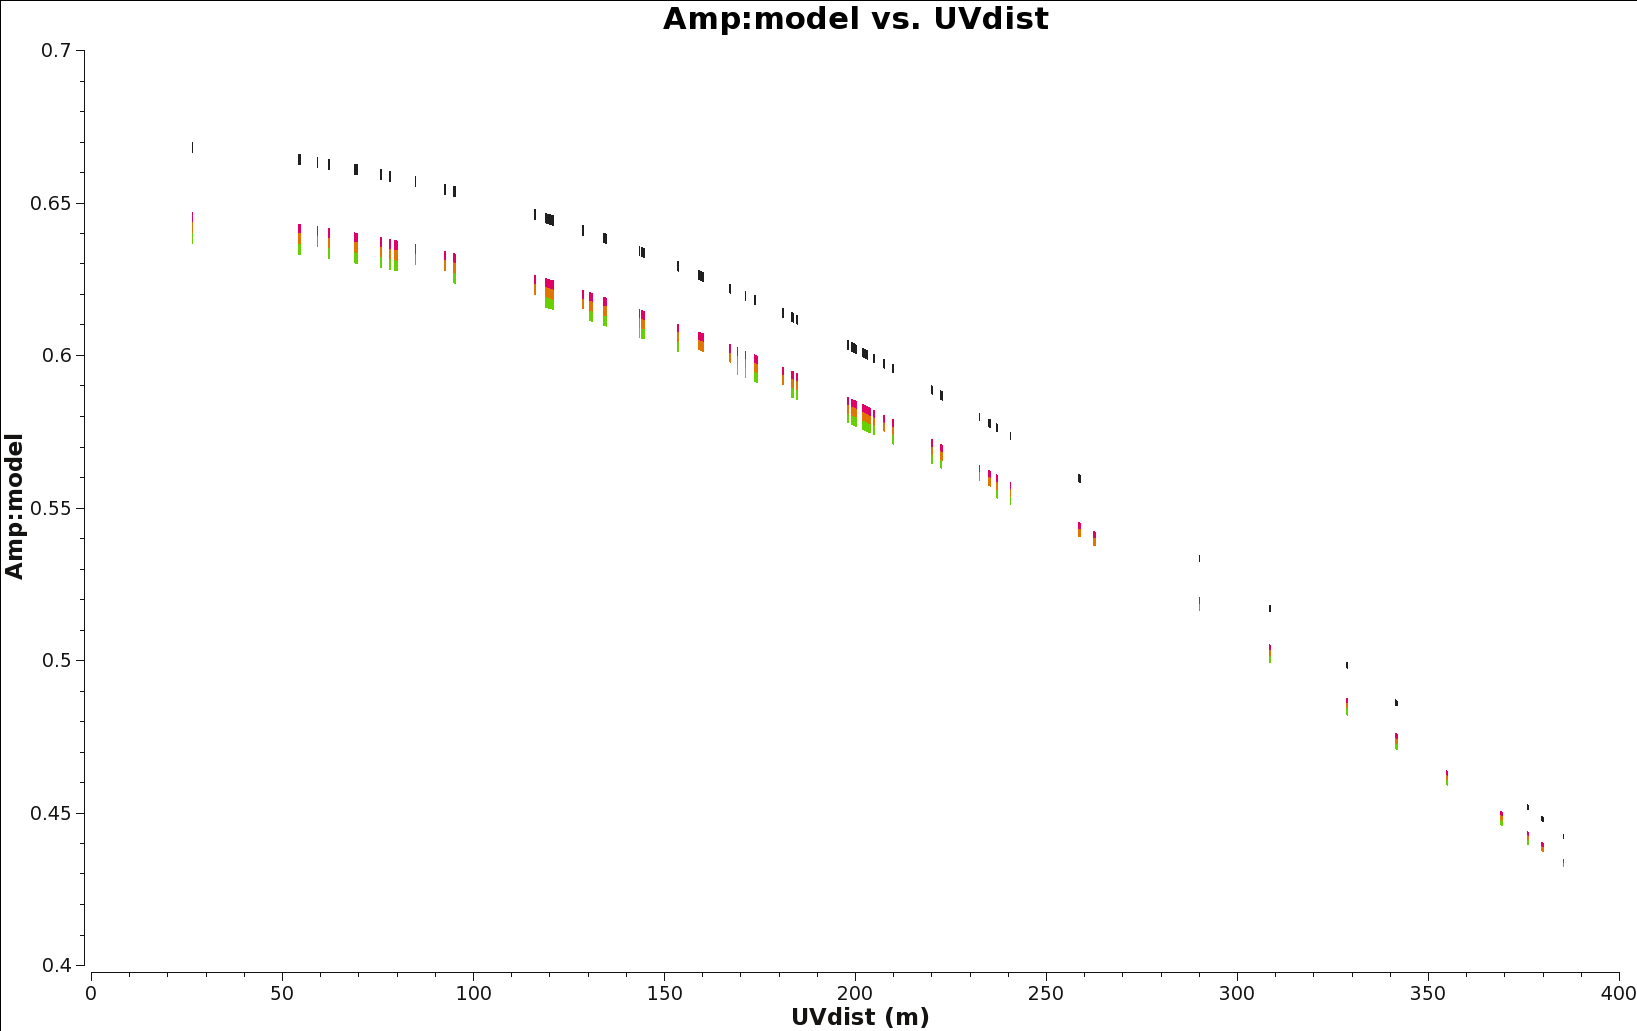
| 17:35, 6 December 2017 | Horizons2012JunoCASA5.1.1.png (file) |  |
31 KB | Uvdist vs. Amp for the Butler-JPL Horizons 2012 model for Juno. | 1 |
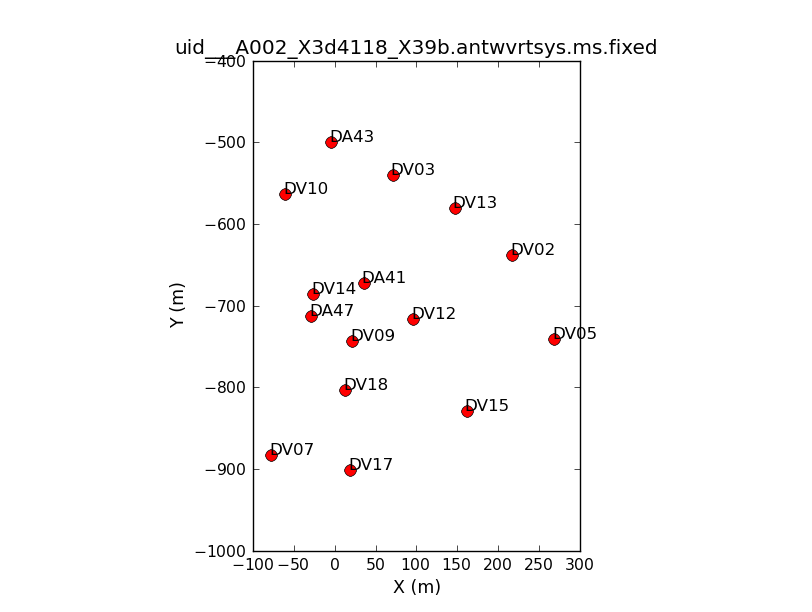
| 16:21, 6 December 2017 | X39b ants 5.1.1.png (file) |  |
40 KB | 1 | |
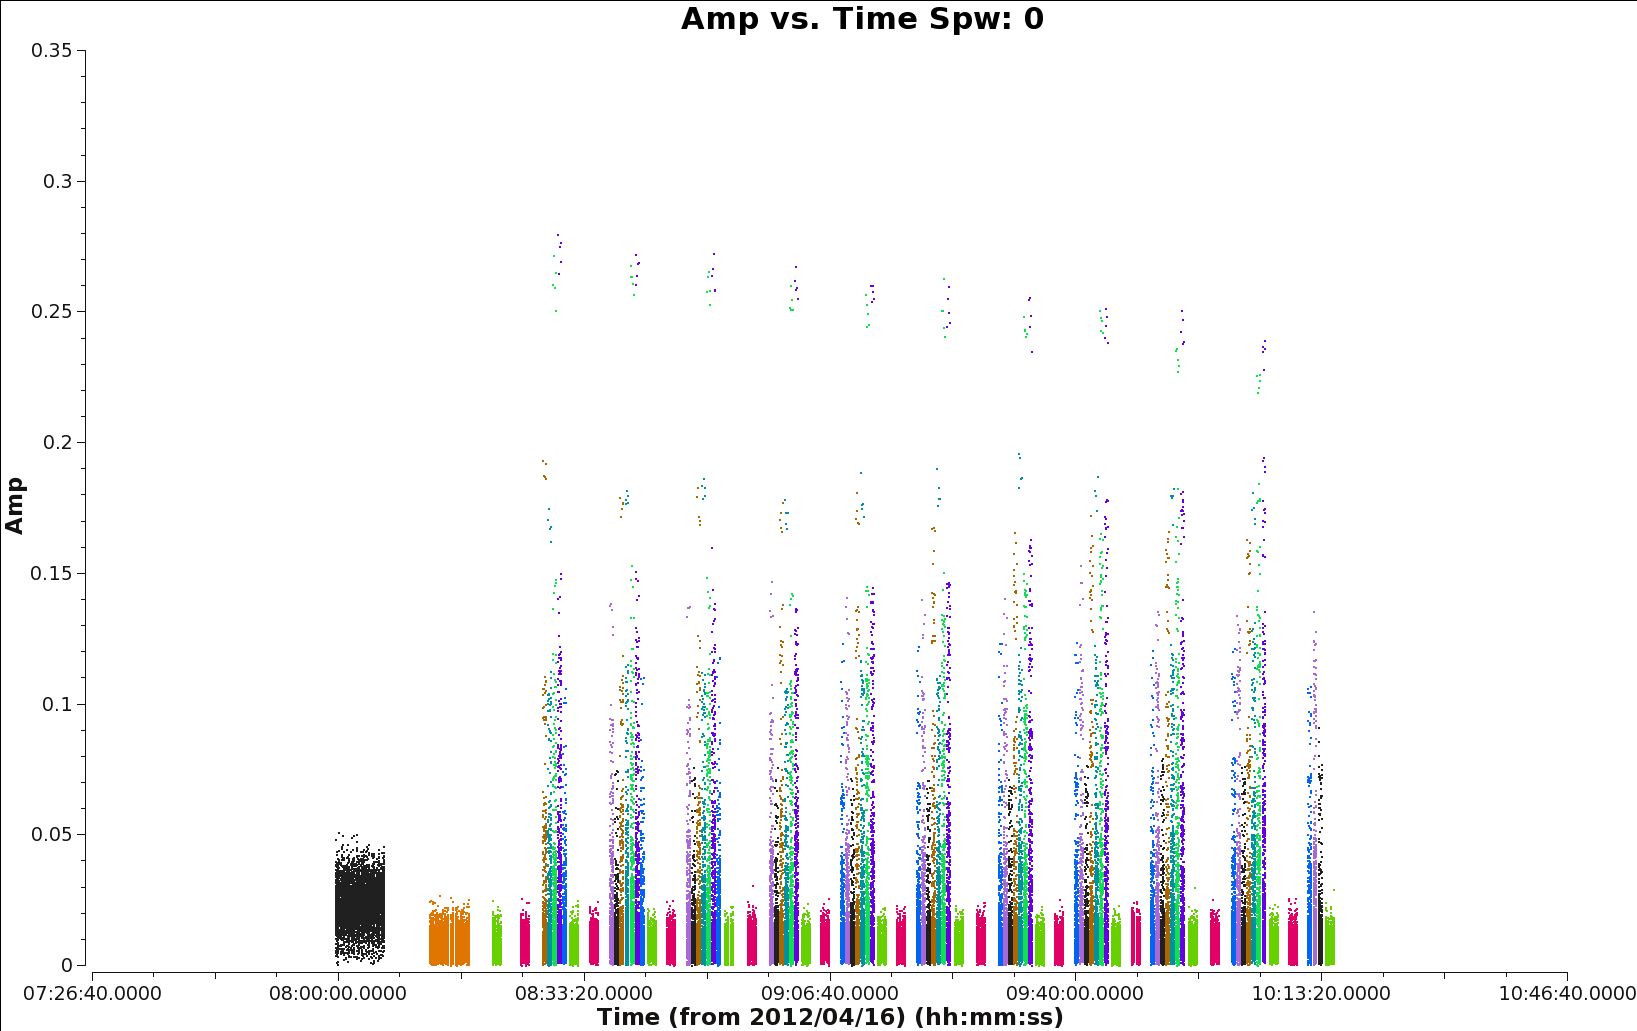
| 20:12, 1 December 2017 | IRAS16293 B9 amp vs time 5.1.png (file) |  |
69 KB | 1 | |
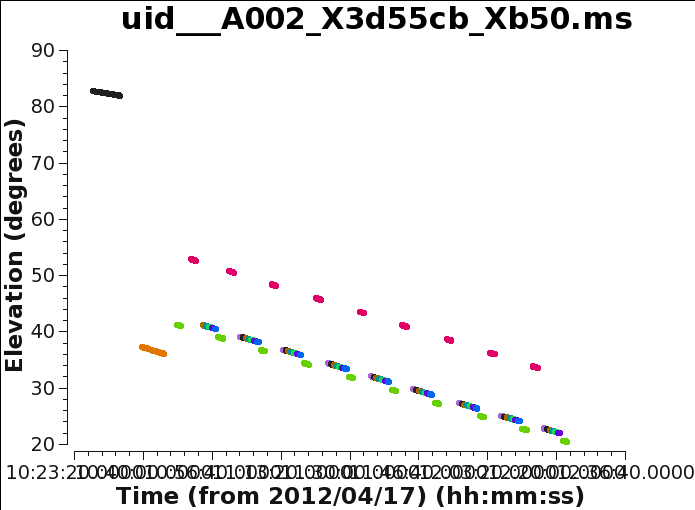
| 19:08, 1 December 2017 | IRAS16293 B9 el vs time 5.1.png (file) |  |
32 KB | 1 | |
| 23:13, 30 November 2017 | IRAS16293 B9 tsys antenna 5.1.png (file) |  |
204 KB | 1 | |
| 23:08, 30 November 2017 | IRAS16293 B9 tsys time 5.1.png (file) |  |
307 KB | 1 | |
| 14:25, 12 September 2017 | Init.py (file) | 235 bytes | An example init.py file to import Analysis Utilities upon CASA startup | 1 | |
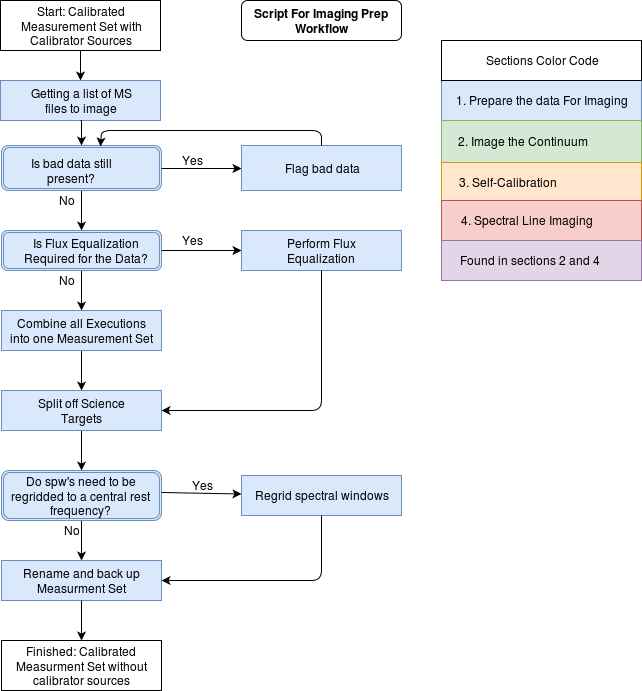
| 09:56, 7 June 2017 | Imaging Prep Flow.png (file) |  |
55 KB | 3 | |
| 09:12, 10 April 2017 | TWHydra corrected Spw2.png (file) |  |
90 KB | 2 | |
| 15:27, 5 April 2017 | ScriptForImaging Template.py (file) | 19 KB | NA Imaging Script Template | 1 | |
| 15:25, 5 April 2017 | ScriptForImagingPrep Template.py (file) | 6 KB | NA Imaging Prep template script | 1 | |
| 14:58, 5 April 2017 | TDM.example.ms.scriptForCalibration.py (file) | 21 KB | correcting True/False | 2 | |
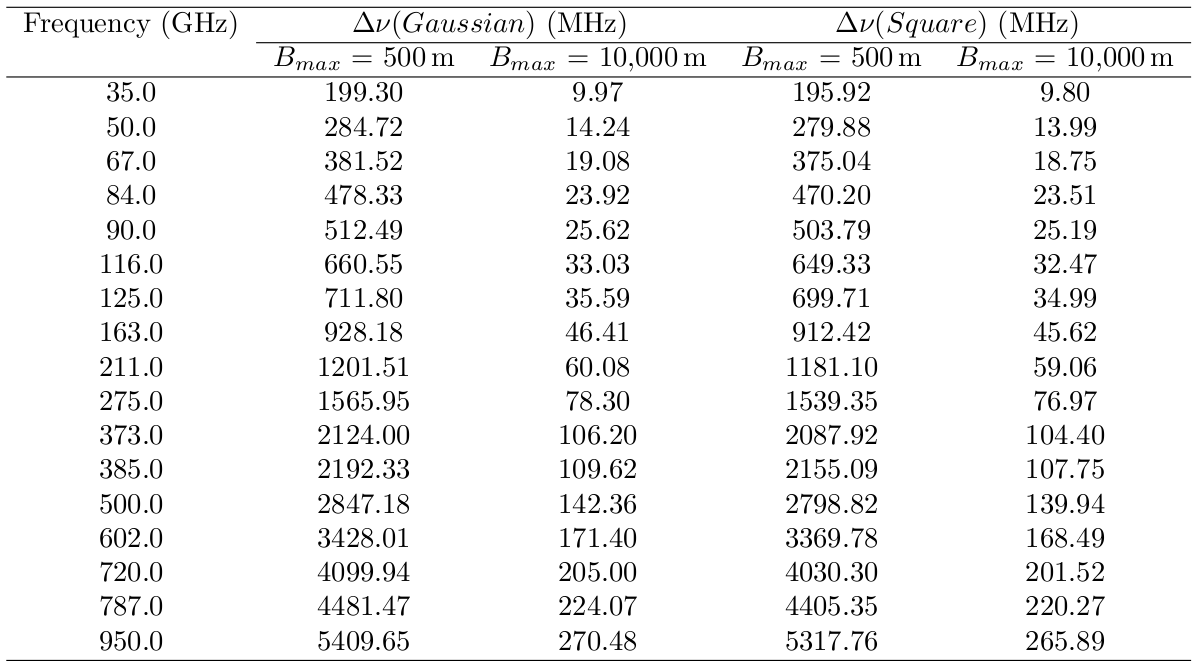
| 14:09, 5 April 2017 | Bandwidthsmearingtable.png (file) |  |
92 KB | This table lists the maximum bandwidth allowed for a reduction in peak response to a point source over the field of view of 1% for a a square and Gaussian bandpass. This tables lists this for various observing frequencies and baselines for the two band... | 1 |
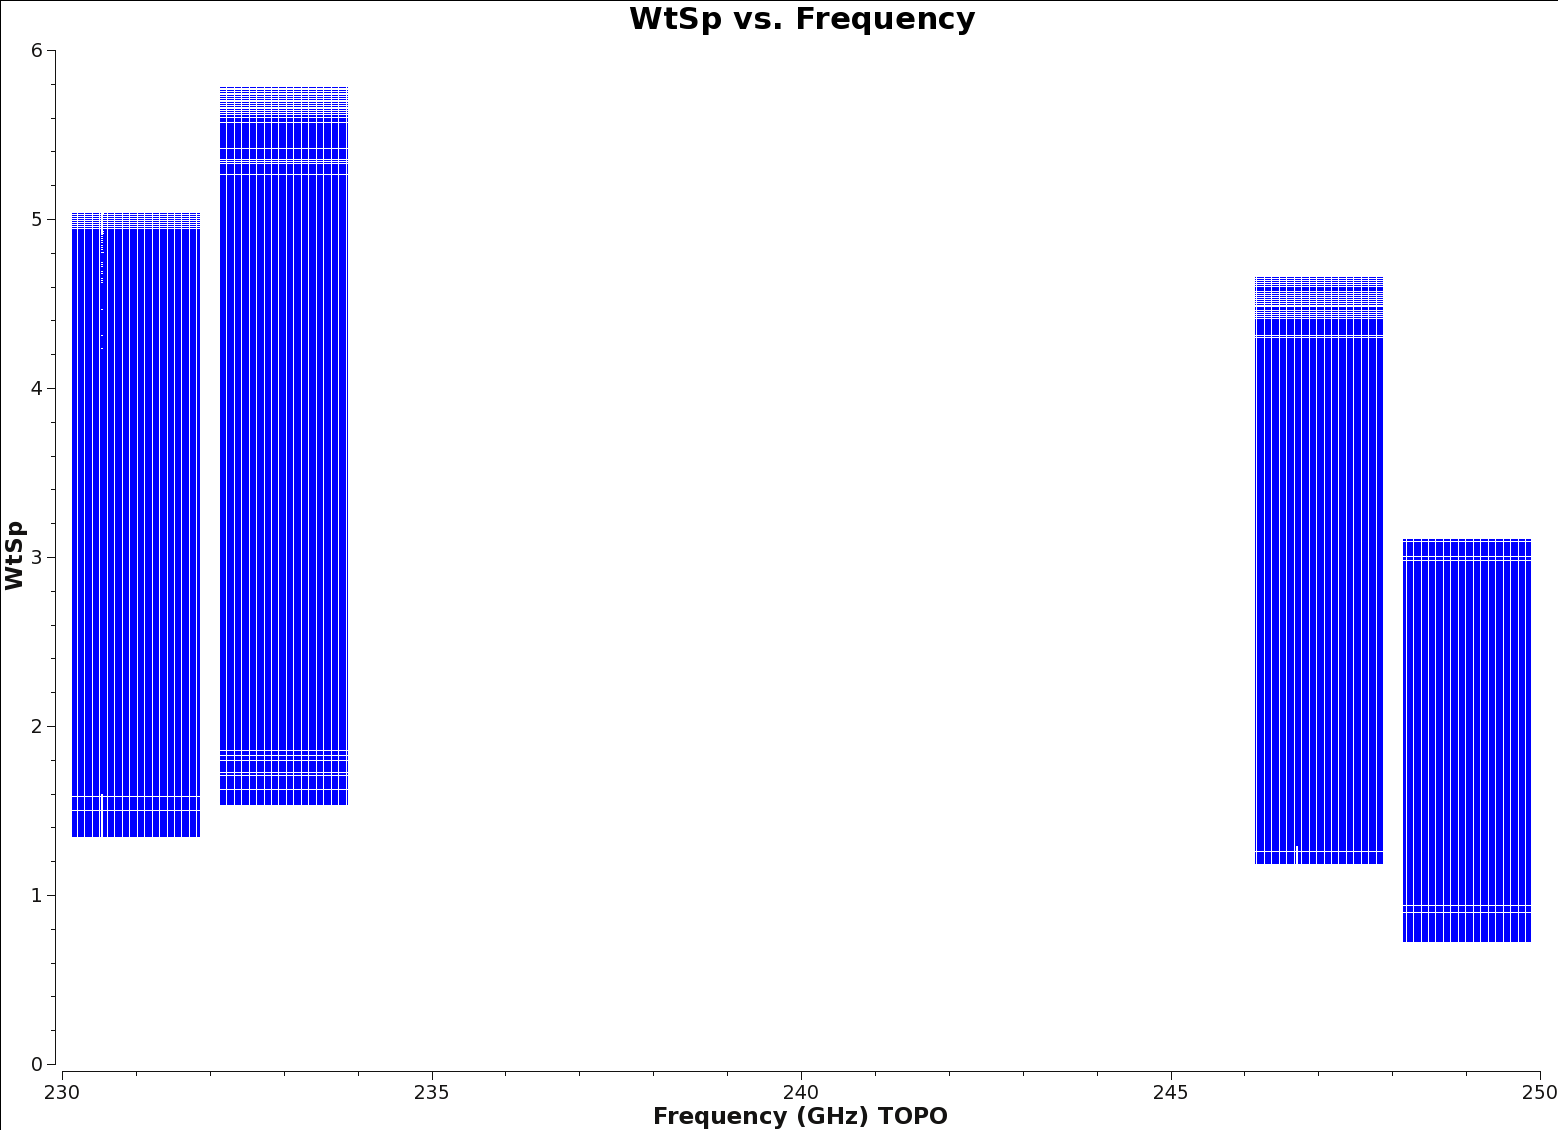
| 13:45, 5 April 2017 | Wt vs Freq spw0123.png (file) |  |
29 KB | wtsp vs frequency for all spw | 1 |
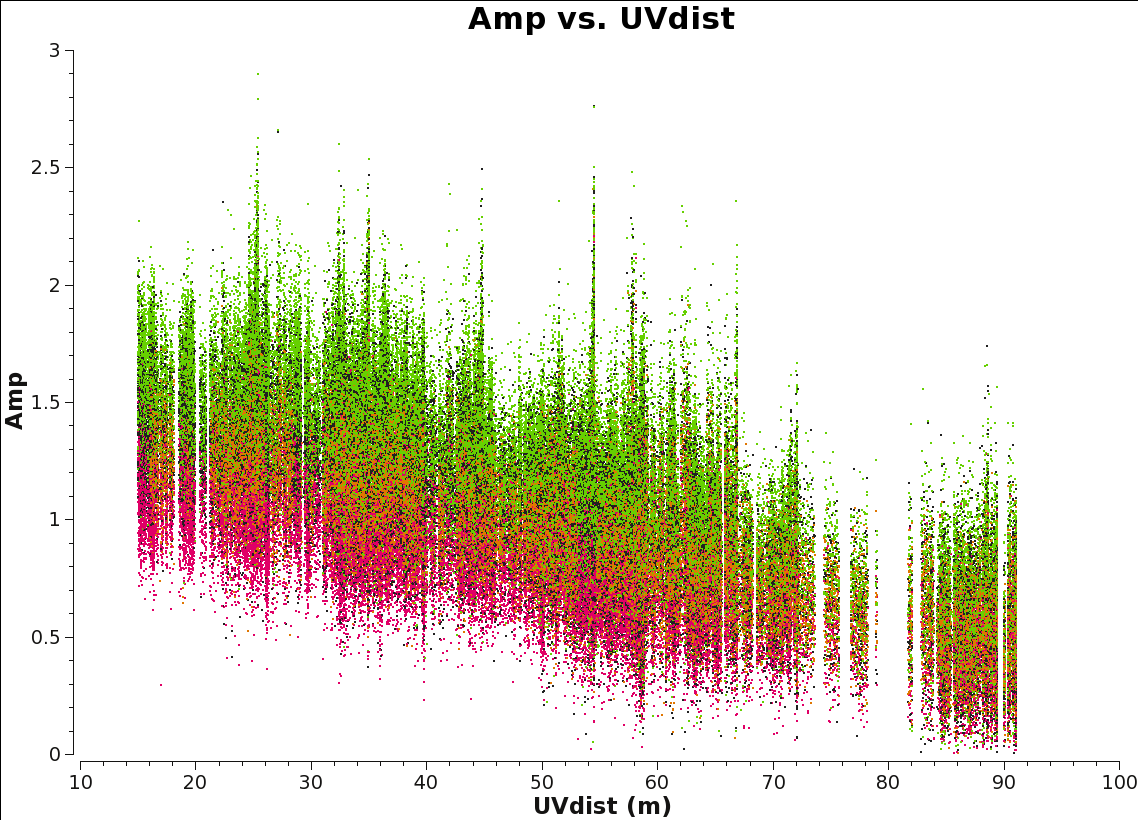
| 13:40, 5 April 2017 | Amp vs uvdist.png (file) |  |
170 KB | Inspect the continuum with amp vs uvdist plot, colored by spw. | 1 |
| 11:35, 5 April 2017 | Imaging Prep WorkFlow.pdf (file) | 143 KB | Workflow for the Imaging Prep guide. | 1 | |
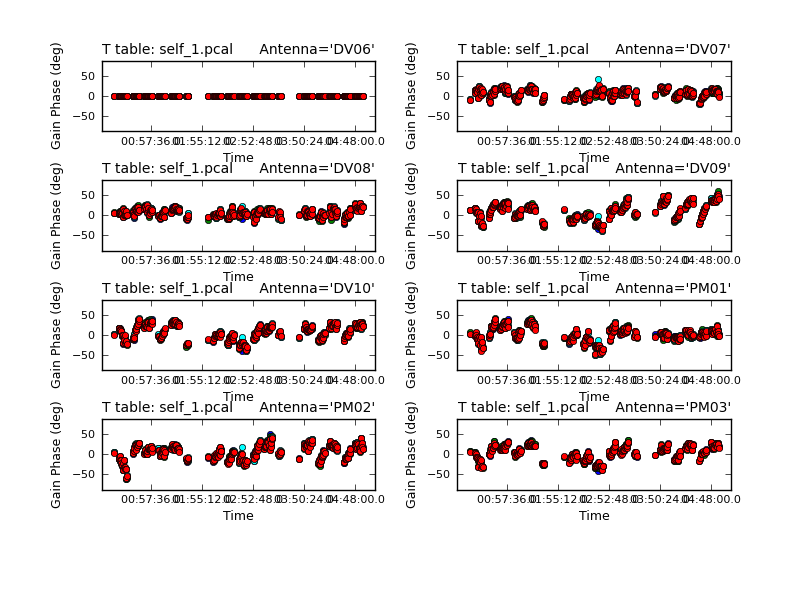
| 11:25, 5 April 2017 | Plotcal image.png (file) |  |
96 KB | First round of self-cal solutions plotted. | 1 |
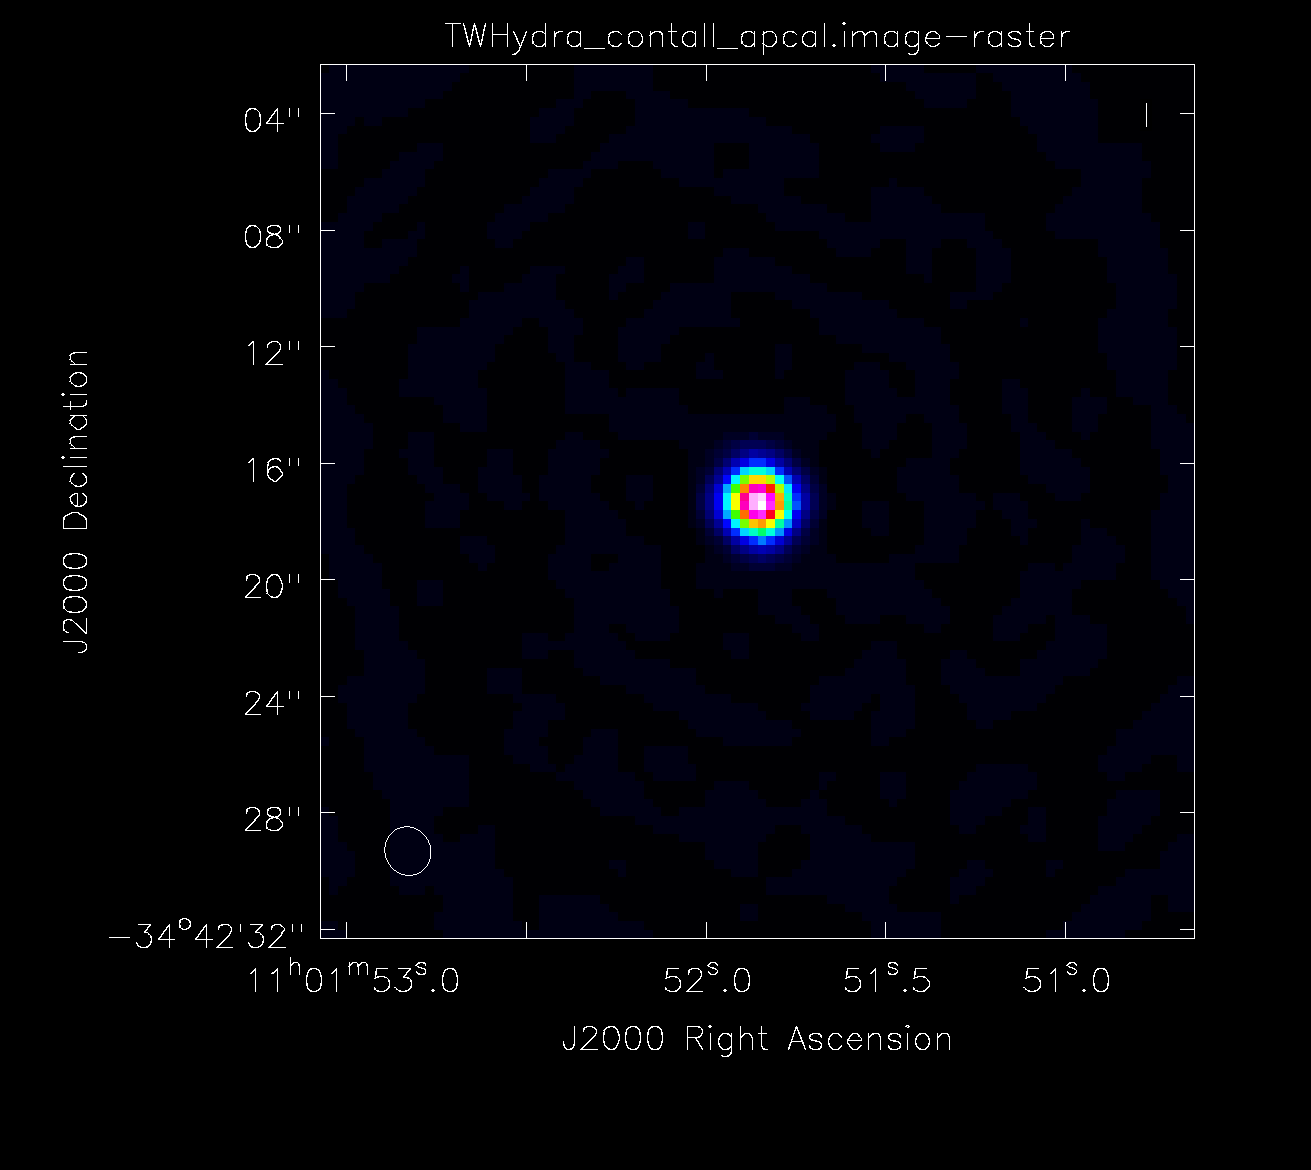
| 11:11, 5 April 2017 | Apcal.png (file) |  |
18 KB | Continuum image after amplitude self-calibration. | 1 |
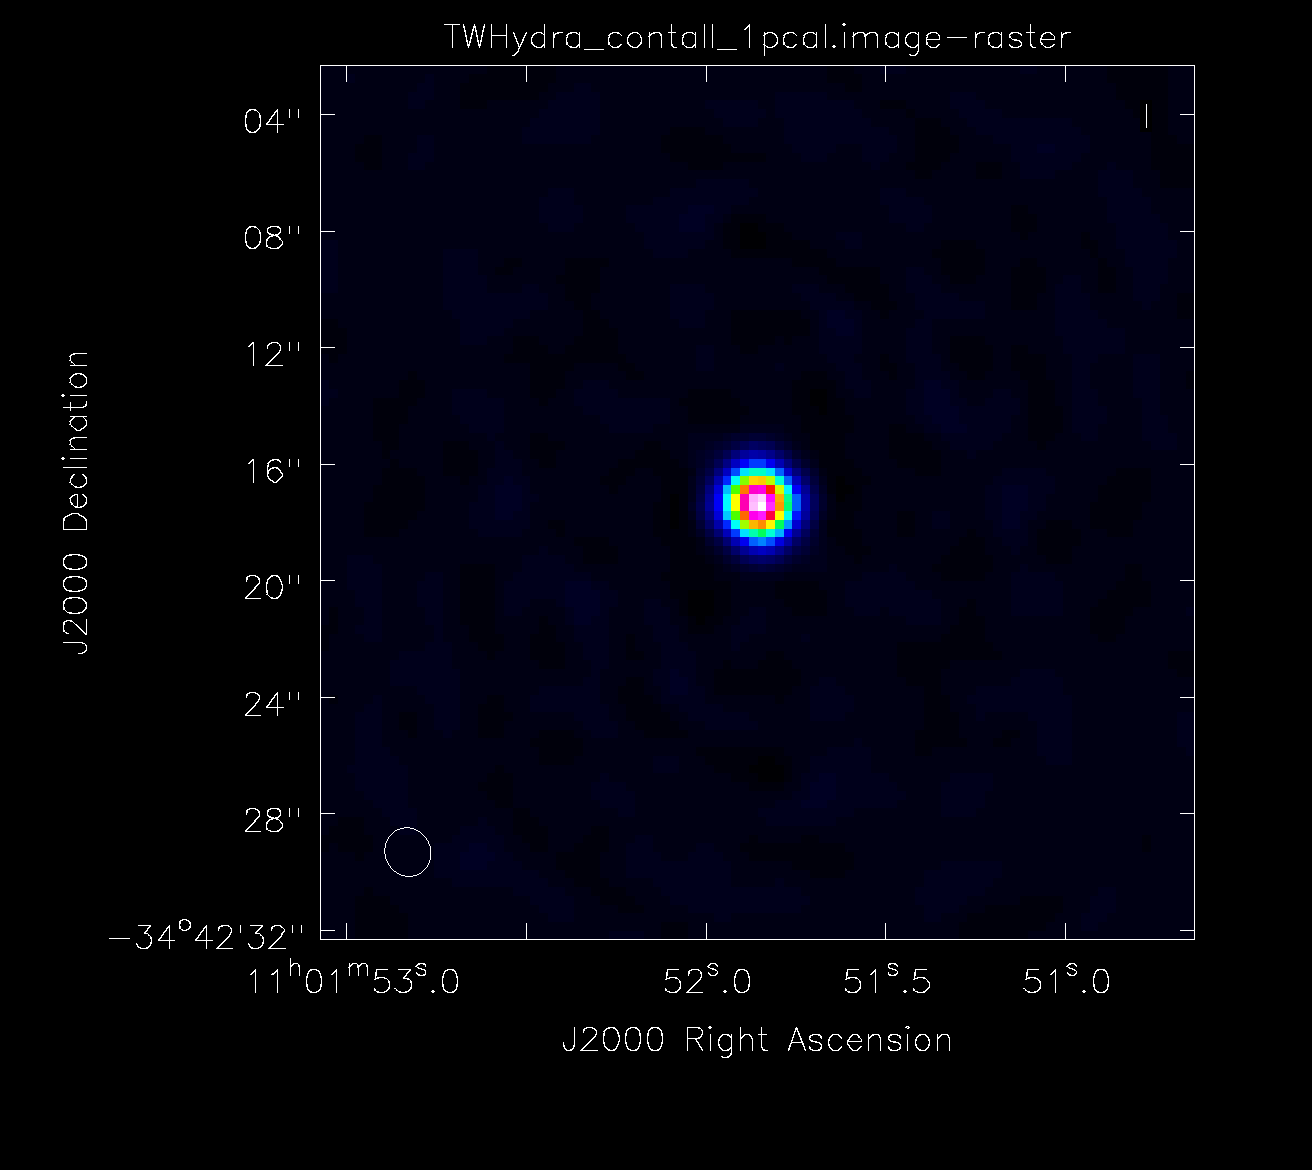
| 11:03, 5 April 2017 | Pcal1.png (file) |  |
19 KB | Continuum image after first round of self-calibration. | 1 |
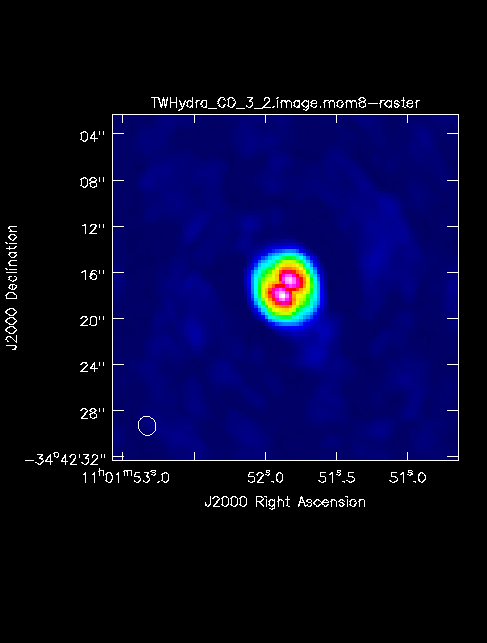
| 10:53, 5 April 2017 | TWHydra CO 3 2.image.mom8.png (file) |  |
14 KB | Moment 8 map of CO (3-2). | 1 |
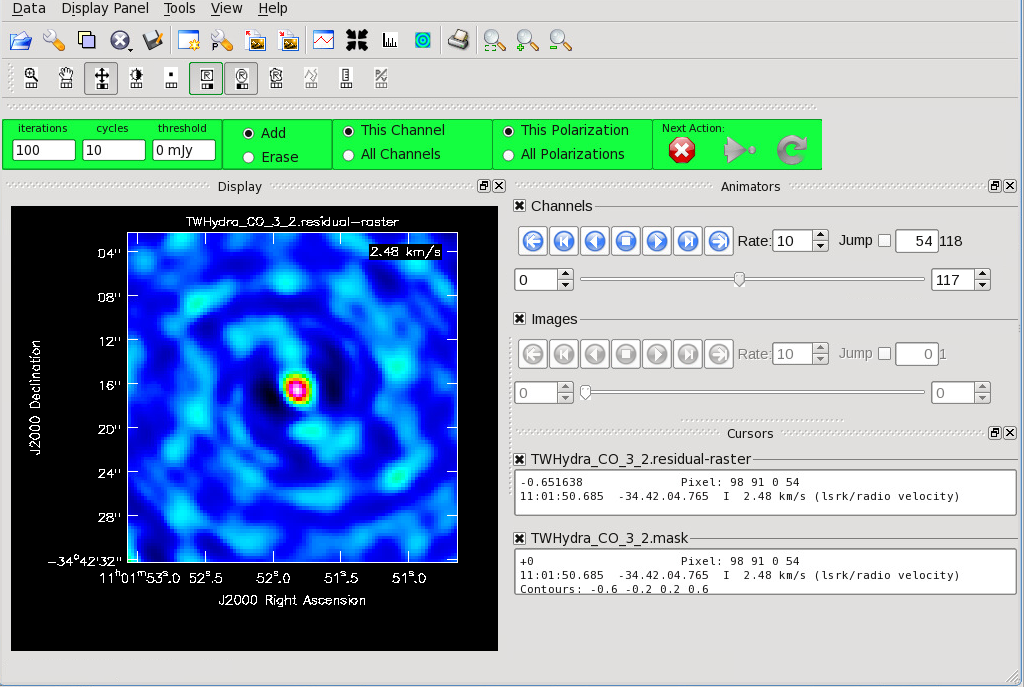
| 10:47, 5 April 2017 | CO initial image.png (file) |  |
284 KB | Channel 54 of the dirty cube TW Hya. | 1 |
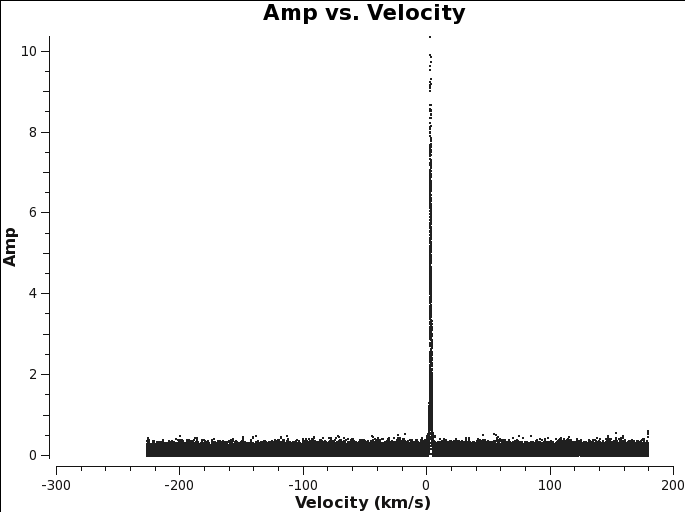
| 10:45, 5 April 2017 | TWHydra CO3 2 plotms.png (file) |  |
13 KB | Amp vs velocity plot to identify line channels to image. | 1 |
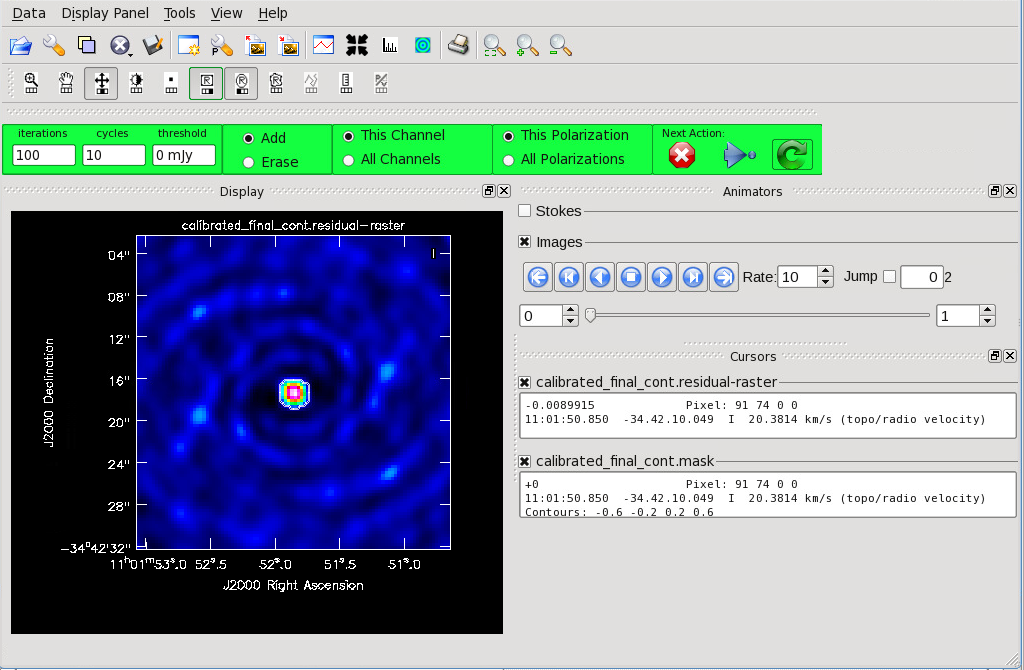
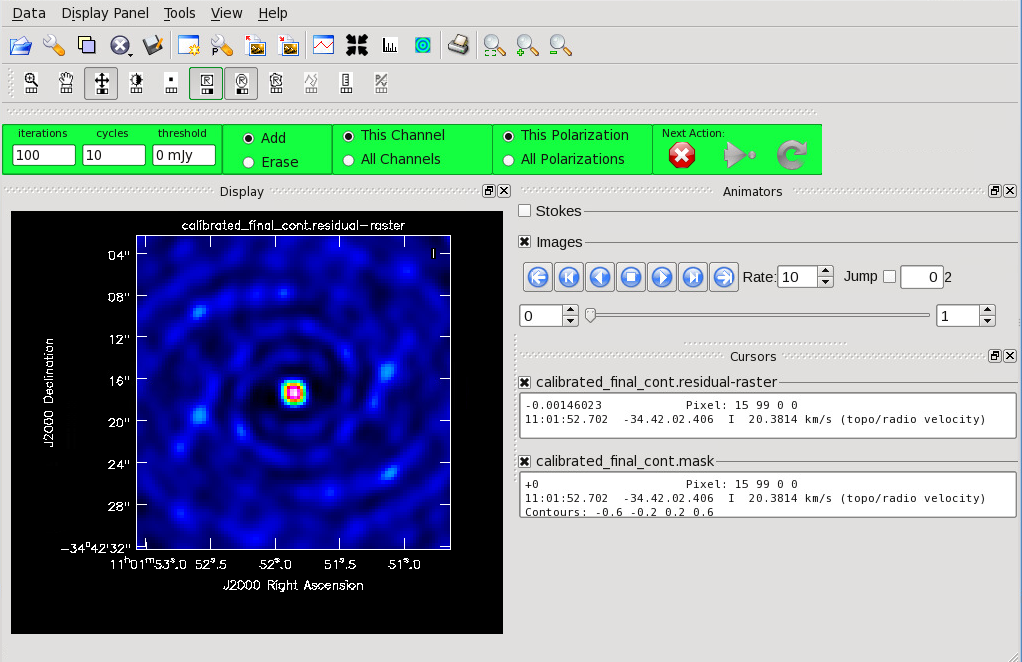
| 10:41, 5 April 2017 | Final Cont residual.png (file) |  |
327 KB | 1 | |
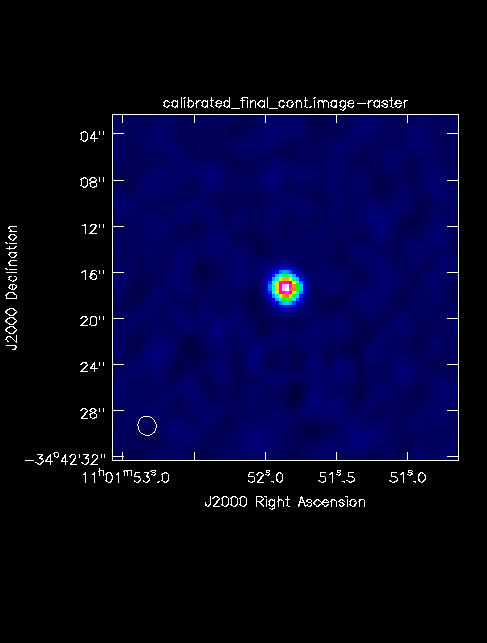
| 10:40, 5 April 2017 | Final Continuum Image.png (file) |  |
13 KB | 1 | |
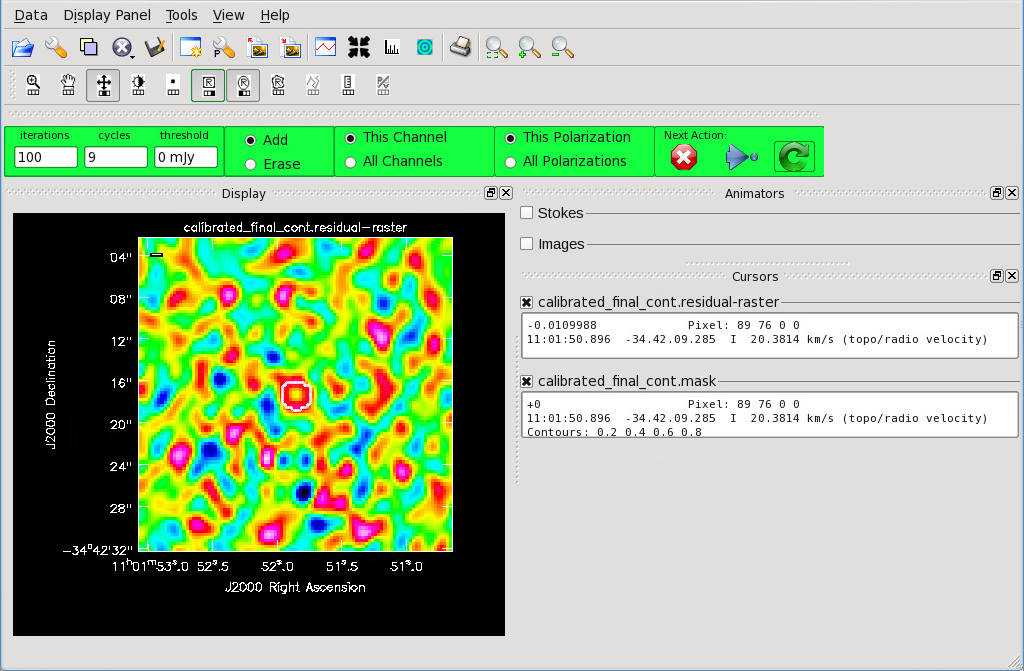
| 10:37, 5 April 2017 | Cont before clean mask.png (file) |  |
197 KB | Continuum image with mask overlaid. | 1 |
| 10:34, 5 April 2017 | Cont before clean.png (file) |  |
201 KB | Dirty continuum image of TW Hya. | 1 |
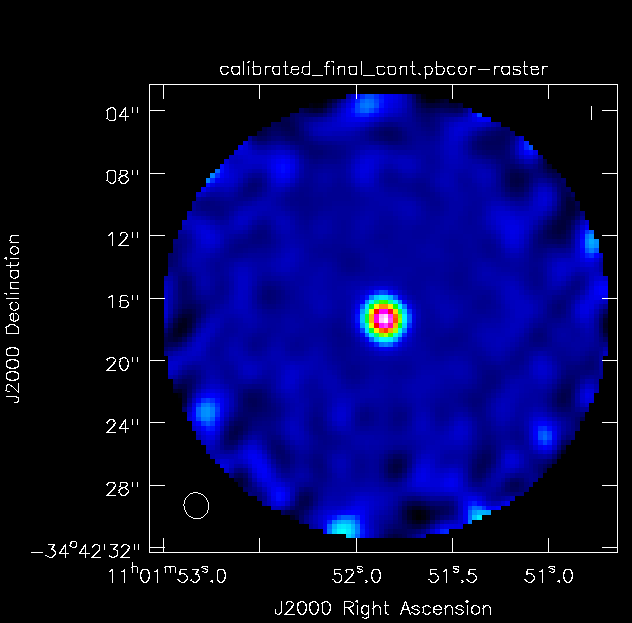
| 09:37, 5 April 2017 | TW Hya Calibrated final.pbcor.png (file) |  |
17 KB | TW Hydra image after a primary beam correction is applied to correct the lower rms found at the edges of the images from the primary beam. | 1 |
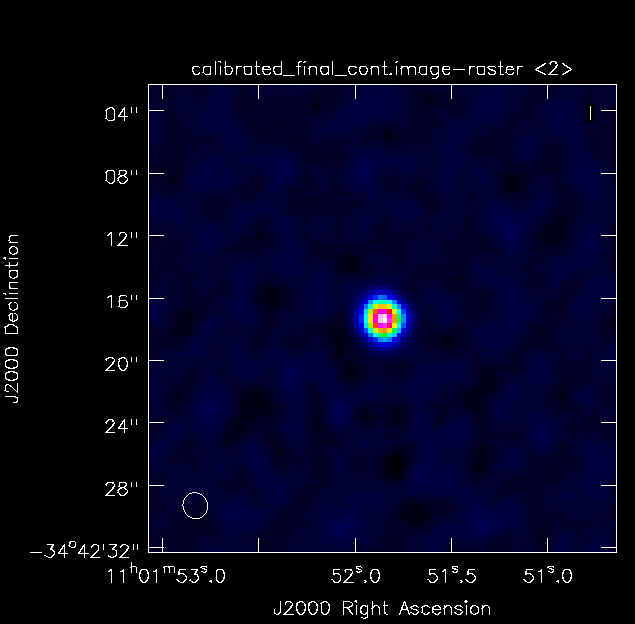
| 09:36, 5 April 2017 | TW Hya Calibrated final cont.image.png (file) |  |
13 KB | TW Hydra continuum image | 1 |
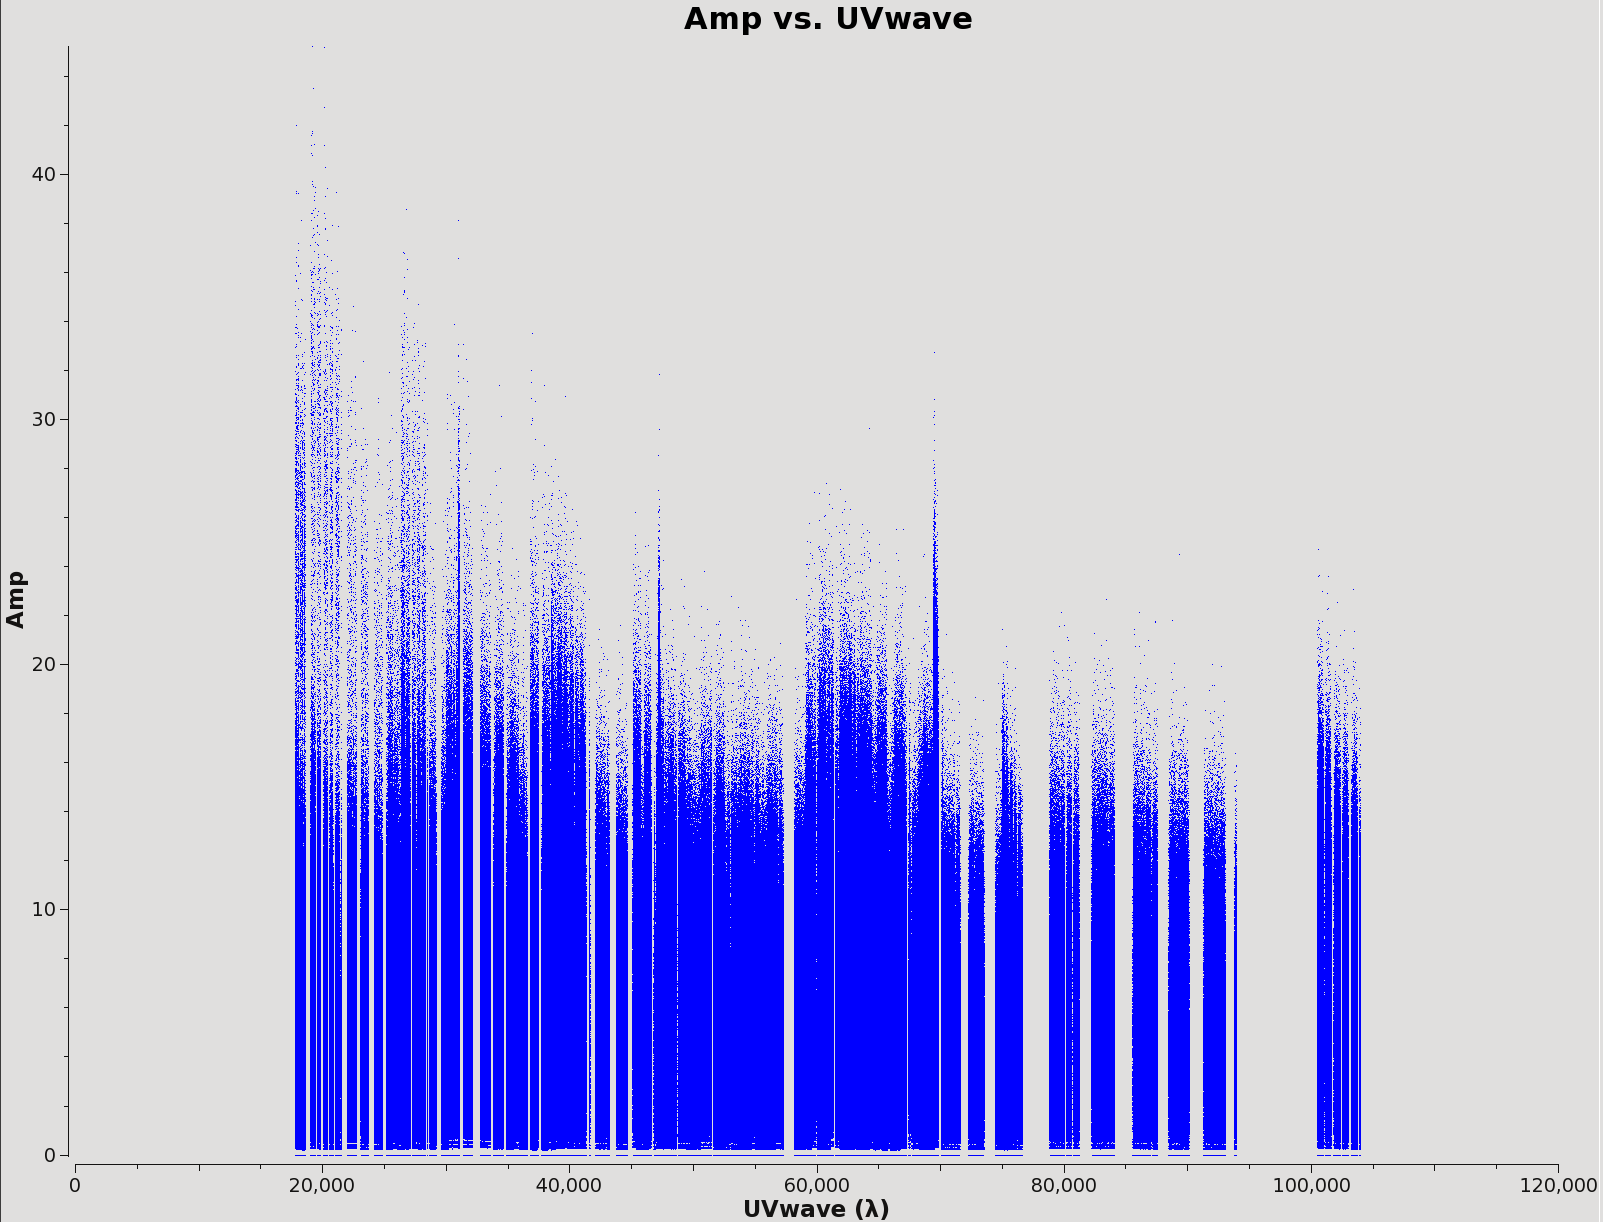
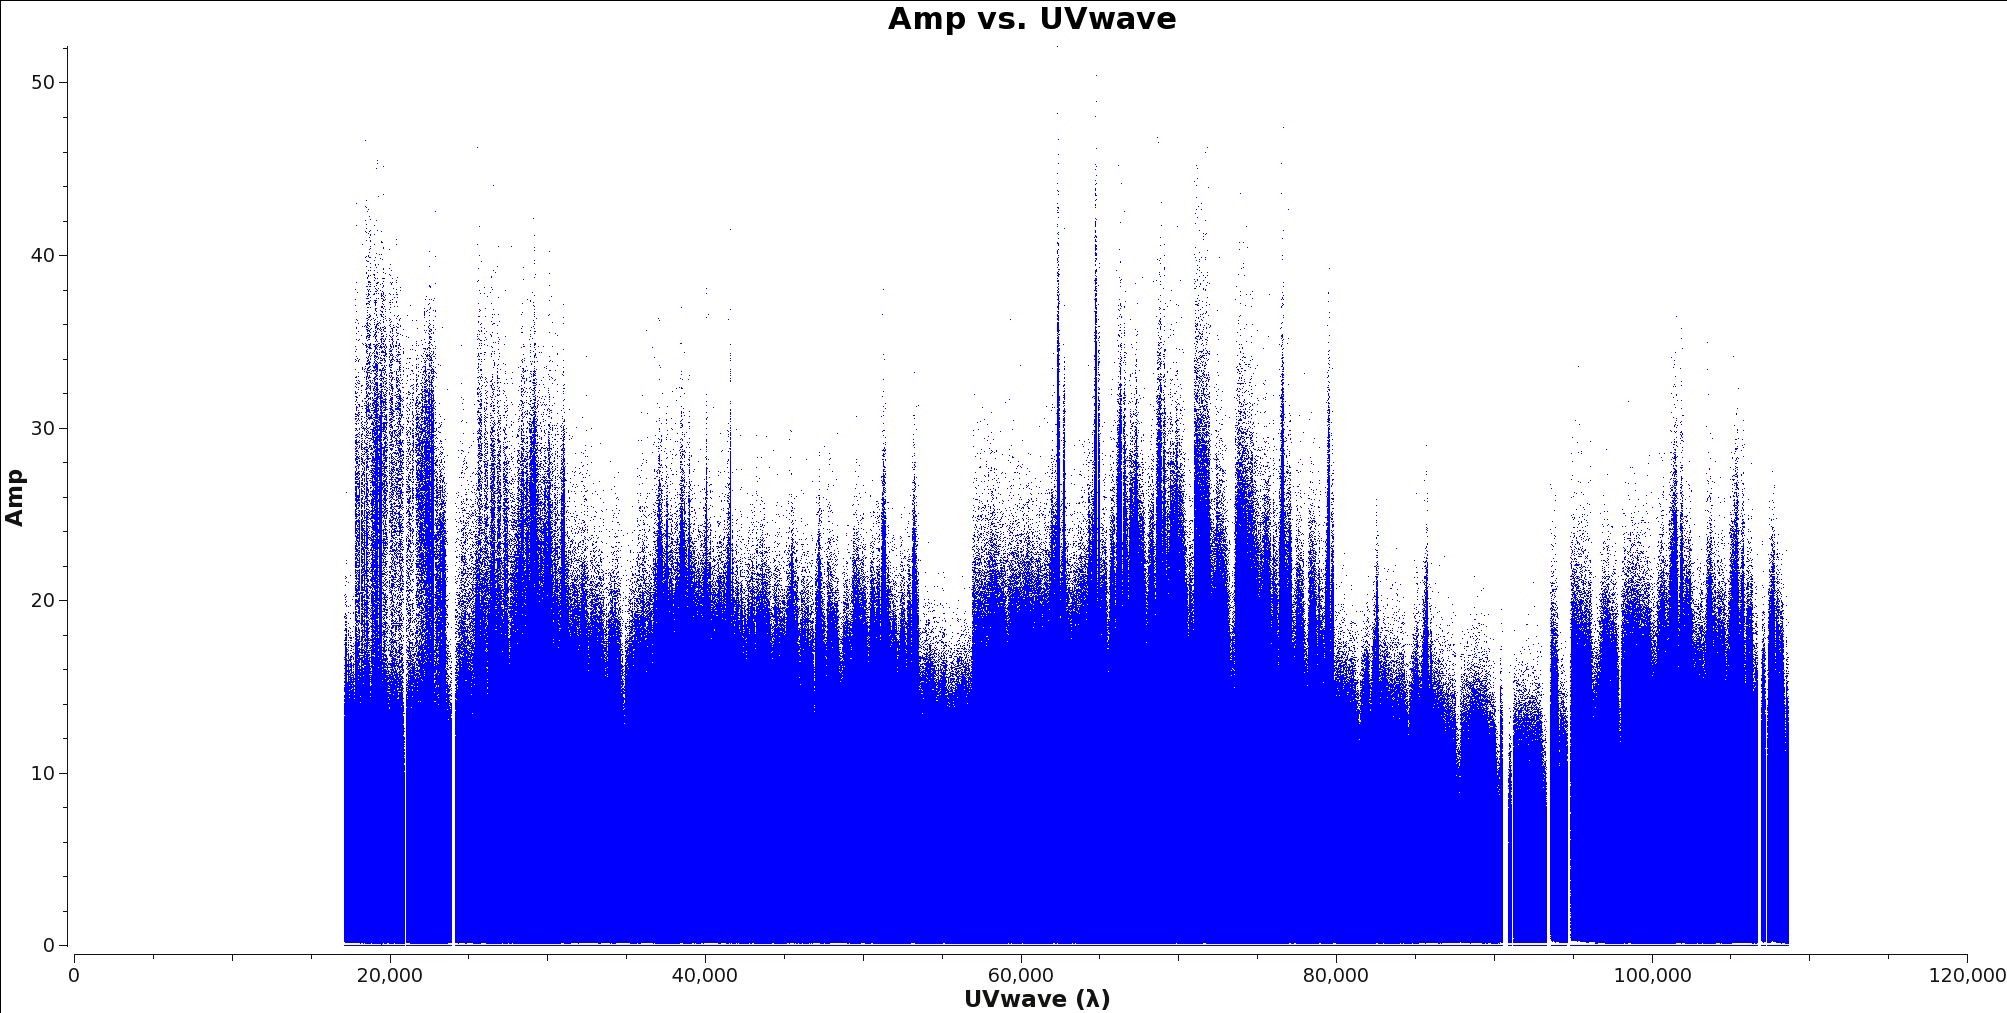
| 09:29, 5 April 2017 | Calibrated final AmpVsUVWave.png (file) |  |
106 KB | Reverted to version as of 21:00, 4 April 2017 | 3 |
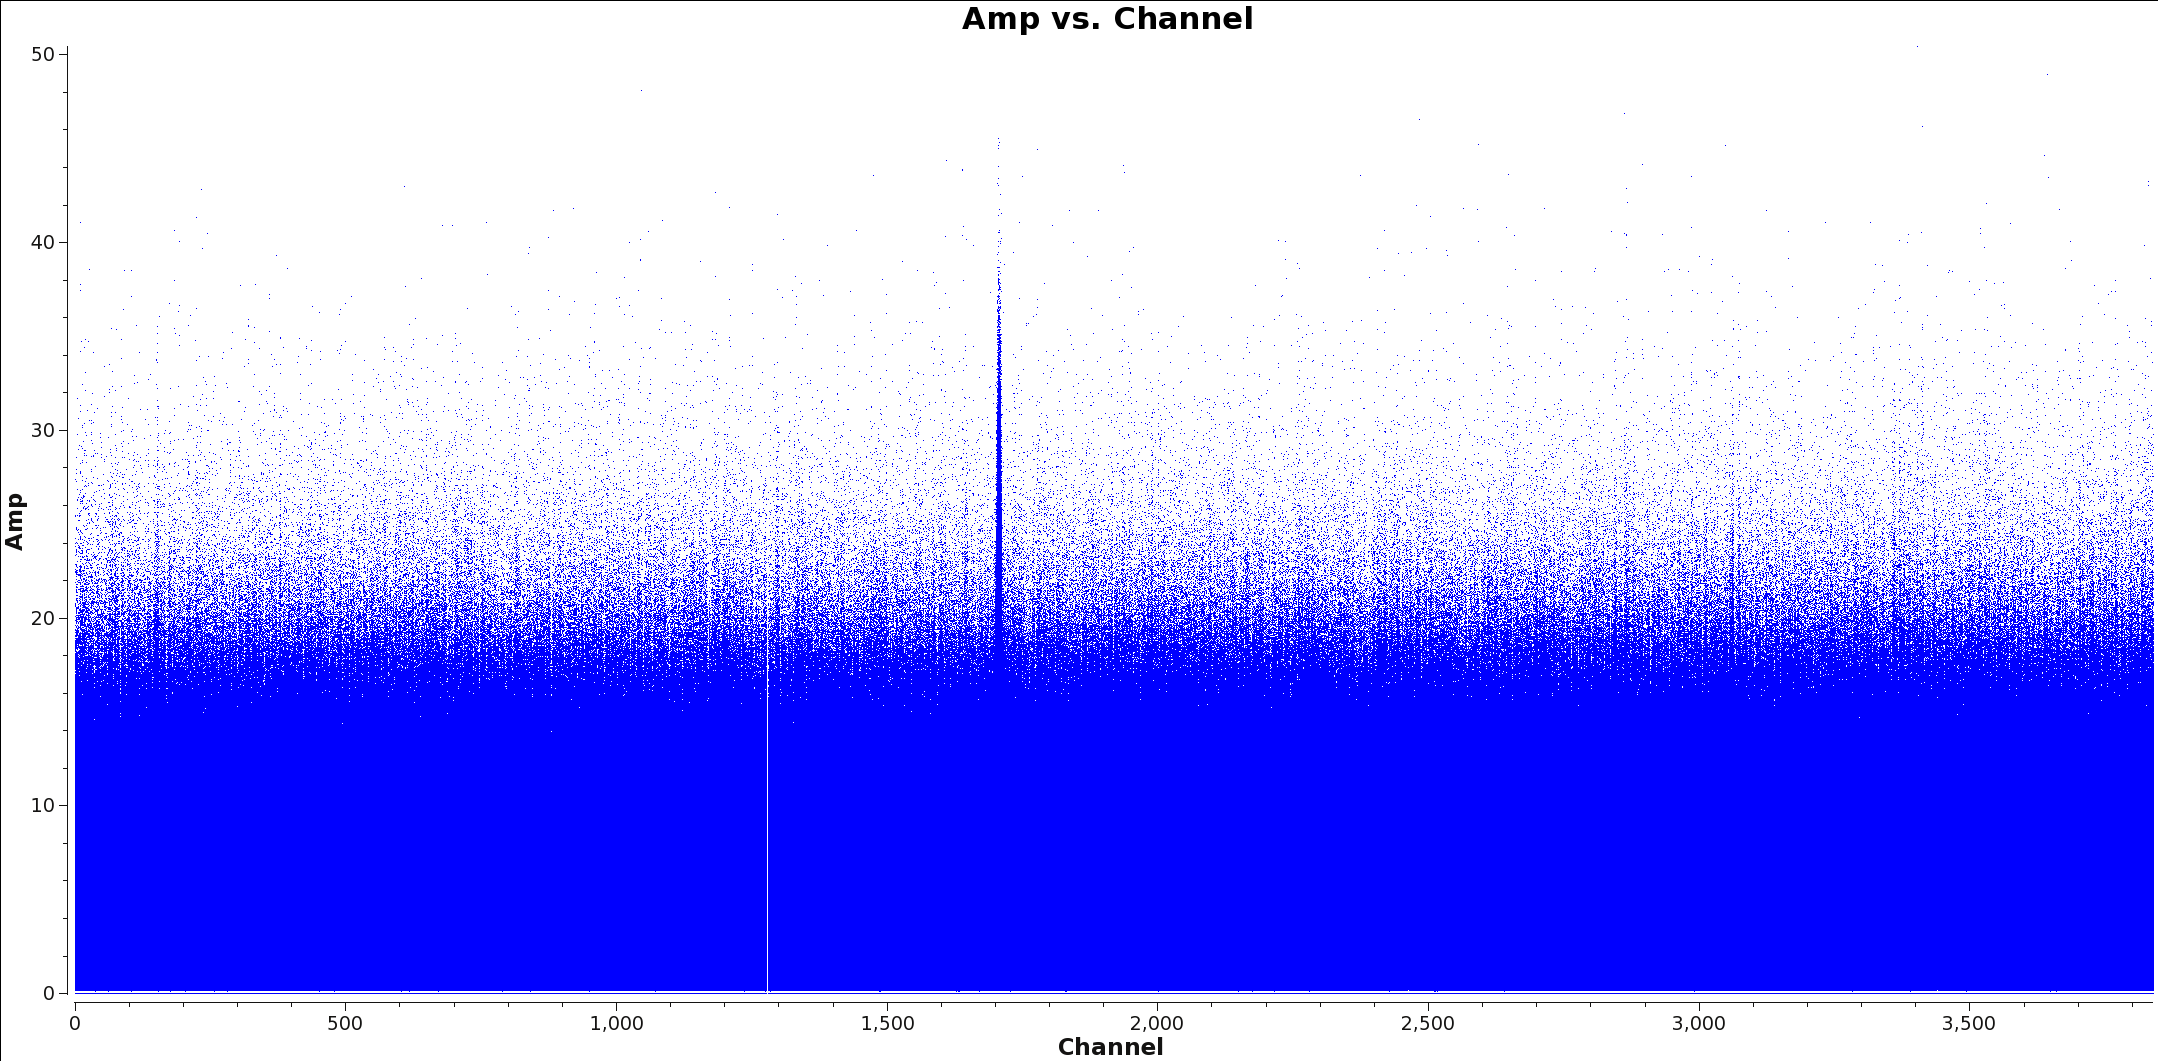
| 09:18, 5 April 2017 | Calibrated final field0 spw0 LineChannelFlagged.png (file) |  |
125 KB | Line is flagged out in spw 0 in order to create continuum only image. | 1 |
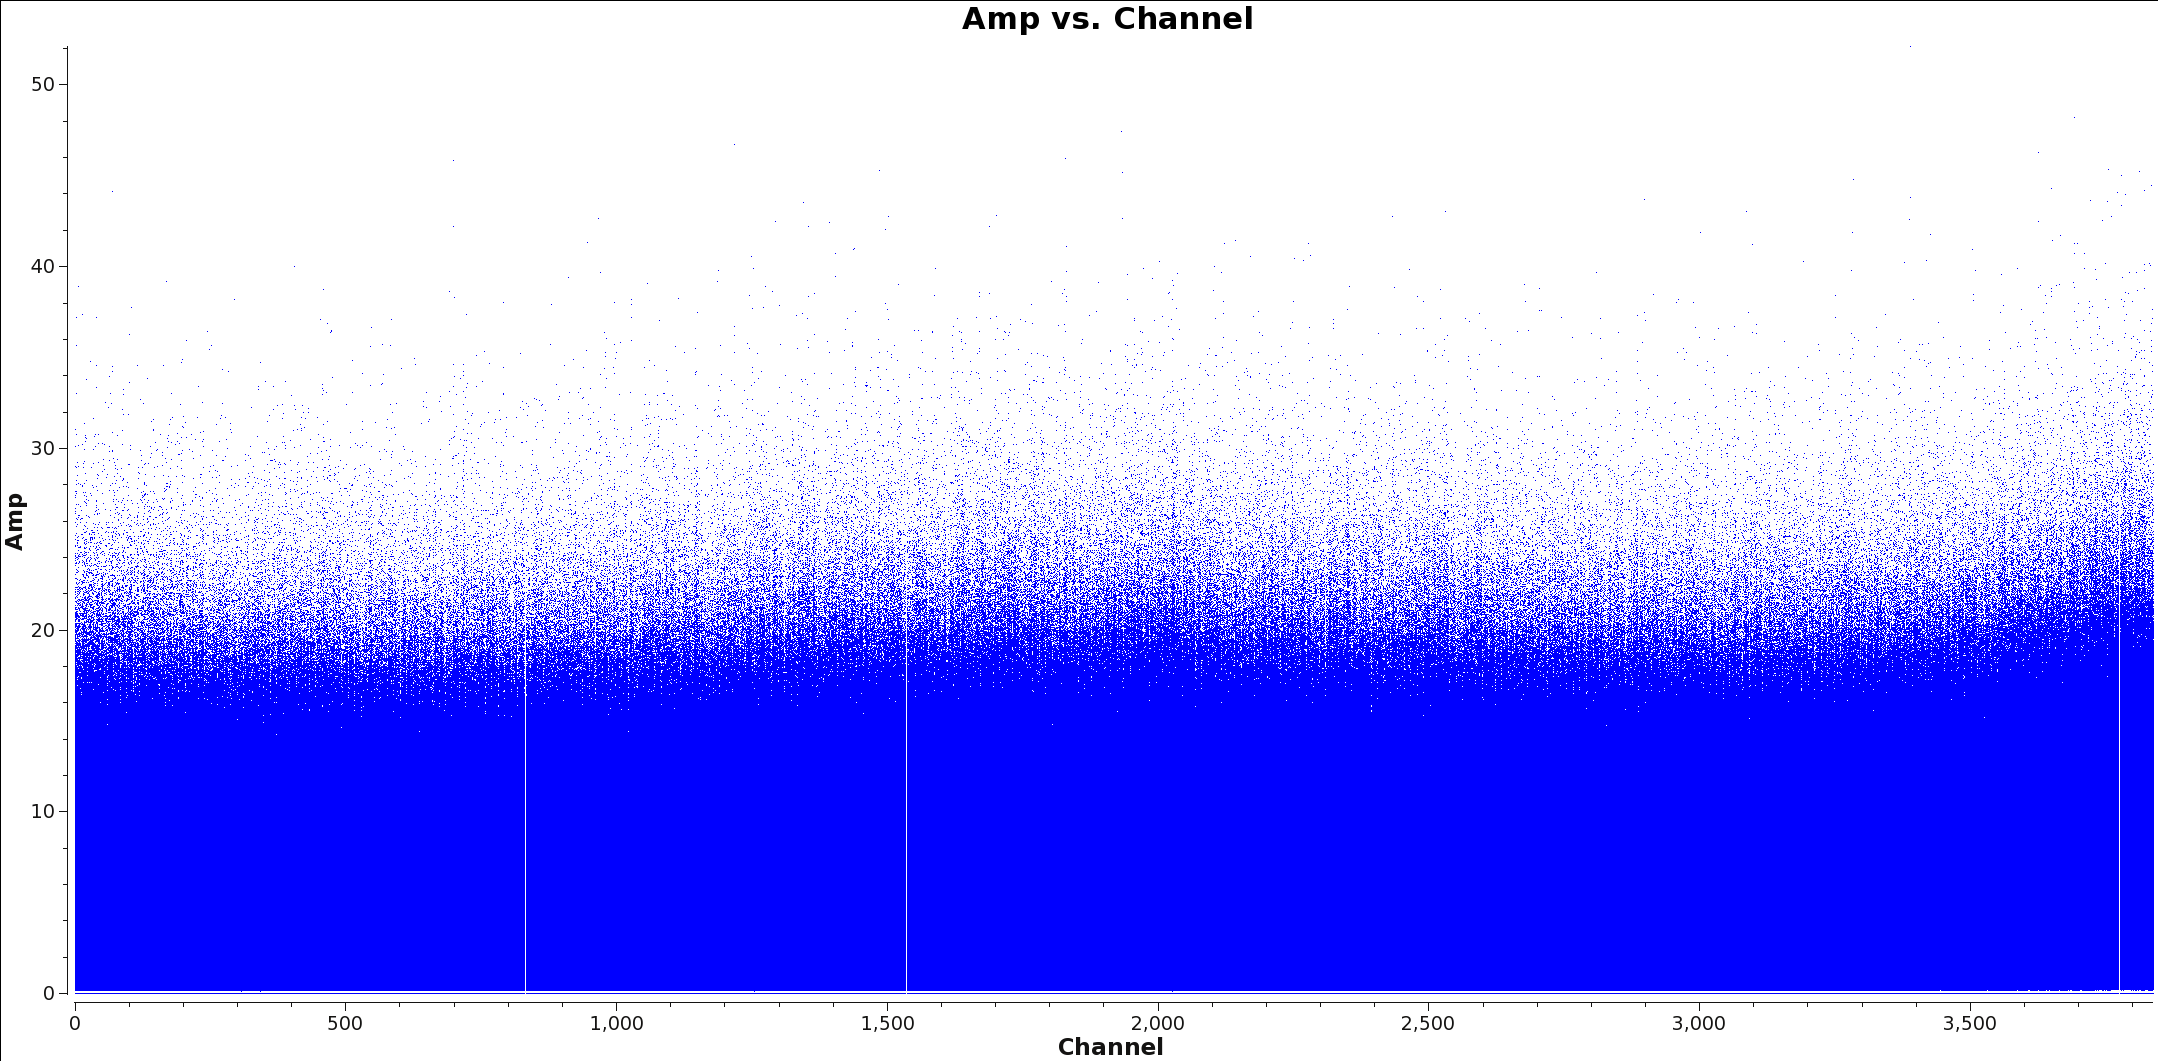
| 09:13, 5 April 2017 | Calibrated final Field0 Spw3.png (file) |  |
137 KB | Spw 3 is a continuum window and no lines are present. | 1 |
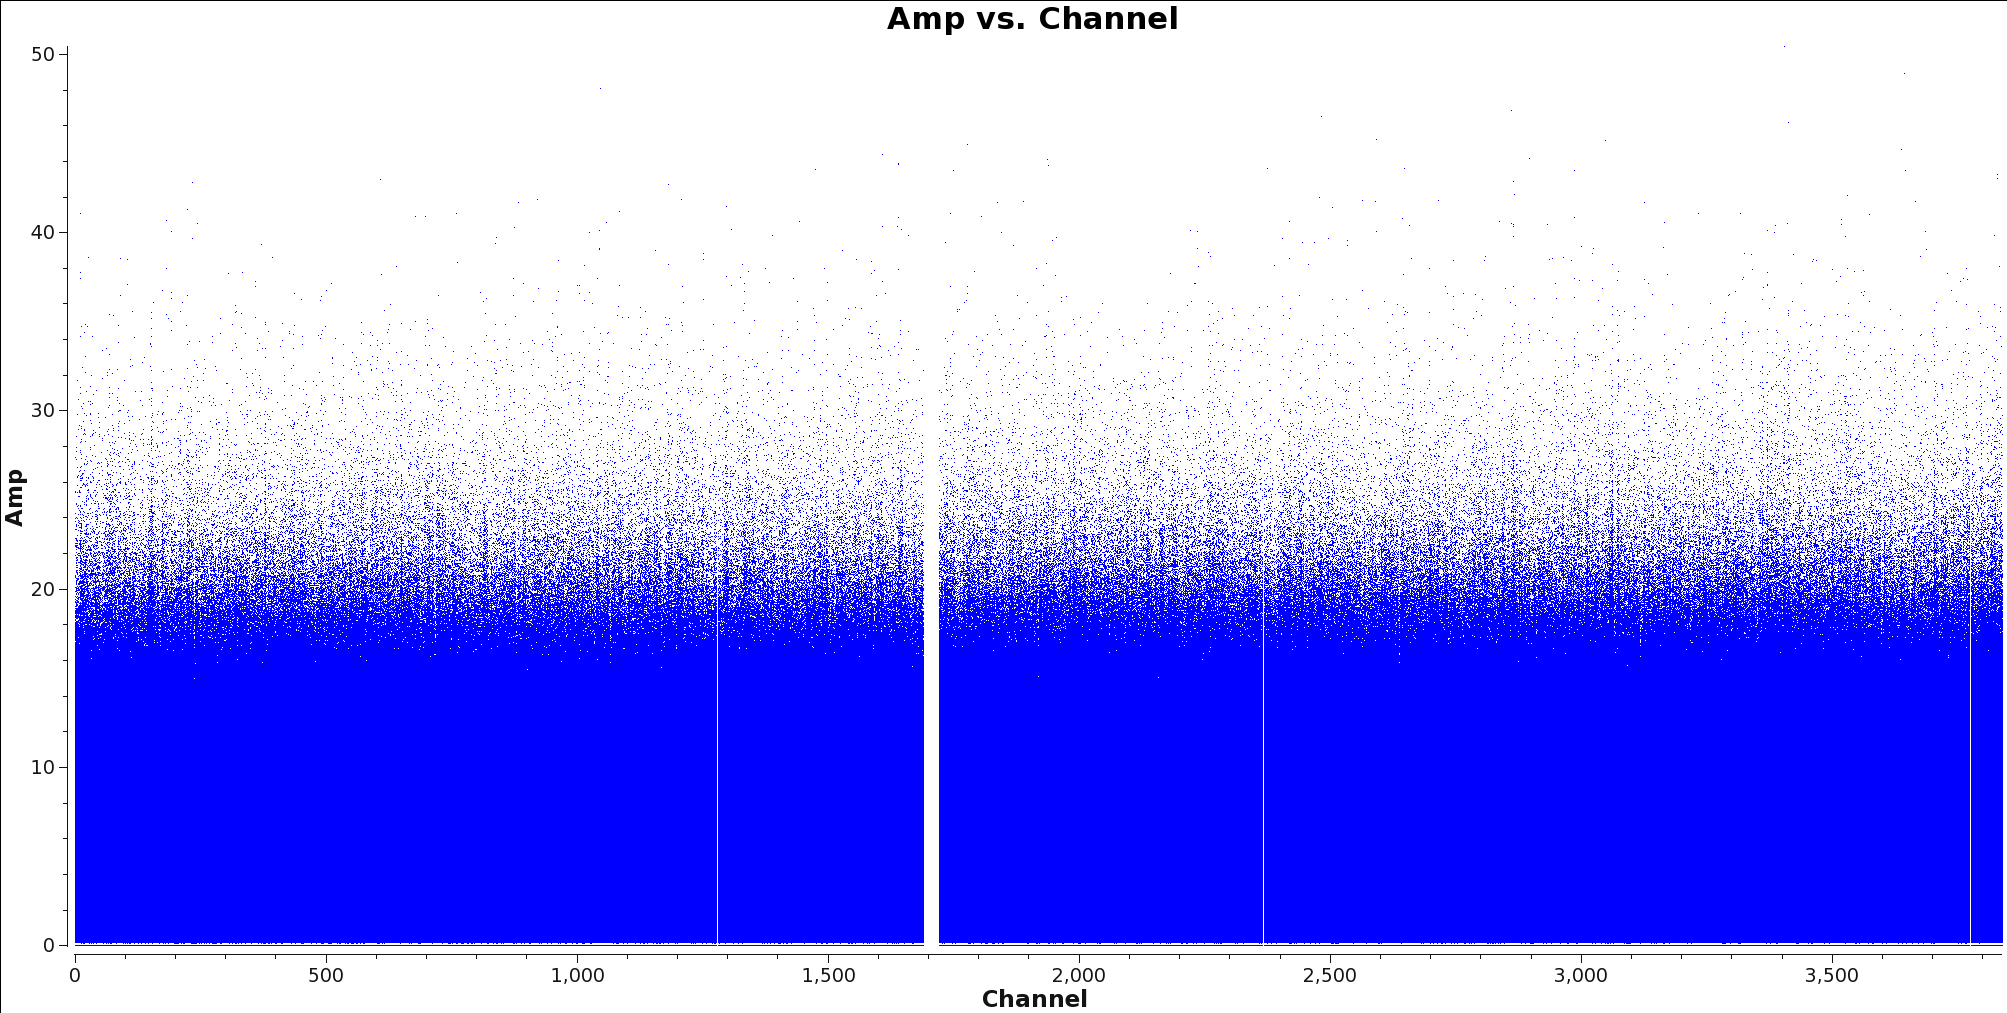
| 09:10, 5 April 2017 | Calibrated final Field0 Spw0.png (file) |  |
139 KB | TW Hydra spw 0 amp vs channel plot can be used to identify continuum channels. | 1 |
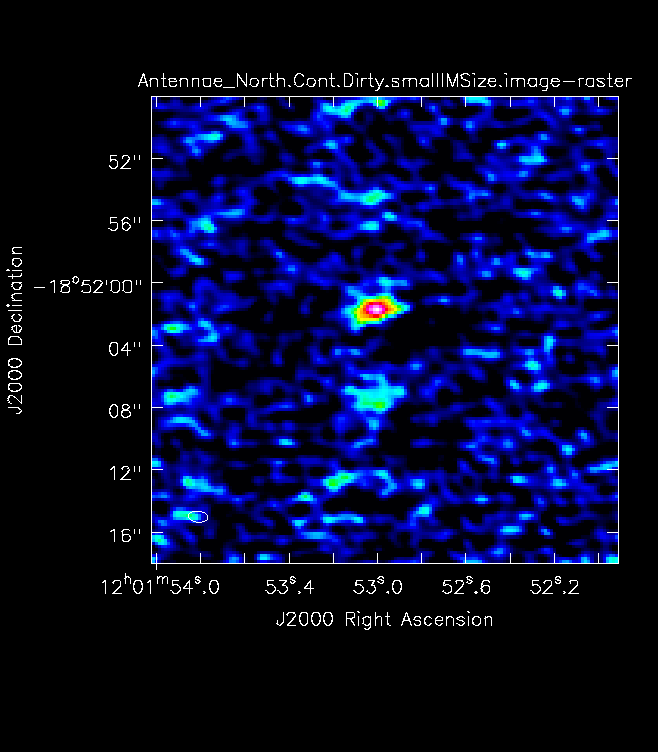
| 08:57, 5 April 2017 | Antennae North.Cont.Dirty.smallIMSize.image.png (file) |  |
45 KB | Mosaic under padded image. | 1 |
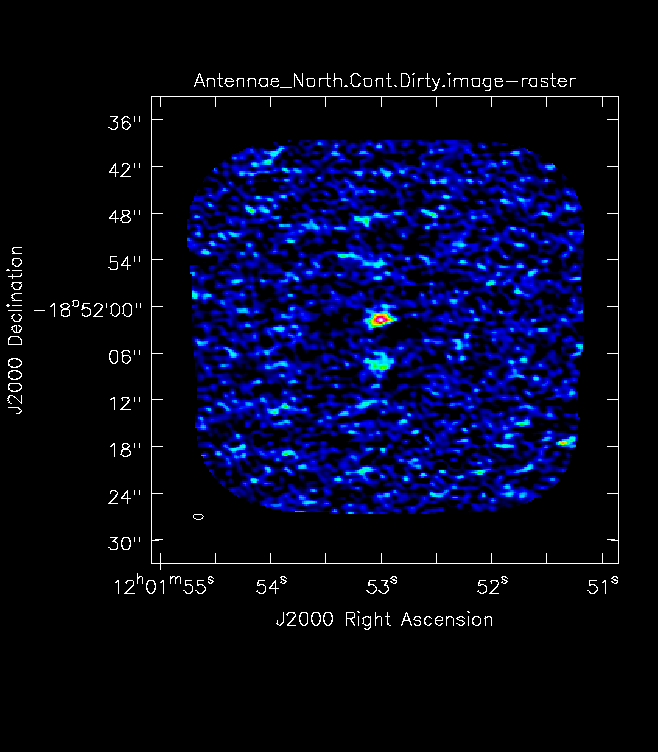
| 08:54, 5 April 2017 | Antennae Antennae North.Cont.Dirty.image.png (file) |  |
86 KB | Correctly padded mosaic image. | 1 |
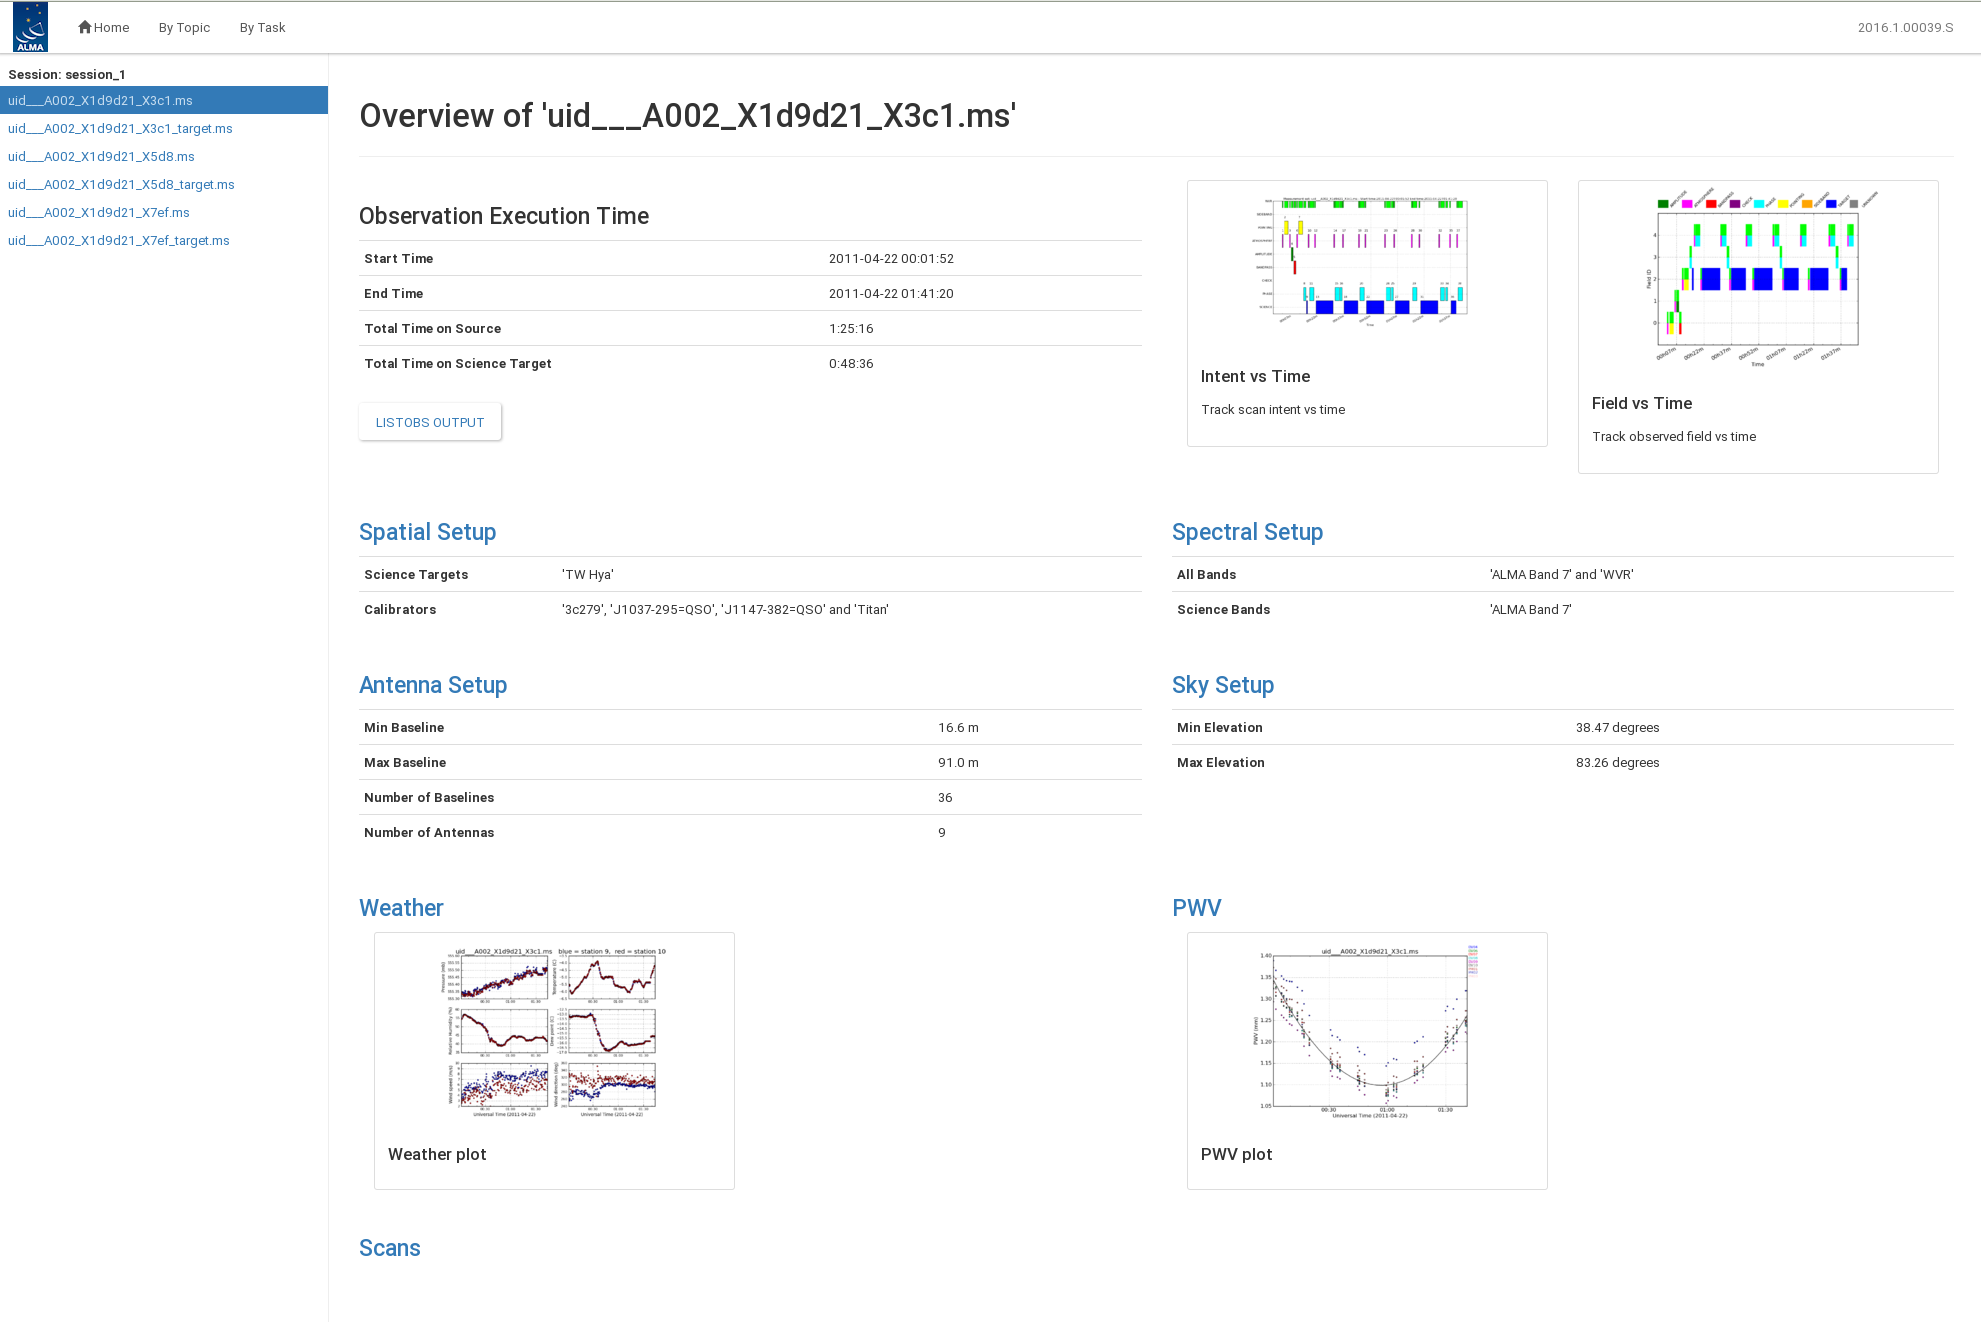
| 16:35, 4 April 2017 | Weblog MS Overview.png (file) |  |
195 KB | The MS overview page gives information about the specific execution including the calibrators, antennas, spectral setup, elevation, weather, and PWV. | 1 |
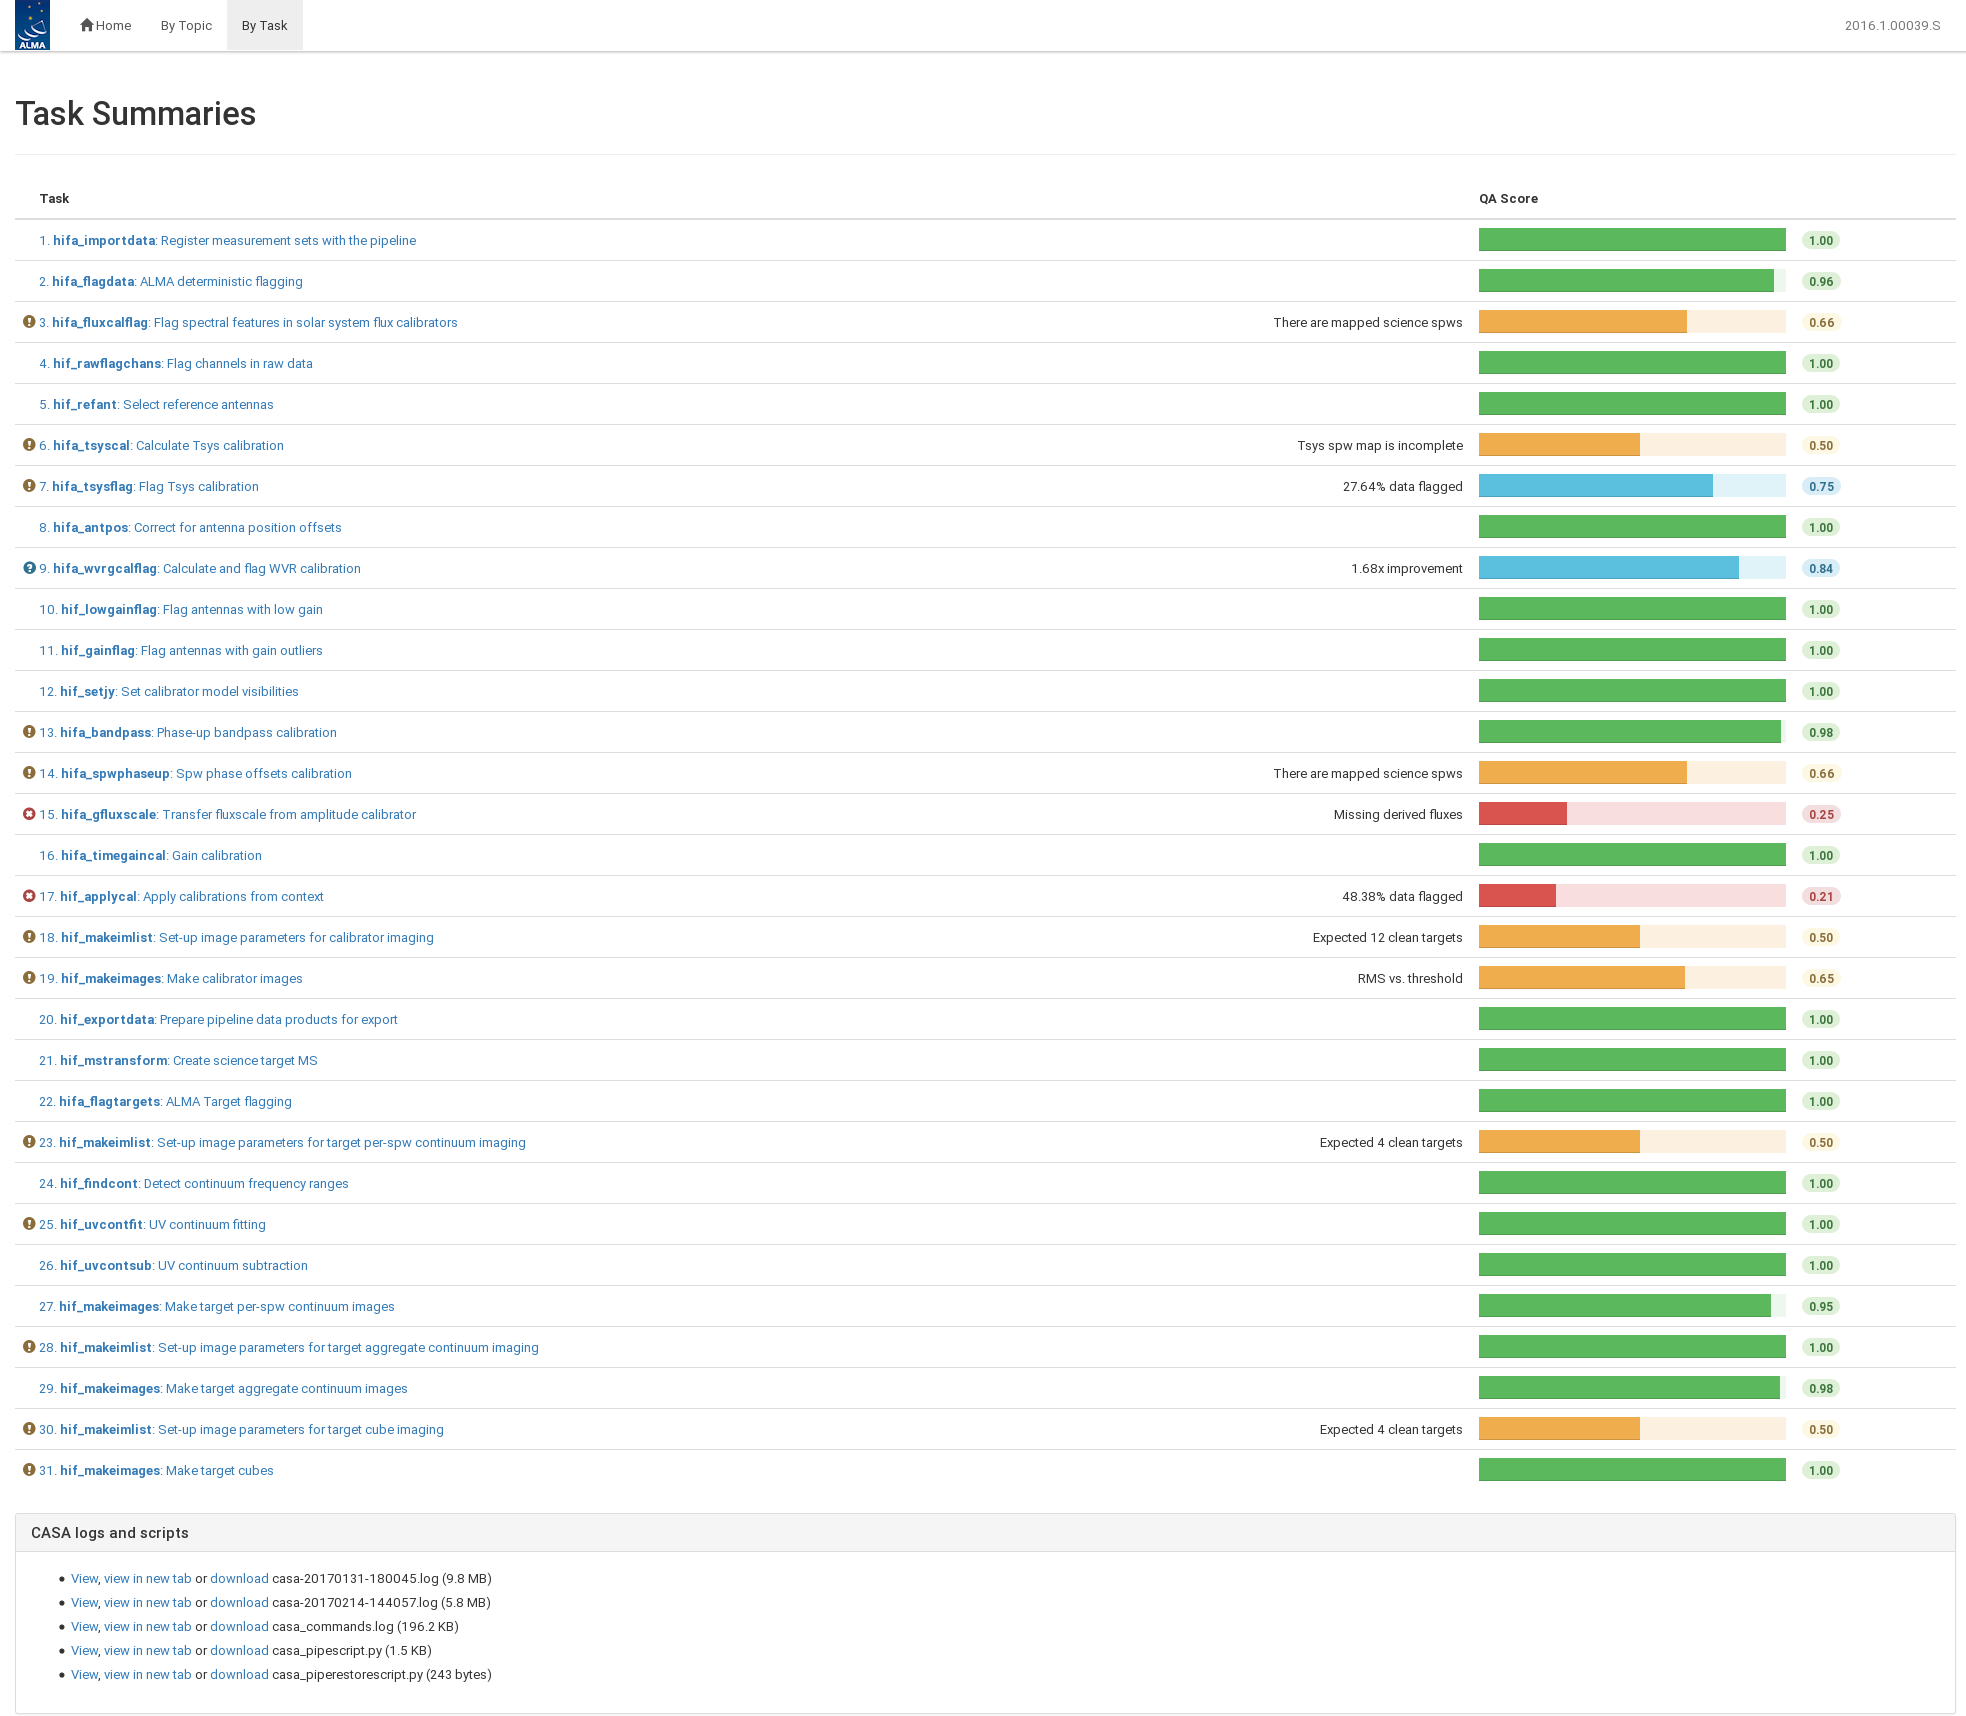
| 16:31, 4 April 2017 | Weblog By Task.png (file) |  |
194 KB | View of the calibration weblog By Task. Each task has a Quality Assurance (QA) score and can be opened via this page. | 1 |
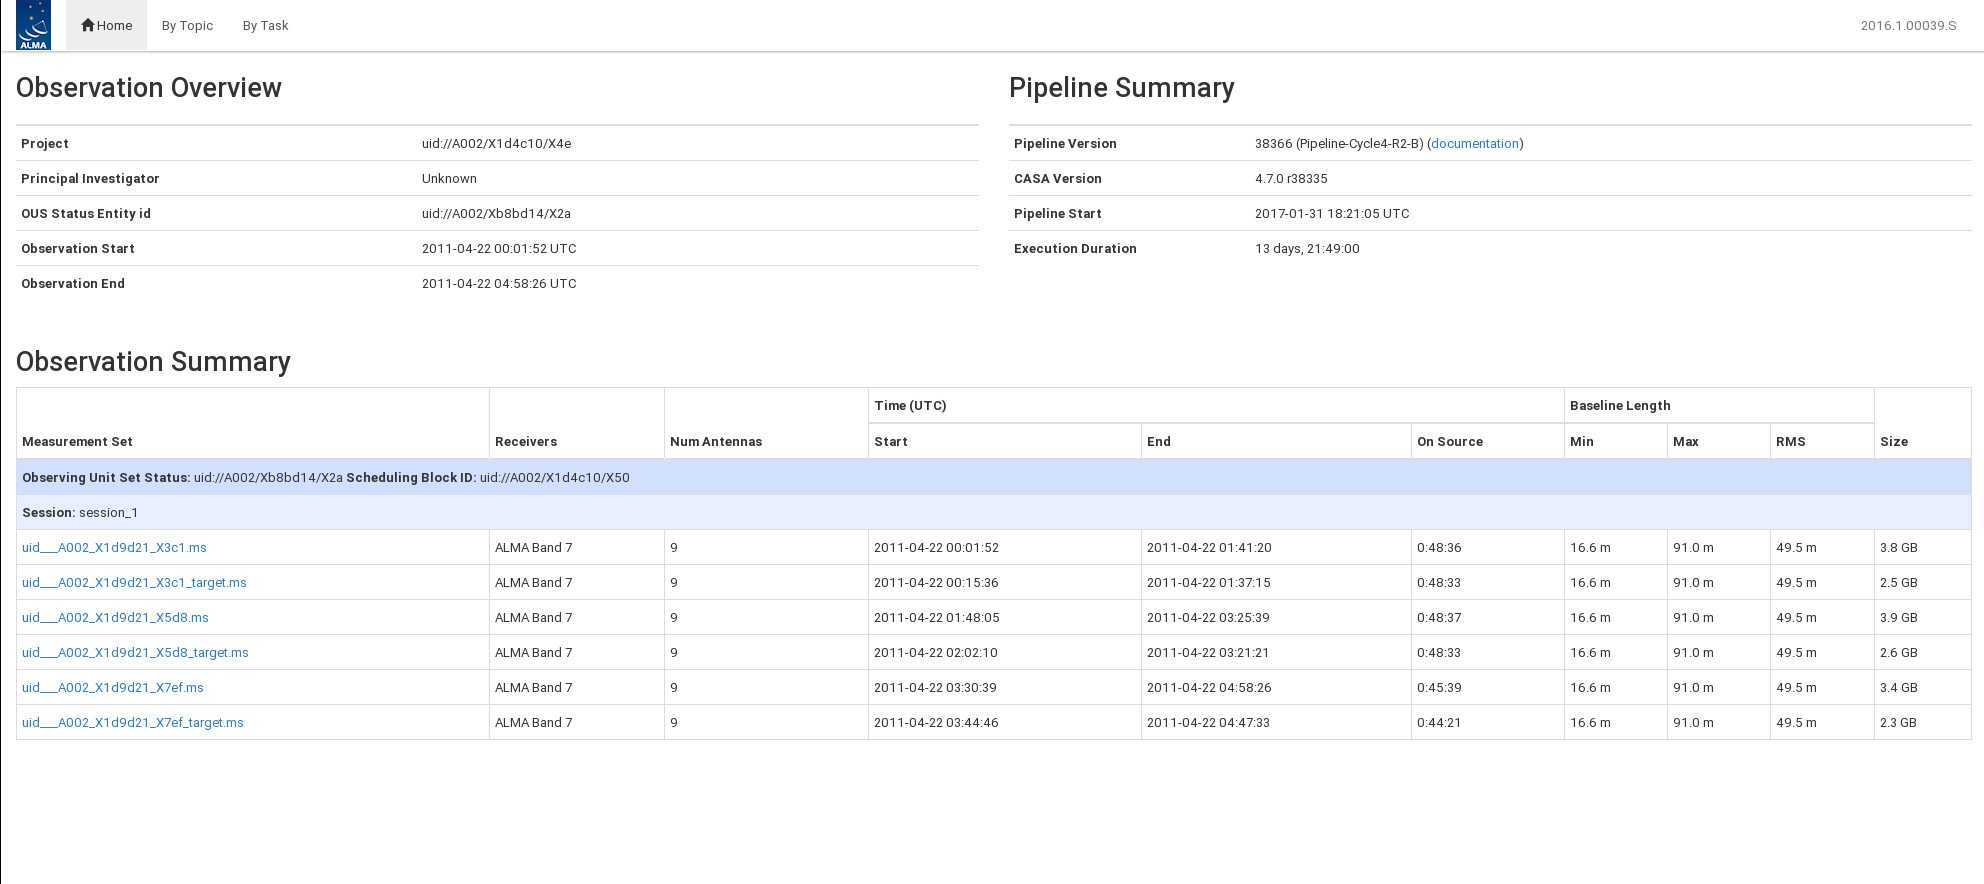
| 16:25, 4 April 2017 | Weblog Home.png (file) |  |
94 KB | The Observation Overview page gives a summary of the observations. You can find the overall details of each executions as well as the CASA version used and unique identifier of the observation. | 1 |
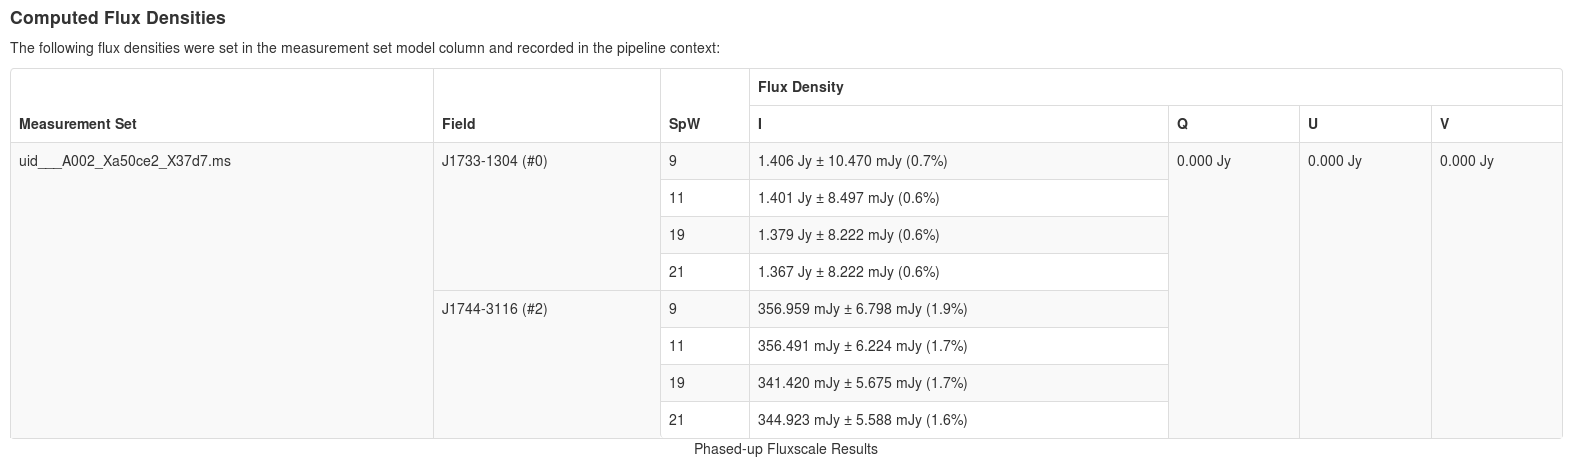
| 16:06, 4 April 2017 | Gfluxscale table.png (file) |  |
45 KB | The table produced by hif_gfluxscale. | 1 |
| 11:30, 31 March 2017 | Juno Band6 Imaging.py (file) | 29 KB | Update True/False | 2 | |
| 11:26, 31 March 2017 | Mira Band6 Imaging.py (file) | 16 KB | Update True/False | 2 | |
| 11:23, 31 March 2017 | Mira Band3 Imaging.py (file) | 27 KB | Update True/False | 2 | |
| 11:21, 31 March 2017 | HLTau Band3 Cont Imaging.py (file) | 10 KB | Update True/False | 2 | |
| 11:17, 31 March 2017 | HLTau Band6 Cont Imaging.py (file) | 10 KB | 2 | ||
| 11:09, 31 March 2017 | HLTau Band7 Cont Imaging.py (file) | 9 KB | Update True/False | 4 | |
| 09:58, 31 March 2017 | FDM.example.ms.scriptForCalibration.py (file) | 22 KB | 2 |