Plotconfig: Difference between revisions
From CASA Guides
Jump to navigationJump to search
No edit summary |
No edit summary |
||
| Line 3: | Line 3: | ||
This page documents the '''plotconfig''' function of Python module [[Analysis Utilities|analysisUtils]]. | This page documents the '''plotconfig''' function of Python module [[Analysis Utilities|analysisUtils]]. | ||
This function will make a plot of pad locations for any telescope configuration known to CASA. See also [[obslist]]. | This function will make a plot of pad locations for any standard telescope configuration known to CASA (not limited to a specific observed ms). See also [[obslist]]. | ||
==Examples== | ==Examples== | ||
Revision as of 16:46, 4 January 2012
Return to Analysis Utilities
This page documents the plotconfig function of Python module analysisUtils.
This function will make a plot of pad locations for any standard telescope configuration known to CASA (not limited to a specific observed ms). See also obslist.
Examples
List the available telescopes and configurations.
# In CASA
au.plotconfig()
Telescope and configuration available to plot:
aca: i, ns, tp
alma: cycle0.compact, cycle0.extended, 1..28
carma: a, b, c, d, e
meerkat
pdbi: a, b, c, d
sma: subcompact, compact, compact.n, extended, vextended
vla: a, bna, b, cnb, c, dnc, d
WSRT
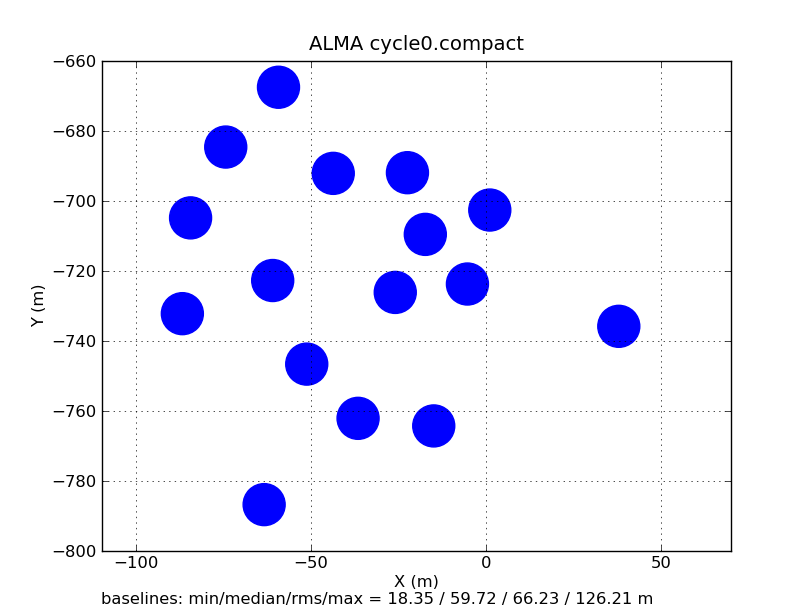
Plot the antenna pad locations for the ALMA Cycle 0 compact configuration.
# In CASA
au.plotconfig('alma','cycle0.compact',figfile=True)
Read 16 pads
Wrote file = ALMA.cycle0.compact.png
