File:Vlba casacal accor smoothBRplot1.png
From CASA Guides
Jump to navigationJump to search
Size of this preview: 800 × 488 pixels. Other resolution: 1,024 × 625 pixels.
Original file (1,024 × 625 pixels, file size: 92 KB, MIME type: image/png)
Summary
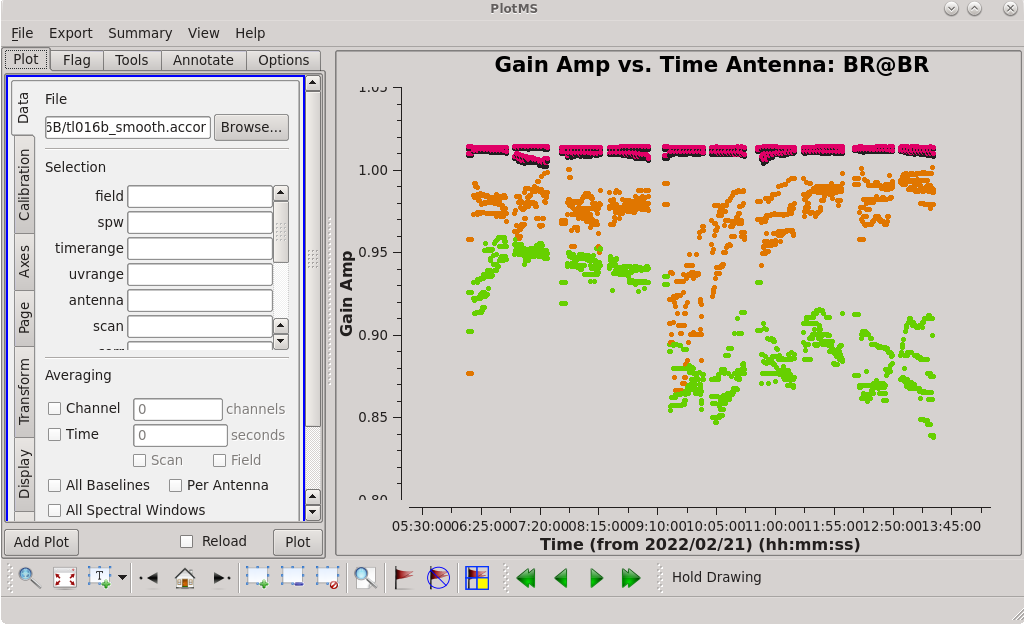
VLBA CASA Guide, Calibrating the Data, Amplitude Corrections from Autocorrelations. Plot of the smoothed accor solution table, gain amplitude vs time. Note that there are fewer outliers in the smoothed table than in the unsmoothed table.
File history
Click on a date/time to view the file as it appeared at that time.
| Date/Time | Thumbnail | Dimensions | User | Comment | |
|---|---|---|---|---|---|
| current | 16:08, 28 March 2022 | | 1,024 × 625 (92 KB) | Jlinford (talk | contribs) | VLBA CASA Guide, plot of smoothed accor solution table |
You cannot overwrite this file.
File usage
The following 2 pages use this file: