File:Vlba casacal accorBRplot1.png
From CASA Guides
Jump to navigationJump to search

Size of this preview: 800 × 489 pixels. Other resolution: 1,019 × 623 pixels.
Original file (1,019 × 623 pixels, file size: 91 KB, MIME type: image/png)
Summary
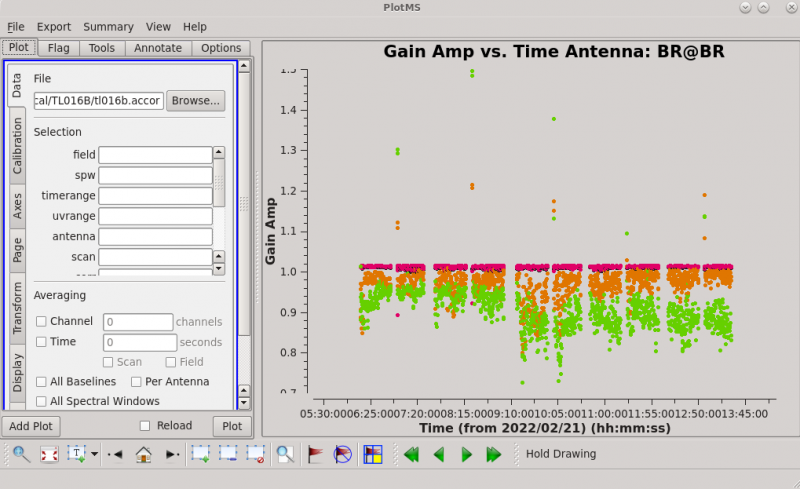
VLBA CASA Guide, Calibrating the Data, Amplitude Corrections from Autocorrelations. Plot of accor solution table, gain amplitude vs time, BR. Notice that most solutions are near 1.0, but there are also several outliers.
File history
Click on a date/time to view the file as it appeared at that time.
| Date/Time | Thumbnail | Dimensions | User | Comment | |
|---|---|---|---|---|---|
| current | 16:07, 28 March 2022 |  | 1,019 × 623 (91 KB) | Jlinford (talk | contribs) | VLBA CASA Guide, plot of accor solution table |
You cannot overwrite this file.
File usage
The following 2 pages use this file: