File:Spec Pband plot.png
From CASA Guides
Jump to navigationJump to search
Size of this preview: 713 × 600 pixels. Other resolution: 996 × 838 pixels.
Original file (996 × 838 pixels, file size: 73 KB, MIME type: image/png)
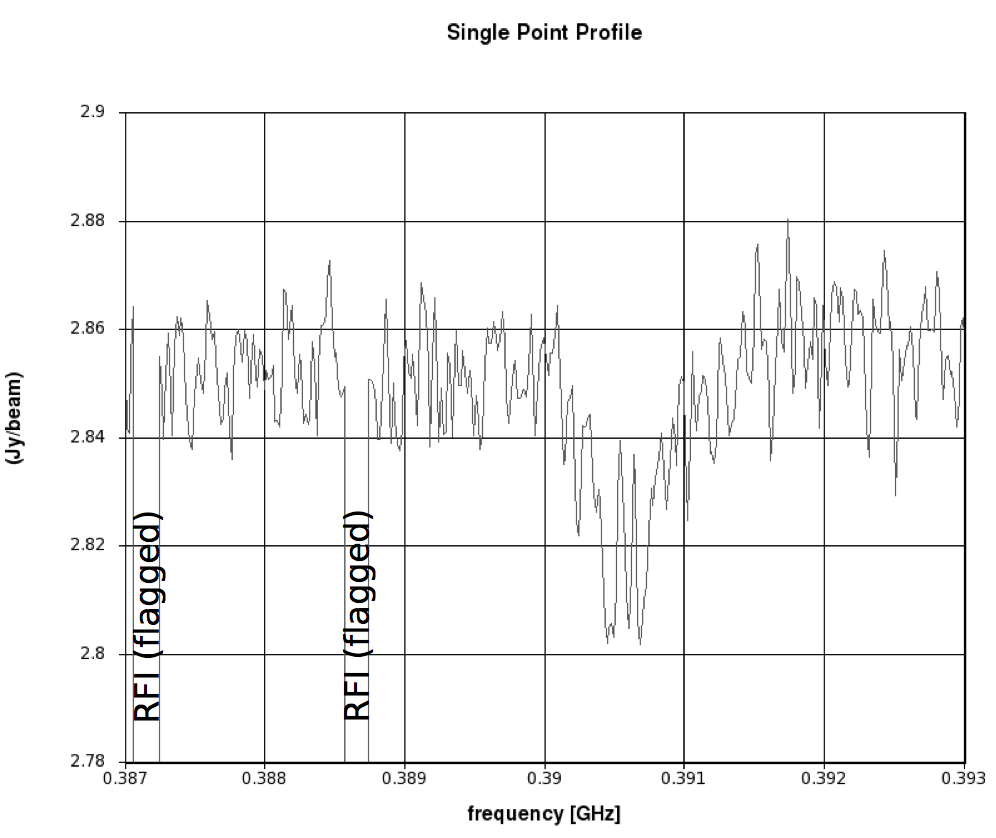
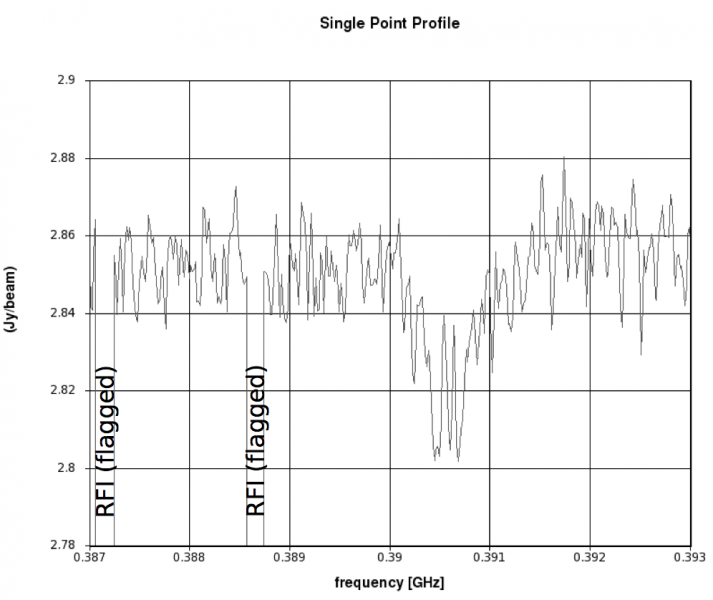
Fig.9. Test-data of the redshifted HI 21cm absorption line on top of the radio continuum in MG 0414+0354; see More, Carilli & Mention 1999 (Apj, 510, 87) for the original detection.
File history
Click on a date/time to view the file as it appeared at that time.
| Date/Time | Thumbnail | Dimensions | User | Comment | |
|---|---|---|---|---|---|
| current | 15:50, 18 August 2017 | | 996 × 838 (73 KB) | Bemonts (talk | contribs) | Fig.9. Test-data of the redshifted HI 21cm absorption line on top of the radio continuum in MG 0414+0354; see More, Carilli & Mention 1999 (Apj, 510, 87) for the original detection. |
You cannot overwrite this file.
File usage
The following 2 pages use this file: