File:Showatm.DV02.spw1.t3.png
From CASA Guides
Jump to navigationJump to search

Size of this preview: 794 × 600 pixels. Other resolution: 1,635 × 1,235 pixels.
Original file (1,635 × 1,235 pixels, file size: 145 KB, MIME type: image/png)
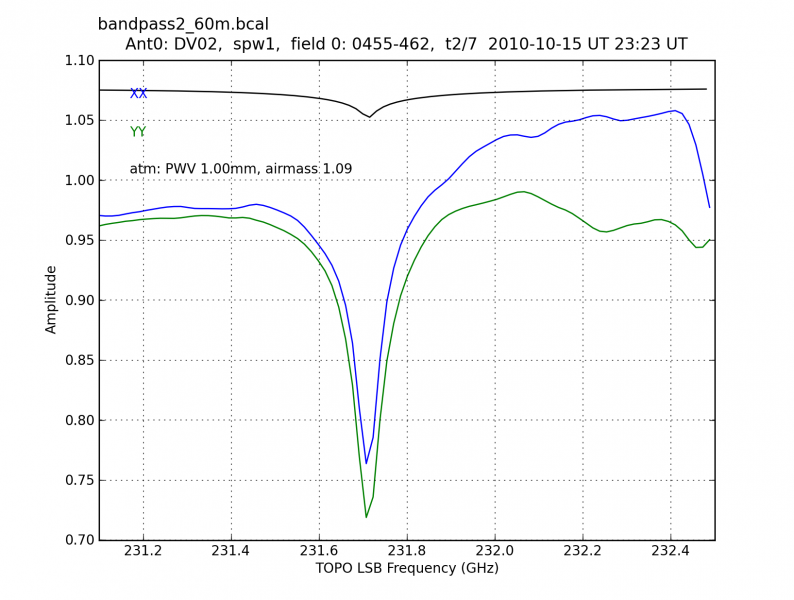
Use analysisUtils.plotbandpass to overlay the atmospheric transmission curve.
File history
Click on a date/time to view the file as it appeared at that time.
| Date/Time | Thumbnail | Dimensions | User | Comment | |
|---|---|---|---|---|---|
| current | 12:29, 4 January 2012 | | 1,635 × 1,235 (145 KB) | Jcrossle (talk | contribs) | Use analysisUtils.plotbandpass to overlay the atmospheric transmission curve. |
You cannot overwrite this file.
File usage
The following page uses this file: