File:Plotms amp vs time south.png
From CASA Guides
Jump to navigationJump to search
No higher resolution available.
Plotms_amp_vs_time_south.png (790 × 573 pixels, file size: 28 KB, MIME type: image/png)
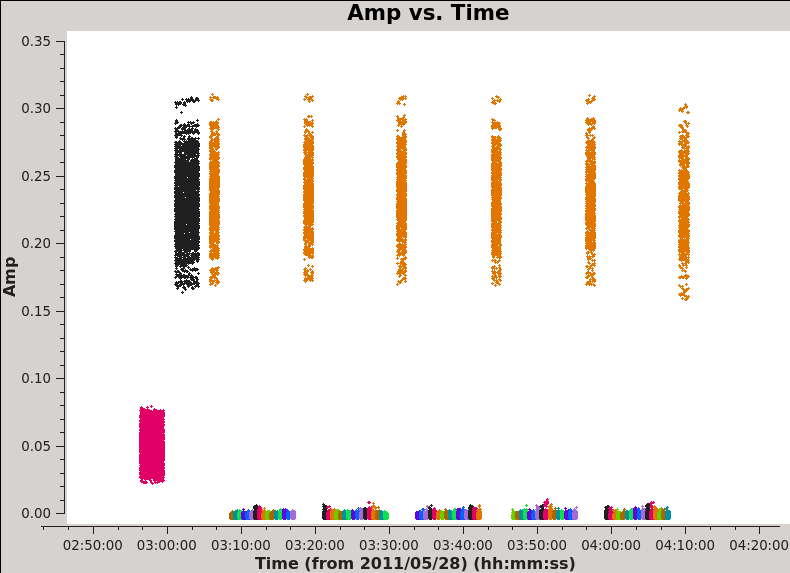
Amplitude vs. time for first Southern Mosaic data set.
File history
Click on a date/time to view the file as it appeared at that time.
| Date/Time | Thumbnail | Dimensions | User | Comment | |
|---|---|---|---|---|---|
| current | 10:36, 23 September 2020 | | 790 × 573 (28 KB) | Dkim (talk | contribs) | |
| 11:48, 5 August 2011 | 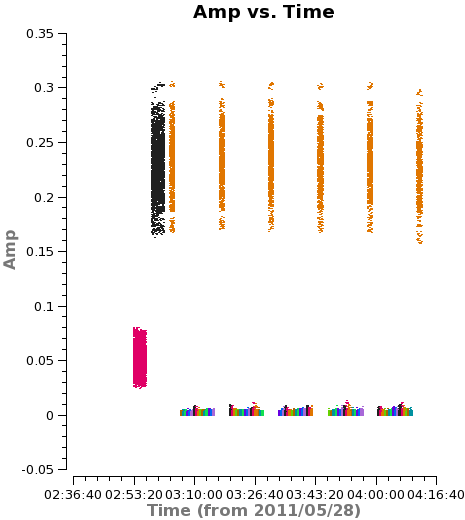 | 465 × 520 (16 KB) | Aleroy (talk | contribs) | Amplitude vs. time for first Southern Mosaic data set. |
You cannot overwrite this file.
File usage
The following file is a duplicate of this file (more details):
The following 10 pages use this file:
- AntennaeBand7 Calibration 3.4
- AntennaeBand7 Calibration 4.0
- AntennaeBand7 Calibration 4.1
- AntennaeBand7 Calibration 4.2
- AntennaeBand7 Calibration 4.3
- AntennaeBand7 Calibration 4.4
- AntennaeBand7 Calibration 4.5
- AntennaeBand7 Calibration 5.1
- AntennaeBand7 Calibration 5.4
- Antennae Band7 - Calibration for CASA 3.3