File:Pband delaycal.png
From CASA Guides
Jump to navigationJump to search
Size of this preview: 796 × 600 pixels. Other resolution: 812 × 612 pixels.
Original file (812 × 612 pixels, file size: 20 KB, MIME type: image/png)
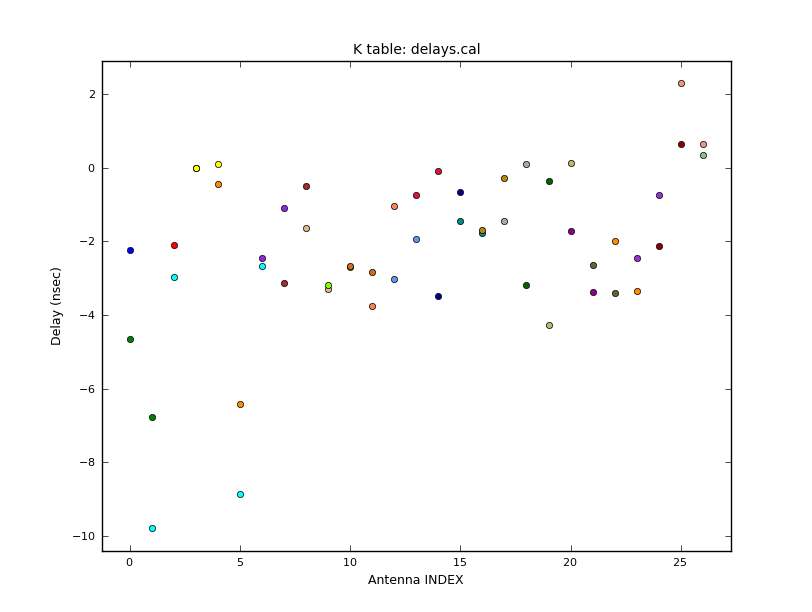
Fig.4. Delays for each antenna and each polarization. Plot made with ‘plotcal’
File history
Click on a date/time to view the file as it appeared at that time.
| Date/Time | Thumbnail | Dimensions | User | Comment | |
|---|---|---|---|---|---|
| current | 15:47, 18 August 2017 | | 812 × 612 (20 KB) | Bemonts (talk | contribs) | Fig.4. Delays for each antenna and each polarization. Plot made with ‘plotcal’ |
You cannot overwrite this file.
File usage
The following page uses this file: