File:Pband ampcal.png: Difference between revisions
From CASA Guides
Jump to navigationJump to search
(Fig.7. Effects of amplitude and flux calibration. The corrections were applied using the task “applycal” (we do not need to do this until we obtained all remaining calibration tables -- see below for details). The various colors show the different...) |
(No difference)
|
Latest revision as of 16:38, 18 August 2017
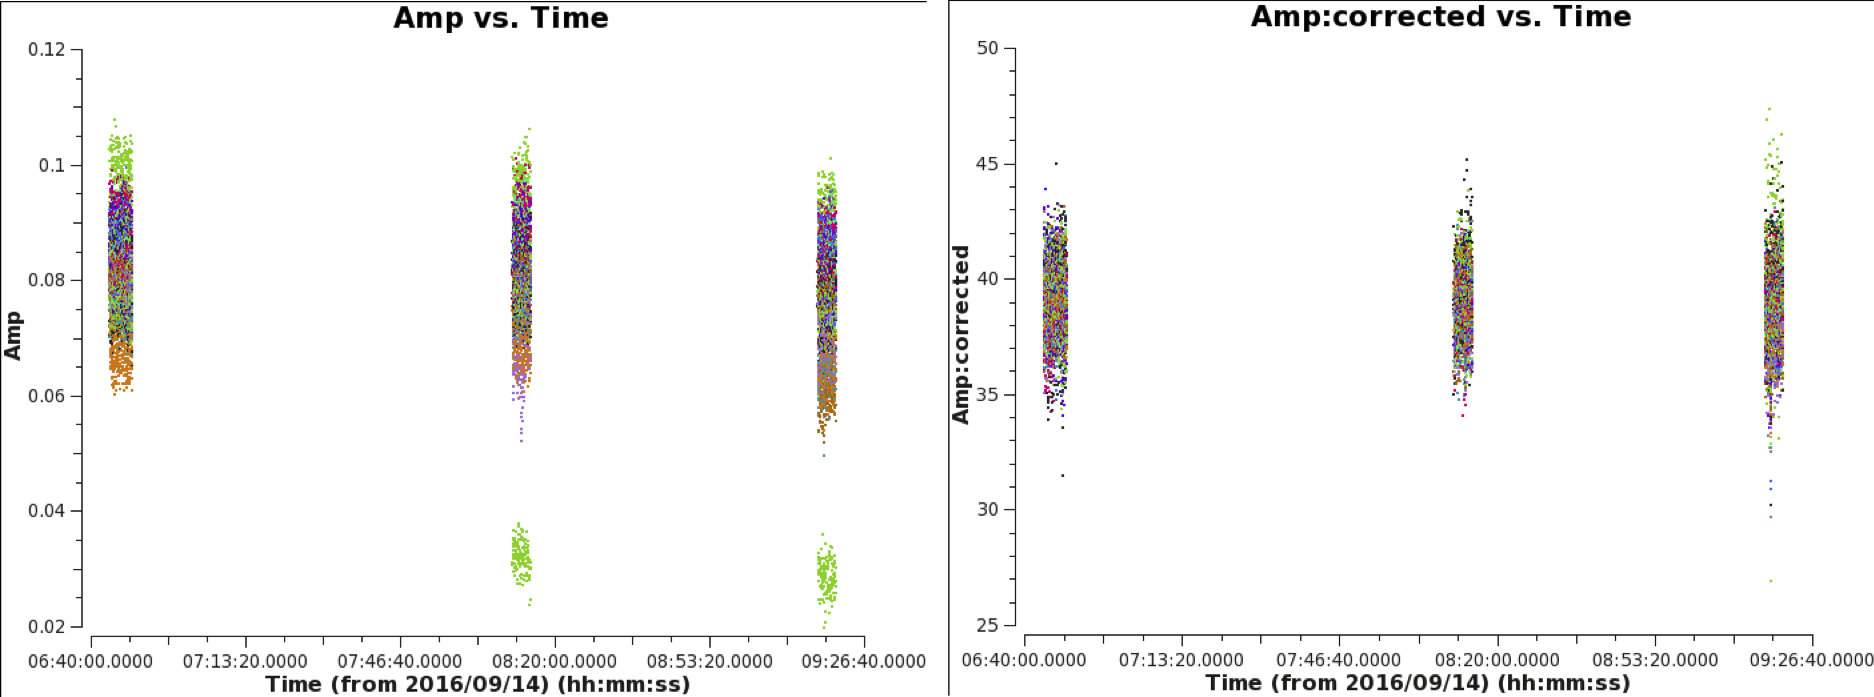
Fig.7. Effects of amplitude and flux calibration. The corrections were applied using the task “applycal” (we do not need to do this until we obtained all remaining calibration tables -- see below for details). The various colors show the different baselines with reference antenna ca04. The green points are the YY products on an offending antenna ea17, which we will flag in our target data.
File history
Click on a date/time to view the file as it appeared at that time.
| Date/Time | Thumbnail | Dimensions | User | Comment | |
|---|---|---|---|---|---|
| current | 16:38, 18 August 2017 | 1,874 × 697 (197 KB) | Bemonts (talk | contribs) | Fig.7. Effects of amplitude and flux calibration. The corrections were applied using the task “applycal” (we do not need to do this until we obtained all remaining calibration tables -- see below for details). The various colors show the different... |
You cannot overwrite this file.
File usage
There are no pages that use this file.