File:Pband TECIM.png: Difference between revisions
From CASA Guides
Jump to navigationJump to search
(Figure for P-band spectral-line guide) |
No edit summary |
||
| Line 1: | Line 1: | ||
Fig.3 Total Electron Content (TEC) as functions of time for the day and location of the observations. The time of the observing run is shown in red. | |||
Latest revision as of 15:42, 18 August 2017
Fig.3 Total Electron Content (TEC) as functions of time for the day and location of the observations. The time of the observing run is shown in red.
File history
Click on a date/time to view the file as it appeared at that time.
| Date/Time | Thumbnail | Dimensions | User | Comment | |
|---|---|---|---|---|---|
| current | 15:40, 18 August 2017 | 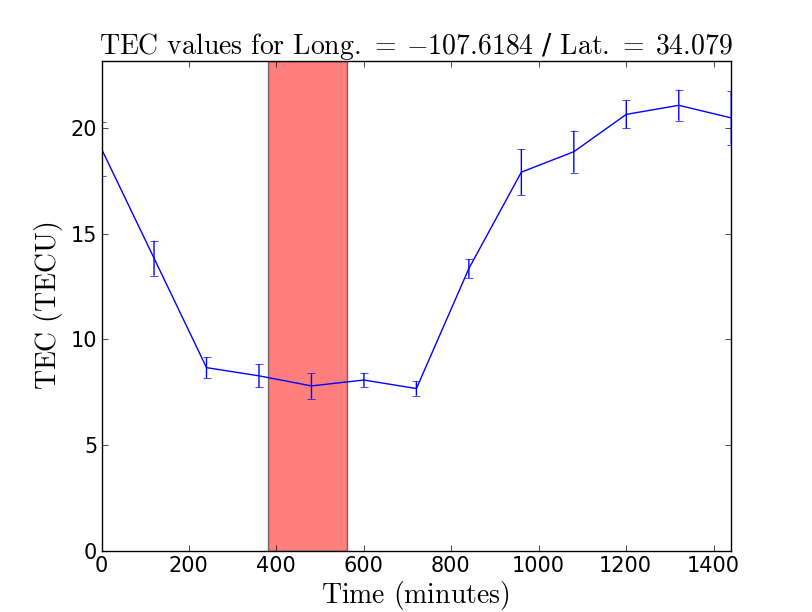 | 812 × 612 (38 KB) | Bemonts (talk | contribs) | Figure for P-band spectral-line guide |
You cannot overwrite this file.
File usage
The following 8 pages use this file:
- MG0414+0534 P-band Spectral Line Tutorial - CASA 5.0.0
- MG0414+0534 P-band Spectral Line Tutorial - CASA 5.4.0
- MG0414+0534 P-band Spectral Line Tutorial - CASA 5.5.0
- MG0414+0534 P-band Spectral Line Tutorial - CASA 5.7.2
- MG0414+0534 P-band Spectral Line Tutorial - CASA 6.2.0
- MG0414+0534 P-band Spectral Line Tutorial - CASA 6.5.2
- MG0414+0534 P-band Spectral Line Tutorial - CASA 6.5.4
- MG0414+0534 P-band Spectral Line Tutorial - CASA 6.5.4 MG0414 0534 P-band Spectral Line Tutorial (CASA 6.5.4)