File:Pband BPcal final.png
From CASA Guides
Jump to navigationJump to search
Size of this preview: 778 × 600 pixels. Other resolution: 1,898 × 1,463 pixels.
Original file (1,898 × 1,463 pixels, file size: 2.77 MB, MIME type: image/png)
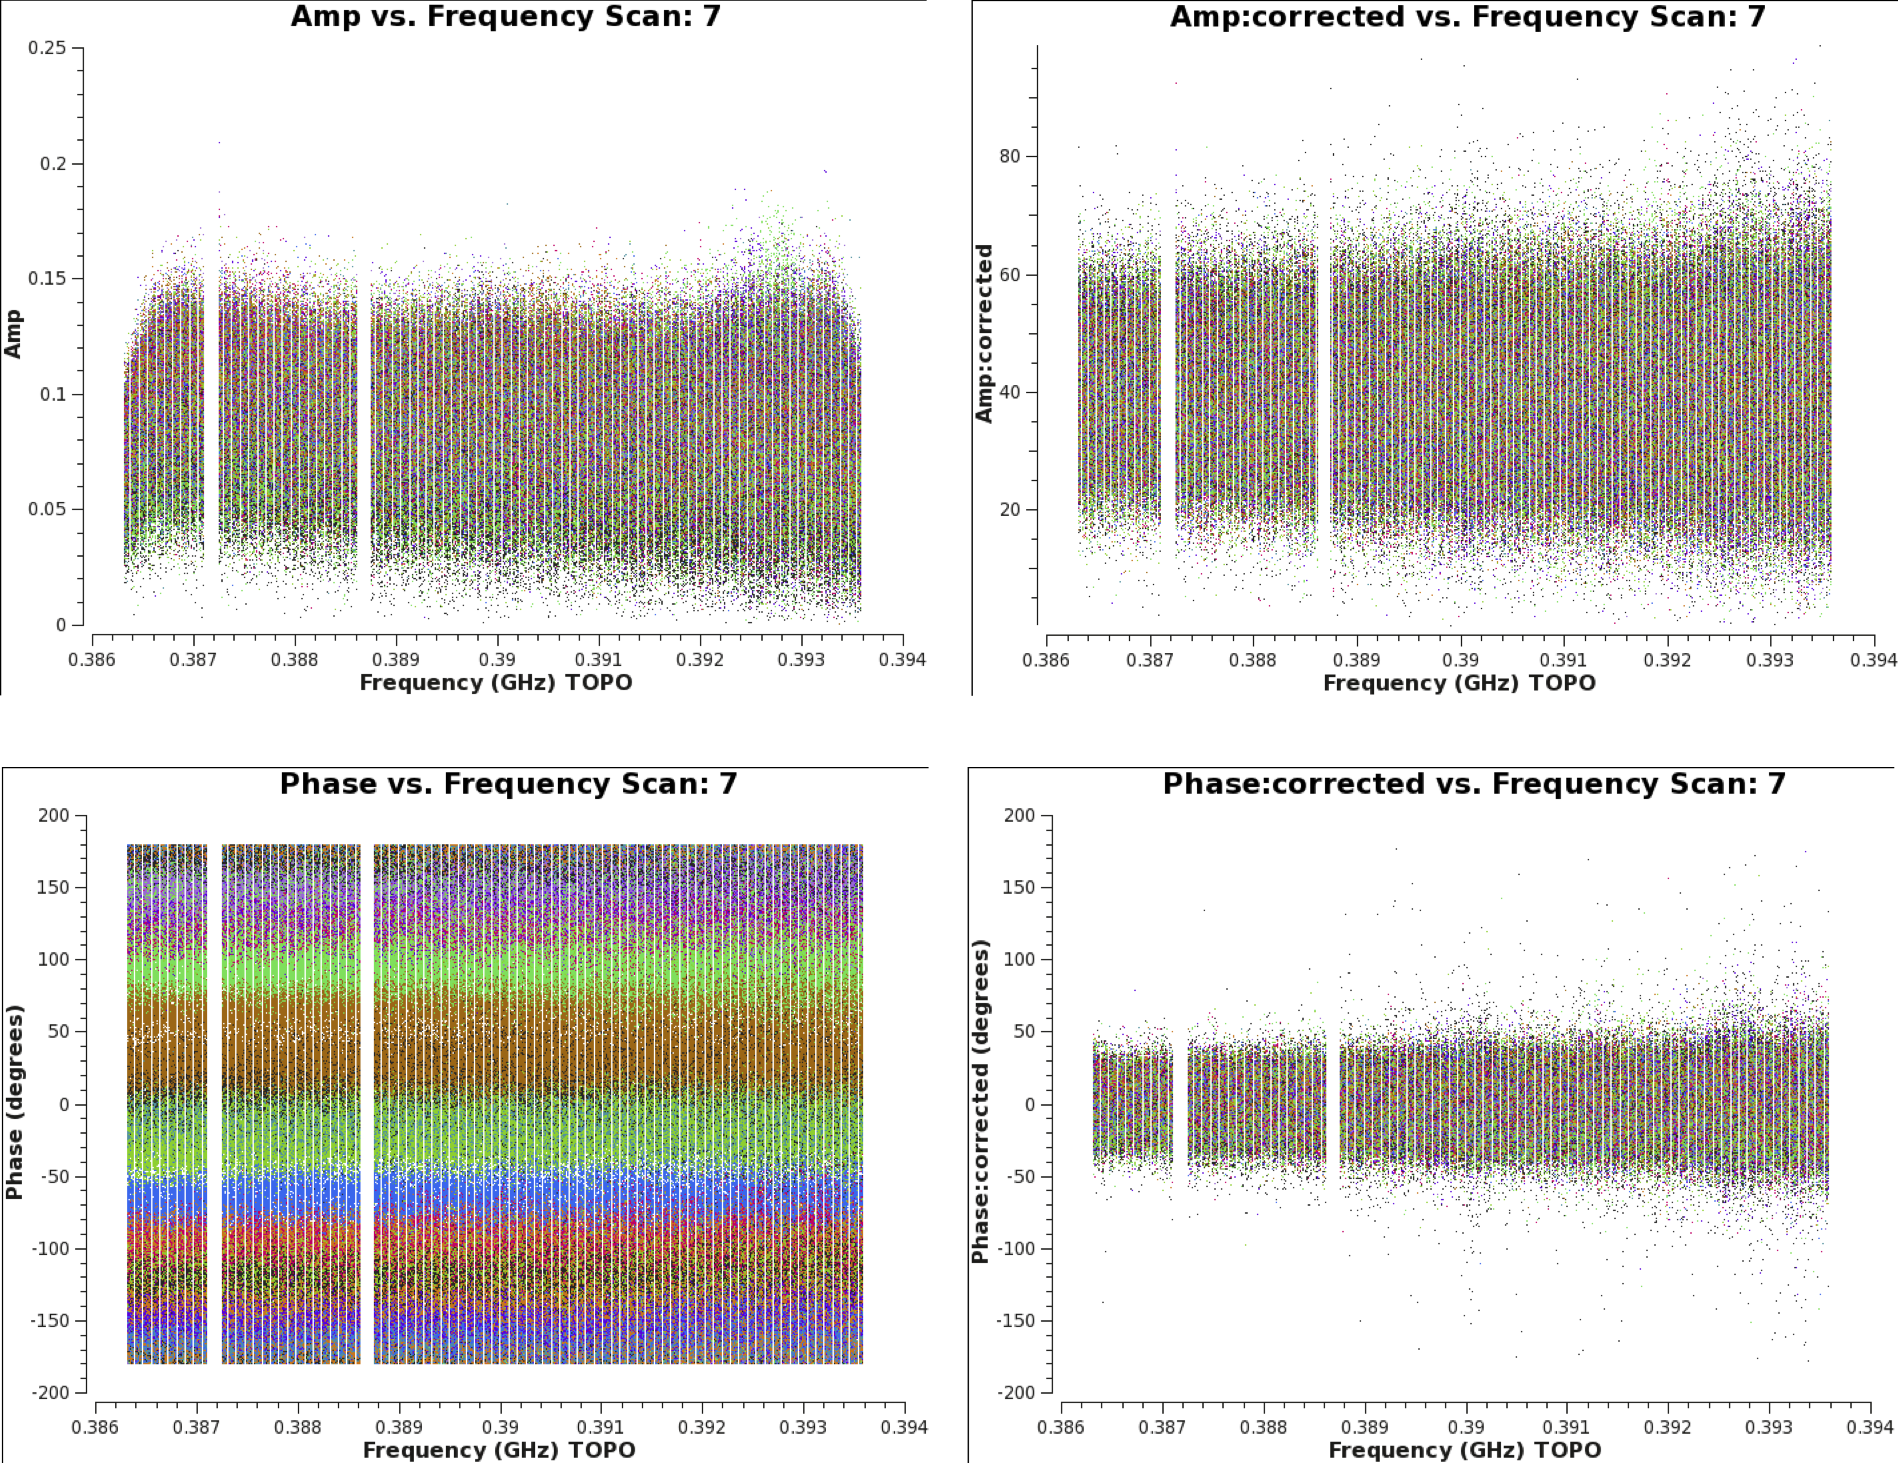
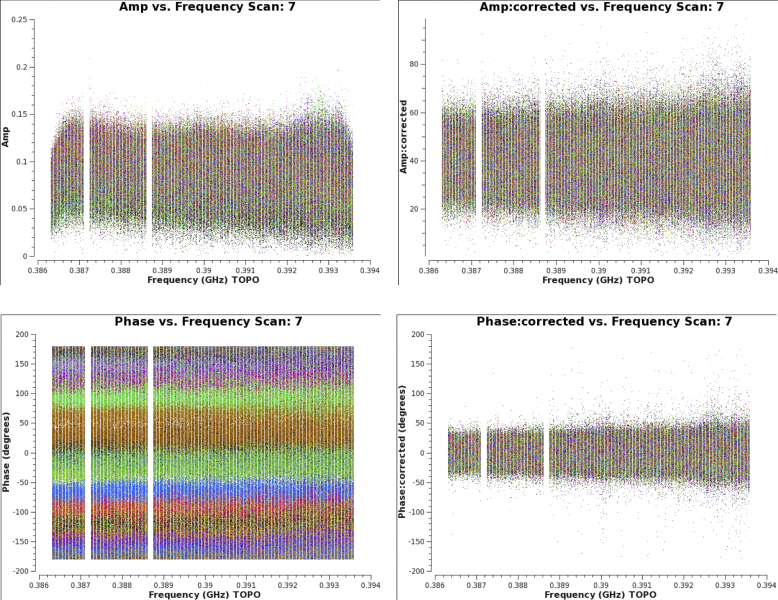
Fig.5. Effects of bandpass calibration on the frequency-dependent amplitudes (top) and phases (bottom) across the observing band. The corrections were applied using the task “applycal” (we do not need to do this until we obtained all remaining calibration tables -- see below for details). The various colors show the different baselines with reference antenna ca04. The plots were made in ‘plotms’, with in “Axes” choosing option “Data Column: data” or “Data Column: corrected”.
File history
Click on a date/time to view the file as it appeared at that time.
| Date/Time | Thumbnail | Dimensions | User | Comment | |
|---|---|---|---|---|---|
| current | 16:39, 18 August 2017 | | 1,898 × 1,463 (2.77 MB) | Bemonts (talk | contribs) | Fig.5. Effects of bandpass calibration on the frequency-dependent amplitudes (top) and phases (bottom) across the observing band. The corrections were applied using the task “applycal” (we do not need to do this until we obtained all remaining cali... |
You cannot overwrite this file.
File usage
There are no pages that use this file.