File:Figure10.jpg: Difference between revisions
From CASA Guides
Jump to navigationJump to search
(Figure 10: Zoomed spectral plot of 3C279 showing mesospheric absorption of CO(3-2) in frequency space. Figure 10 of the TWHydraBand 7 Summer School 2012) |
(No difference)
|
Latest revision as of 11:23, 23 May 2012
Figure 10: Zoomed spectral plot of 3C279 showing mesospheric absorption of CO(3-2) in frequency space.
Figure 10 of the TWHydraBand 7 Summer School 2012
File history
Click on a date/time to view the file as it appeared at that time.
| Date/Time | Thumbnail | Dimensions | User | Comment | |
|---|---|---|---|---|---|
| current | 11:23, 23 May 2012 | 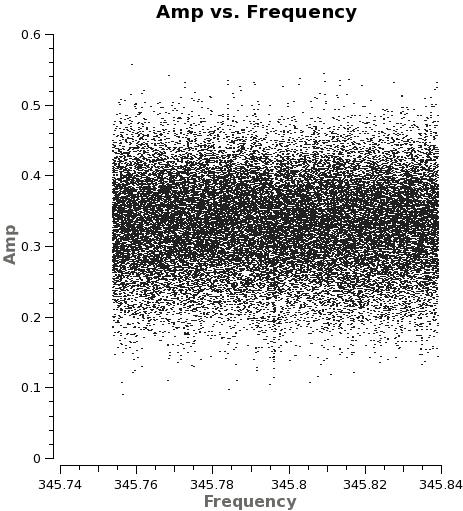 | 463 × 511 (155 KB) | Aleroy (talk | contribs) | Figure 10: Zoomed spectral plot of 3C279 showing mesospheric absorption of CO(3-2) in frequency space. Figure 10 of the TWHydraBand 7 Summer School 2012 |
You cannot overwrite this file.
File usage
The following page uses this file: