File:Bandwidthsmearingtable.png
From CASA Guides
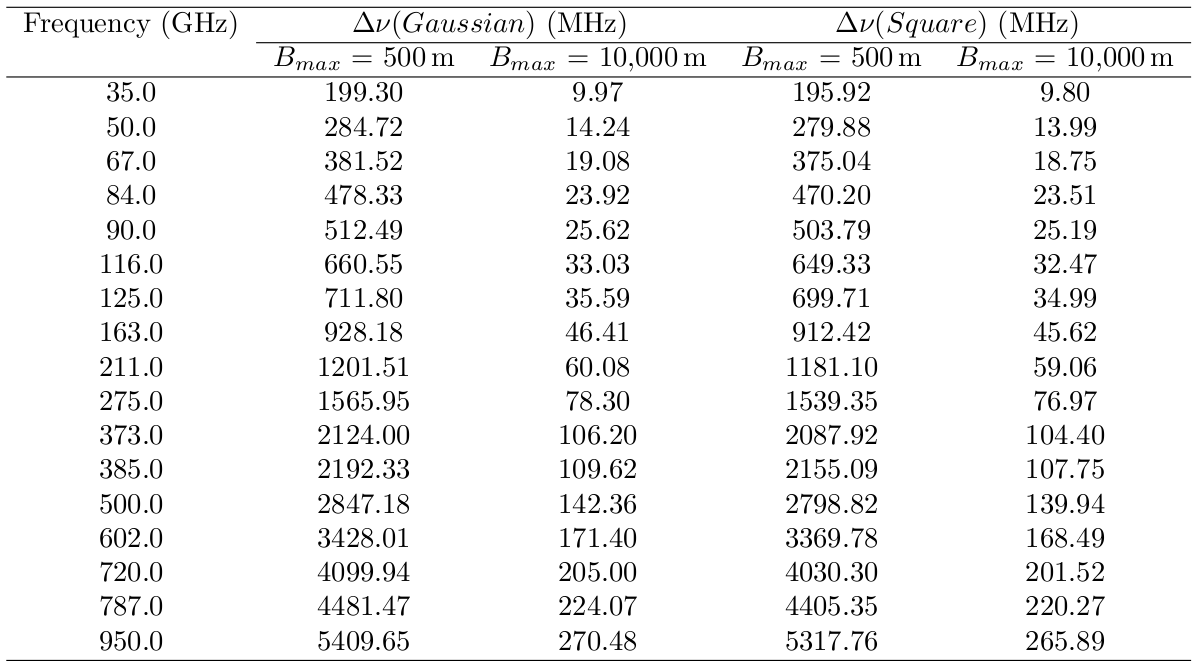
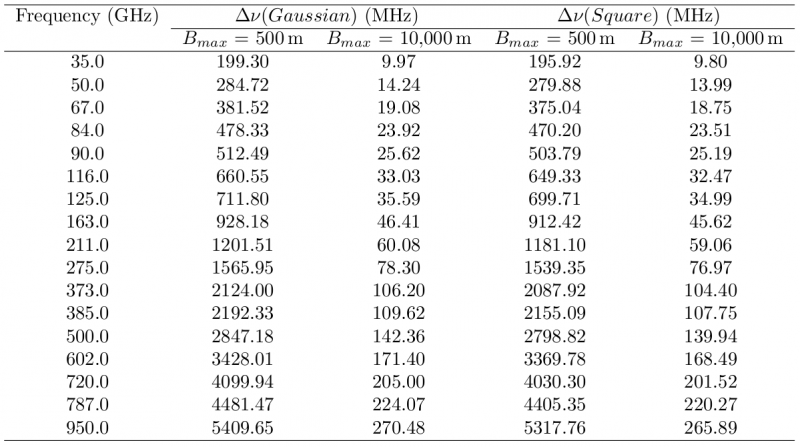
Revision as of 14:09, 5 April 2017 by Ekeller (talk | contribs) (This table lists the maximum bandwidth allowed for a reduction in peak response to a point source over the field of view of 1% for a a square and Gaussian bandpass. This tables lists this for various observing frequencies and baselines for the two band...)
Size of this preview: 800 × 447 pixels. Other resolution: 1,199 × 670 pixels.
Original file (1,199 × 670 pixels, file size: 92 KB, MIME type: image/png)
This table lists the maximum bandwidth allowed for a reduction in peak response to a point source over the field of view of 1% for a a square and Gaussian bandpass. This tables lists this for various observing frequencies and baselines for the two bandpass cases. For example, if your observation was at 385 GHz and your maximum baseline was 10,000 meters then for a Gaussian bandpass the maximum bandwidth that can be averaged together is 109.62 MHz bandwidth.
File history
Click on a date/time to view the file as it appeared at that time.
| Date/Time | Thumbnail | Dimensions | User | Comment | |
|---|---|---|---|---|---|
| current | 14:09, 5 April 2017 | | 1,199 × 670 (92 KB) | Ekeller (talk | contribs) | This table lists the maximum bandwidth allowed for a reduction in peak response to a point source over the field of view of 1% for a a square and Gaussian bandpass. This tables lists this for various observing frequencies and baselines for the two band... |
You cannot overwrite this file.
File usage
The following 2 pages use this file: