EVLA Spectral Line Imaging Analysis IRC+10216
This tutorial is under construction. There are several things still to be added

For the time being (until release candidate is built) you want to run this on casapy-test
This tutorial picks up where EVLA Spectral Line Calibration IRC+10216 leaves off.
UV Continuum Subtraction
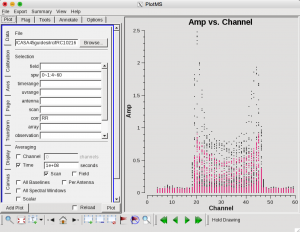
Now we can make a vector averaged uv-plot of the calibrated target spectral line data. It is important to note that you will only see signal in such a plot if (1) the data are well calibrated, and (2) there is significant signal near the phase center of the observations, or if the line emission (or absorption) is weak but extended. If this isn't true for your data, you won't be able to see the line signal in such a plot and will need to make an initial line+continuum cube to determine the line-free channels. Indeed, generally this is the recommended course for finding the line-free channels more precisely than is being done here due to time constraints.
plotms(vis='IRC10216',field='',ydatacolumn='corrected',
       xaxis='channel',yaxis='amp',correlation='RR',
       avgtime='1e8',avgscan=T,spw='0~1:4~60',antenna='')
in the Display tab, choose colorize by spw and change the Unflagged points symbol to custom and Style of 3.
You should see the "horned profile" typical of a rotation shell. From this plot, you can guess that strong line emission is restricted to channels 18 to 47 (zoom in if necessary to see exactly what the channel numbers are).
In the Data tab you can also click on "all baselines" to average all baselines, but this is a little harder to see.
Now we want to use the line free channels to create a model of the continuum emission that can be subtracted to form a line-only dataset. We want to refrain from going to close to the edges of the band -- these channels are typically noisy, and we don't want to get too close to the line channels because we could only see strong line emission in the vector averaged uv-plot.
uvcontsub2(vis='IRC10216',fitspw='0~1:4~13;52~60',
       want_cont=T)
The "want_cont=T" will produce new two new datasets, IRC10216.contsub is the continuum subtracted line data, and IRC10216.cont is the continuum estimate (note however, that it is still a multi-channel cube).
Image the Spectral Line Data
Here we make images from the continuum-subtracted, calibrated spectral line data. Because the spectral line emission from IRC+10216 has significant extended emission, it is very important to run clean interactively, and make a clean mask.
# In CASA
clean(vis='IRC10216.contsub',imagename='IRC10216_HC3N.cube_r0.5',
      imagermode='csclean',
      imsize=300,cell=['0.4arcsec'],spw='0:5~58',
      mode='velocity',interpolation='linear',
      restfreq='36.39232GHz',outframe='LSRK',
      weighting='briggs',robust=0.5,
      interactive=T,
      threshold='3.0mJy',niter=100000)
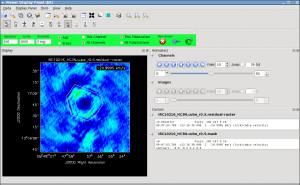
It will take a little while to grid the data, but viewer will open when it's ready to start an interactive clean. Use the "tape deck" at the bottom of the Viewer display GUI to step through to the channel with the most extended (in angular size) emission, select "all channels" for the clean mask, select the polygon tool (second in from the right) and make a single mask that applies to all channels (see example in thumbnail). Once you make the polygon region, you need to double click inside it to save the mask region -- if you see the polygon turn white you will know you succeeded. Note, that if you had the time and patience you could make a clean mask for each channel, and this would create a slightly better result.
After making the mask you should check that the emission in all the other channels fits within the mask you made using the "tape deck" to move back and forth. If you need to include more area in the mask, you can chose the "erase" toggle at the top, and then encircle your existing mask with a polygon and double click inside. Then go back to "add" toggle at top and make a new mask. Alternatively, you can erase a part of the mask, or you can add to the existing mask by drawing new polygons. Feel free to experiment with this a bit.
To continue with clean use the "Next action" buttons in the green area on the Viewer Display GUI: The red X will stop clean where you are, the blue arrow will stop the interactive part of clean, but continue to clean non-interactively until reaching the stopping niter or threshold (whichever comes first), and the green arrow will clean until it reaches the "iterations" parameter on the left side of the green area.
Keep cleaning, by using the green Next Action arrow until the residual displayed in the viewer looks "noise like". To speed things up, you might change the iteration parameter in the viewer to something like 300. This parameter can also be set in the task command. You will notice that in this particular case, there are residuals that cannot be cleaned -- these are due to the extended resolved out structure on size scales larger than the array is sensitive to (the "Largest Angular Scale" or LAS that the array is sensitive to can be calculated from the shortest baseline length).
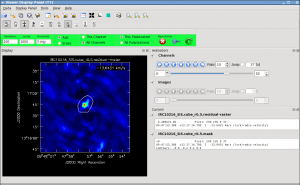
Repeat the process for the SiS line using the call below, note that the emission for this line is less extended than the HC3N -- this has to do with the different excitation requirements of the two different lines. The SiS is excited closer to the central star than the HC3N.
# In CASA
clean(vis='IRC10216.contsub',imagename='IRC10216_SiS.cube_r0.5',
      imagermode='csclean',
      imsize=300,cell=['0.4arcsec'],spw='1:5~58',
      mode='velocity',interpolation='linear',
      restfreq='36.30963GHz',outframe='LSRK',
      weighting='briggs',robust=0.5,
      interactive=T,
      threshold='3.0mJy',niter=100000)
Image the Continuum data
Below the use of mode='mfs' will make a single multi-frequency synthesis image out of the specified spw. Again you should make an interactive clean mask. Since no threshold is set, you will need to stop cleaning when the residual looks noise like using the red x "Next Action" button (it will be done when the viewer comes back the second time).
# In CASA
clean(vis='IRC10216.cont',imagename='IRC10216.36GHzcont',
      mode='mfs',imagermode='csclean',
      imsize=300,cell=['0.4arcsec'],spw='0~1:5~59',
      weighting='briggs',robust=0.5,
      interactive=T)
Now look at the result in the viewer if you like
# In CASA
Viewer
Image Analysis and Viewing
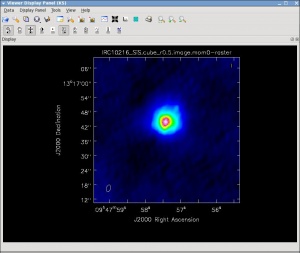
Next make integrated intensity maps (moment 0) and integrated velocity maps (moment 1). To do this, we'll want to know what channels the line emission starts and ends on, and also the rms noise in a single channel. So first lets open the viewer:
# In CASA
viewer
Then use the Viewer tape deck to see which channels have significant line emission. For HC3N, the line channel range in the cube is 11 to 40, and it is the same for SiS.
Then use the tape deck to go to a line free channel, select the box region tool and make a box. When you double click in the box, the image statistics for the whole cube will print to the terminal and for the channel you are on, it will print to a pop up window. Move the box around a bit to see what the variation in rms noise is. You should get something like 2 mJy. Note that the rms is much worse in channels with strong emission because of the low dynamic range of these data. If you want the box tool to go away (i.e. if you want to make a new one), hit the escape key.
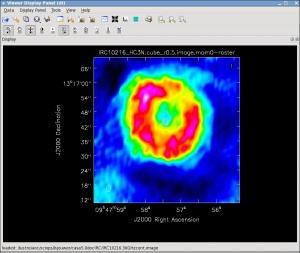
Now lets make the moment 0 and moment 1 maps. For moment zero, its best to limit the calculation to image channels with significant signal in them, but not to apply a flux cutoff, as this will bias the derived integrated intensities upward.
# In CASA
immoments(imagename='IRC10216_HC3N.cube_r0.5.image',moments=[0],
          axis='spectral',
          chans='11~40',
          outfile='IRC10216_HC3N.cube_r0.5.image.mom0')
# In CASA
immoments(imagename='IRC10216_SiS.cube_r0.5.image',moments=[0],
          axis='spectral',
          chans='11~40',
          outfile='IRC10216_SiS.cube_r0.5.image.mom0')
For moment 1, it is essential to apply a conservative flux cutoff to limit the calculation to high signal-to-noise areas. Here we use about 5sigma.
# In CASA
immoments(imagename='IRC10216_HC3N.cube_r0.5.image/',moments=[1],
          axis='spectral',
          chans='11~40',excludepix=[-100,0.01],
          outfile='IRC10216_HC3N.cube_r0.5.image.mom1')
# In CASA
immoments(imagename='IRC10216_SiS.cube_r0.5.image/',moments=[1],
          axis='spectral',
          chans='11~40',excludepix=[-100,0.01],
          outfile='IRC10216_SiS.cube_r0.5.image.mom1')
Now user the viewer to further explore the images you've made.
