Data flagging with viewer: Difference between revisions
| Line 24: | Line 24: | ||
== Setting Up for Antenna-based Flagging == | == Setting Up for Antenna-based Flagging == | ||
{|cellpadding=" | {|cellpadding="0" | ||
|- | |- | ||
Revision as of 11:02, 24 November 2009
Overview
Your data will inevitably have some bad data. Perhaps a receiver on a given antenna is acting up, or perhaps the pointing on a given antenna is poor, and these problematic data will translate to (hopefully) obviously aberrant data in your measurement set. It's a good idea to inspect your data carefully before calibration and imaging, and CASA offers several tools to flag bad data interactively.
This tutorial illustrates how to use viewer to flag poor data. It will use the dataset AU079 from the VLA archive; this dataset is also used in the Imaging Flanking Fields tutorial.
Loading the Measurement Set into Viewer
As described in the Imaging Flanking Fields tutorial, the data may be loaded into CASA using the importvla command. The following commands import the data into the measurement set au079.ms and send them to the viewer.
# from loaddata.py
from glob import glob

# Define the list of files for reading. Use glob to perform wildcard matching with VLA archive filenames.
fileList = glob('AU079_*.xp?')

importvla(archivefiles=fileList,vis='au079.ms')
viewer('au079.ms') # load the data into the viewer for editing
The viewer command can also be invoked without argument, in which case a file selector GUI will appear.
Setting Up for Antenna-based Flagging
|
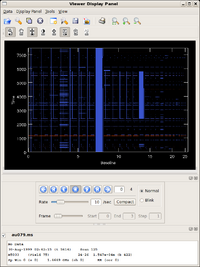
The figure at right shows the default viewer display for a measurement set. The axes are (y) time and (x) baseline, or antenna pair, enumerated by the common antenna number of the pair. Flagged data are highlighted in pale blue. Another window, titled Data Display Options, will also appear, allowing you to alter the display and flagging options. |
|
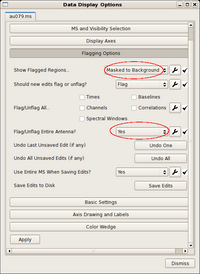
The blue highlights can be initially distracting, and they can be optionally suppressed by altering the Flagging Options in the Data Display Options. The figure at right shows the options.
In anticipation of the antenna-based editing to come, it's also worth setting the antenna flag.
Now, when multiple baselines are selected, all baselines to the common antenna will be flagged.
|
--Jgallimo 19:14, 23 November 2009 (UTC)

