TWHydraBand7 For CASA 3.3
Science Target Overview

TW Hya is a pre-main sequence classical T Tauri star at a distance of about 52+/-1 pc (Mamajek 2005,2010). It is the most studied member of the TW Hydra association (TWA) of low mass stars. From a wide variety of previous observations from the infrared to submillimeter, TW Hya is known to have a hot inner disk extending to radii < 4 AU, which is optically thin in the IR, and a larger cold dust disk out to about 200 AU (see for example the introduction by Vacca & Sandell 2011, and references therein). Recent optical interferometry finds that TW Hya also contains a hot optically thick disk on even smaller size scales of ~0.5 AU, and suggests that the optically thin disk could be due to gas clearing by a planet (Akeson et al. 2011). TW Hya is apparently still accreting from its disk at a rate of about (4-20) x 10-10 Msun/year and the most recent estimates of its spectral type, mass, and age are M2.5V, 0.4 Msun, and 3 Myr (Vacca & Sandell 2011).
Millimeter and submillimeter observations of the continuum and spectral lines are particularly useful for tracing in the outer cold disk. Previous observations by the VLA at 7 mm (Wilner et al. 2000), ATCA at 3 mm (Wilner et al. 2003), and the SMA at 1.3, 0.87, and 0.45 mm (Qi et al. 2004, 2006, 2008 and Hughes et al. 2011) reveal Keplerian rotation in the disk and an inclination angle of about 7 degrees (i.e. almost face-on). Detailed studies of the dust continuum properties from the SMA work suggest that there are centimeter sized particles within the cold proto-planetary disk.
ALMA Data Overview


ALMA Science Verification data at Band 7 (~345 GHz) was taken for TW Hya on April 22, 2011. A scheduling block about 1.5 hours long was run three times in a row for a total of about 4.5 hours of observing time. Nine antennas were available during these runs, but one has to be flagged. All four available basebands were used, resulting in four spectral windows (spws) containing data. Two basebands were placed in the Lower Sideband (LSB) and two basebands in the Upper Sideband (USB). In the LSB the CO(3-2) line at a rest frequency of 345.79599 GHz is located in spw=2. In the USB the HCO+(4-3) line at a rest frequency of 356.7342 GHz is located in spw=0. The other two spectral windows do not contain strong spectral lines and are used for continuum. Each spectral window is 0.5 GHz wide and the channel width is 122 kHz. Because the ALMA correlator was configured to apply Hanning smoothing of the signal, the effective spectral resolution is about twice the channel width, which in this case is about 0.2 km/s. For the antenna configuration in use at the time, the angular resolution is expected to be about 1.5".
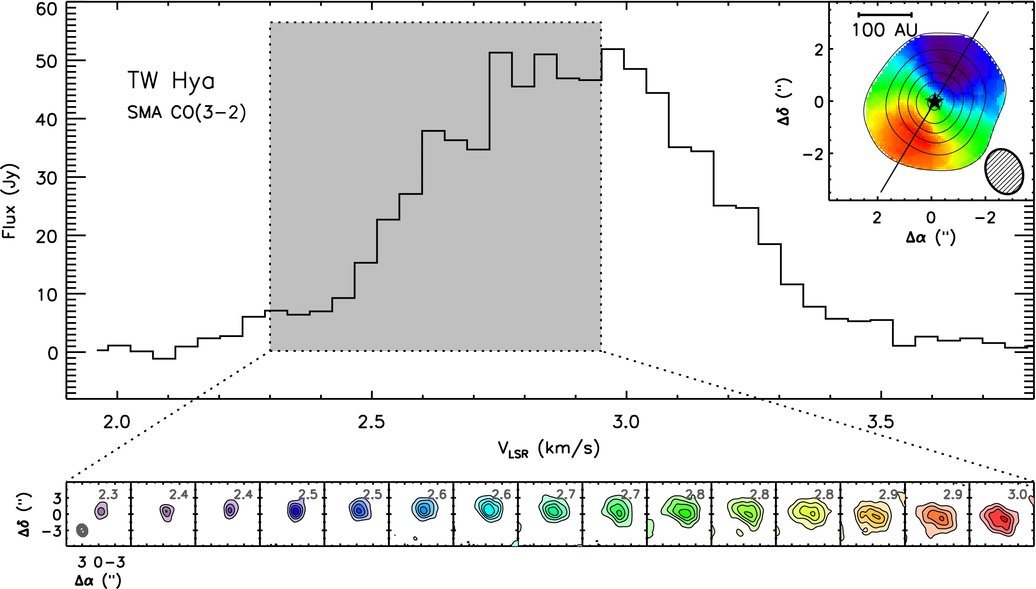
The ALMA CO(3-2) data presented here is similar to the Submillimeter Array data presented in Hughes et al. 2011 (ApJ, 727, 85), though the SMA data have ~3 times smaller channel width at 50 kHz.
HCO+(4-3) data has not previously been published, but SMA HCO+(3-2) data (at 267.55762 GHz) is presented in Qi et al. 2008 (ApJ, 681, 1396). These SMA data have comparable angular resolution but a wider 203 kHz channel width.

ALMA HCO+(4-3) moment maps from TW Hya, with white continuum contours at 3 and 100 sigma. From left to right: integrated intensity, intensity weighted velocity field, intensity weighted velocity dispersion are shown.
Obtaining the Data
The data are located HERE. Inside there are three directories.
- TWHYA_BAND7_UnCalibratedMSAndTablesForReduction - In the future raw data will be retrieved from the archive in ALMA Science Data Model (ASDM) format, here we provide the uncalibrated uv-data in CASA Measurement Set (MS) format along with two a priori calibration tables that currently cannot be created within CASA (this functionality will be available in CASA for Early Science).
- TWHYA_BAND7_CalibratedData - Contains only the calibrated uv-data for TWHya ready for imaging and self-calibration.
- TWHYA_BAND7_ReferenceImages - The final spectral line and continuum images.
The data reduction tutorial for these data has been split into calibration and imaging pages:
- TWHydraBand7_Calibration this page requires that you download the RawDataAndTablesForReduction directory
- TWHydraBand7_Imaging this page requires that have either used TWHydraBand7_Calibration to obtain the CalibratedData or that you have downloaded this directory.
Alternatively you can just download the final images (ReferenceImages directory) if you only want to see the final results.
NOTE: CASA 3.2.1 or later is required to process these data see http://casa.nrao.edu/casa_obtaining.shtml
NOTE: These guides are dynamic and will evolve as our understanding of how best to reduce ALMA data improves. Check back for updates periodically.
How to Use A casaguide
For tips on using CASA and ways CASA can be run, see EVLA_Spectral_Line_Calibration_IRC+10216#How_to_Use_This_casaguide page.
To learn how to extract executable Python scripts from the tutorial, see see Extracting_scripts_from_these_tutorials.
In the guides
# In CASA
Regions of this color are CASA commands (or definitions) that need to be cut and
pasted in sequence. Wait until one command is finished before pasting another.
Tabs matter in python, make sure that commands that span more than one line and
"for" loops keep their spacing. Sometimes (especially "for" loops) you may need to
explicitly hit enter twice to get the command going.
Information in this color shows excerpts from the CASA Logger output
This color shows you background information about the data or other types of reference material