CASA EVLA Scripts
Temporary edit link
Overview
This is a collection of Python scripts to help process and analyze EVLA data. Although they are not officially supported, some authors may choose to provide contact information. A brief description on how to run each script is provided by the author. If you would like to contribute, and do not have access to the CASA Guides Wiki, you may email Miriam Krauss (mkrauss at nrao.edu).
Plotting the weather table, obtaining observation-specific opacity information

Download script: File:Script plotWX.py
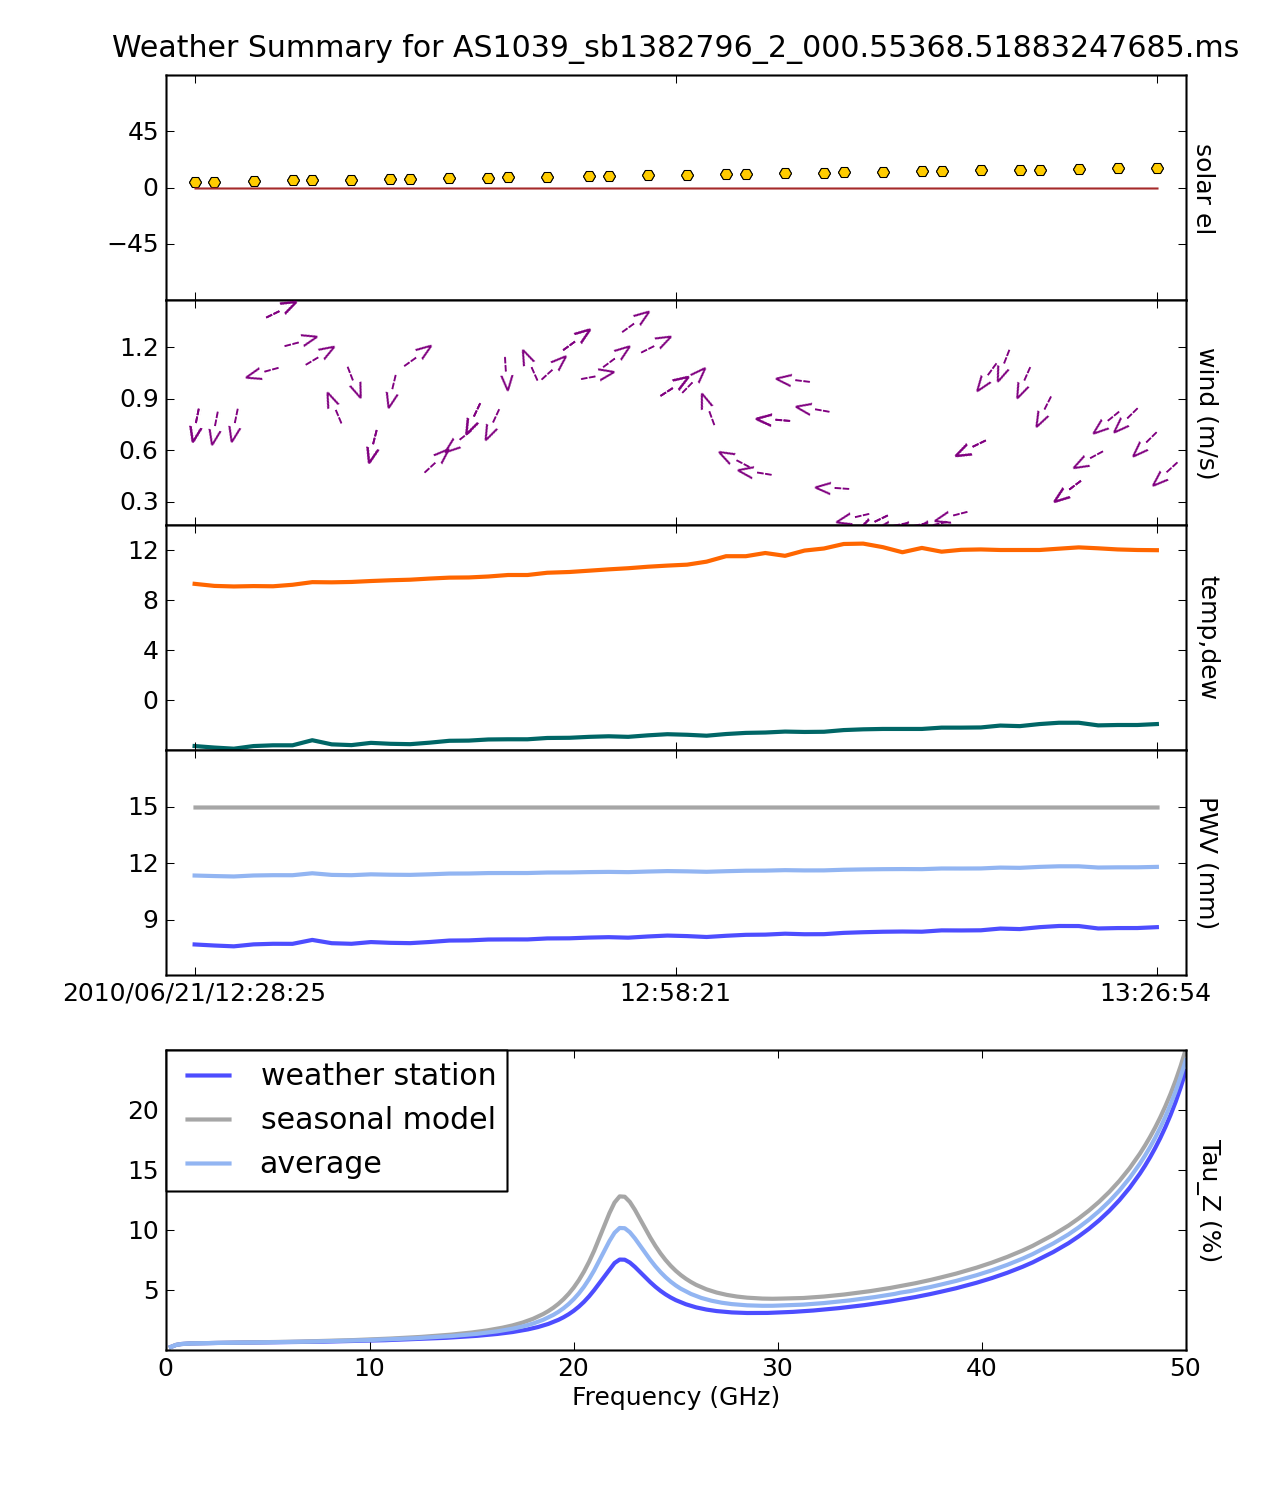
This script will plot weather table information in the MS (see example below) as well as return a list of estimated zenith opacity values for each spectral window.
# In CASA
from Script_plotWX import plotWX
myTau = plotwx('myVis.ms')
Importing, listing, plotting, and applying online flags

Download script: File:Readflags.py
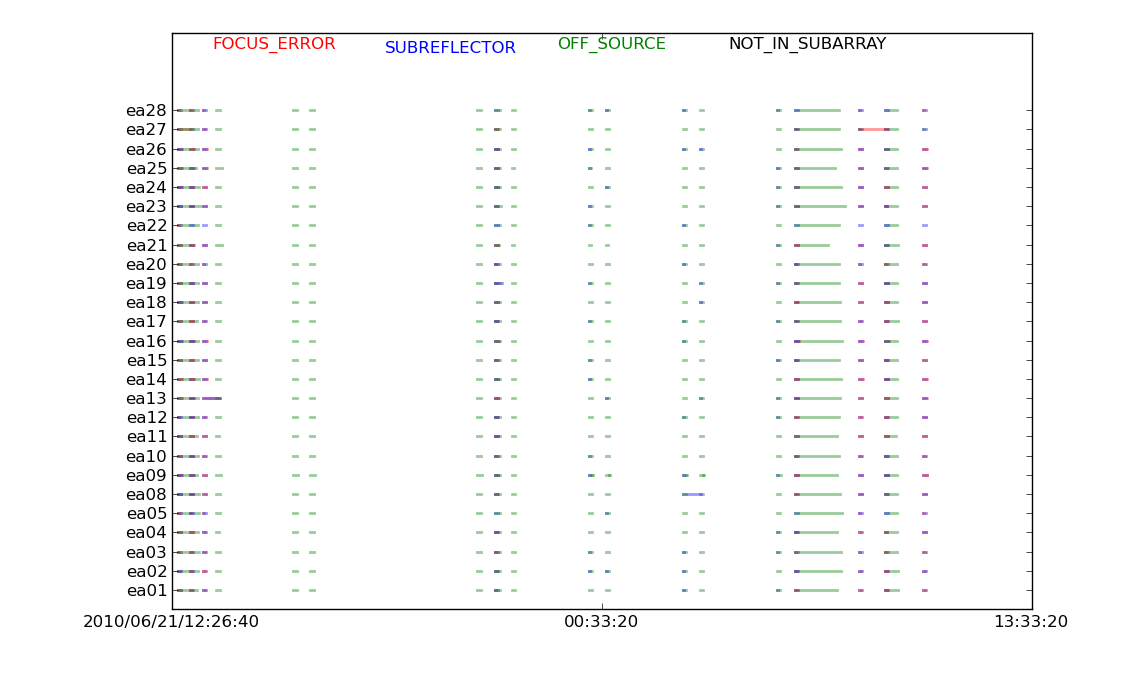
This script reads the Flags.xml table in the SDM directory, and parses the online antenna flags so that they can be listed, plotted, and applied to the MS. Note that the tbuff parameter is a padding value (in seconds) for creating the flag time ranges.
Here, flags are read in and listed, then plotted and applied. The plot file is saved to a file for future reference.
# In CASA
from Readflags import listflags, readflags, plotflags, useflags
myFlags = readflags('mySDMfile', tbuff=1.5)
listflags(myFlags)
plotflags(myFlags)
pl.savefig('mySDMfile_onlineFlags.png')
useflags('myVis.ms', myFlags)
Listing observation information directly from the SDM files
Download script: File:List sdm.py