VLA CASA Pipeline-specline-CASA6.6.1
Spectral Line Pipeline Guide CASA 6.6.1
S-band Continuum Pipeline Guide
In the S-band Continuum VLA Pipeline Guide we present a CASAguide for a VLA continuum dataset. As of late 2024, we modified the pipeline so that also spectral line data sets are properly calibrated (and imaged). This guide should be used in addition to the S-band Continuum VLA Pipeline Guide. We will only explain the additional steps that are performed for spectral line data sets.
The general description of the VLA pipeline, download, and known issues can be found on on the available at VLA Pipeline webpage.
Spectral Line data set identification and description
Spectral Line and Continuum data are not exactly separated as they both consist of several baseboards, split into spectral windows (spws), which contain many channels each. Typically, however, continuum data spans the entire frequency coverage of a receiver, has wide (MHz or similar) channel widths and is full polarization. Spectral Line datasets, on the other hand, have more narrow spectral windows with channels in the kHz range. There can be many spectral line windows, typically observed in parallel with continuum spws.
Spectral Line data set detection criteria
The spec line_spws parameter controls which spws will undergo continuum or spectral line processing.
ifv_importdata parameter specline_spws='auto'
The pipeline default is 'auto', other valid options are: 'none', 'all', or, for example, '2~3,6,7,9~12'. The 'auto' setting will process the windows more narrow that a standard continuum setup as being desired for spectral line science, 'none' will set all spectral windows to be processed as continuum, 'all' will process all spectral windows as spectral line, and the final example will process spectral windows 2, 3, 6, 7, 9, 10, 11, and 12 as spectral line windows.
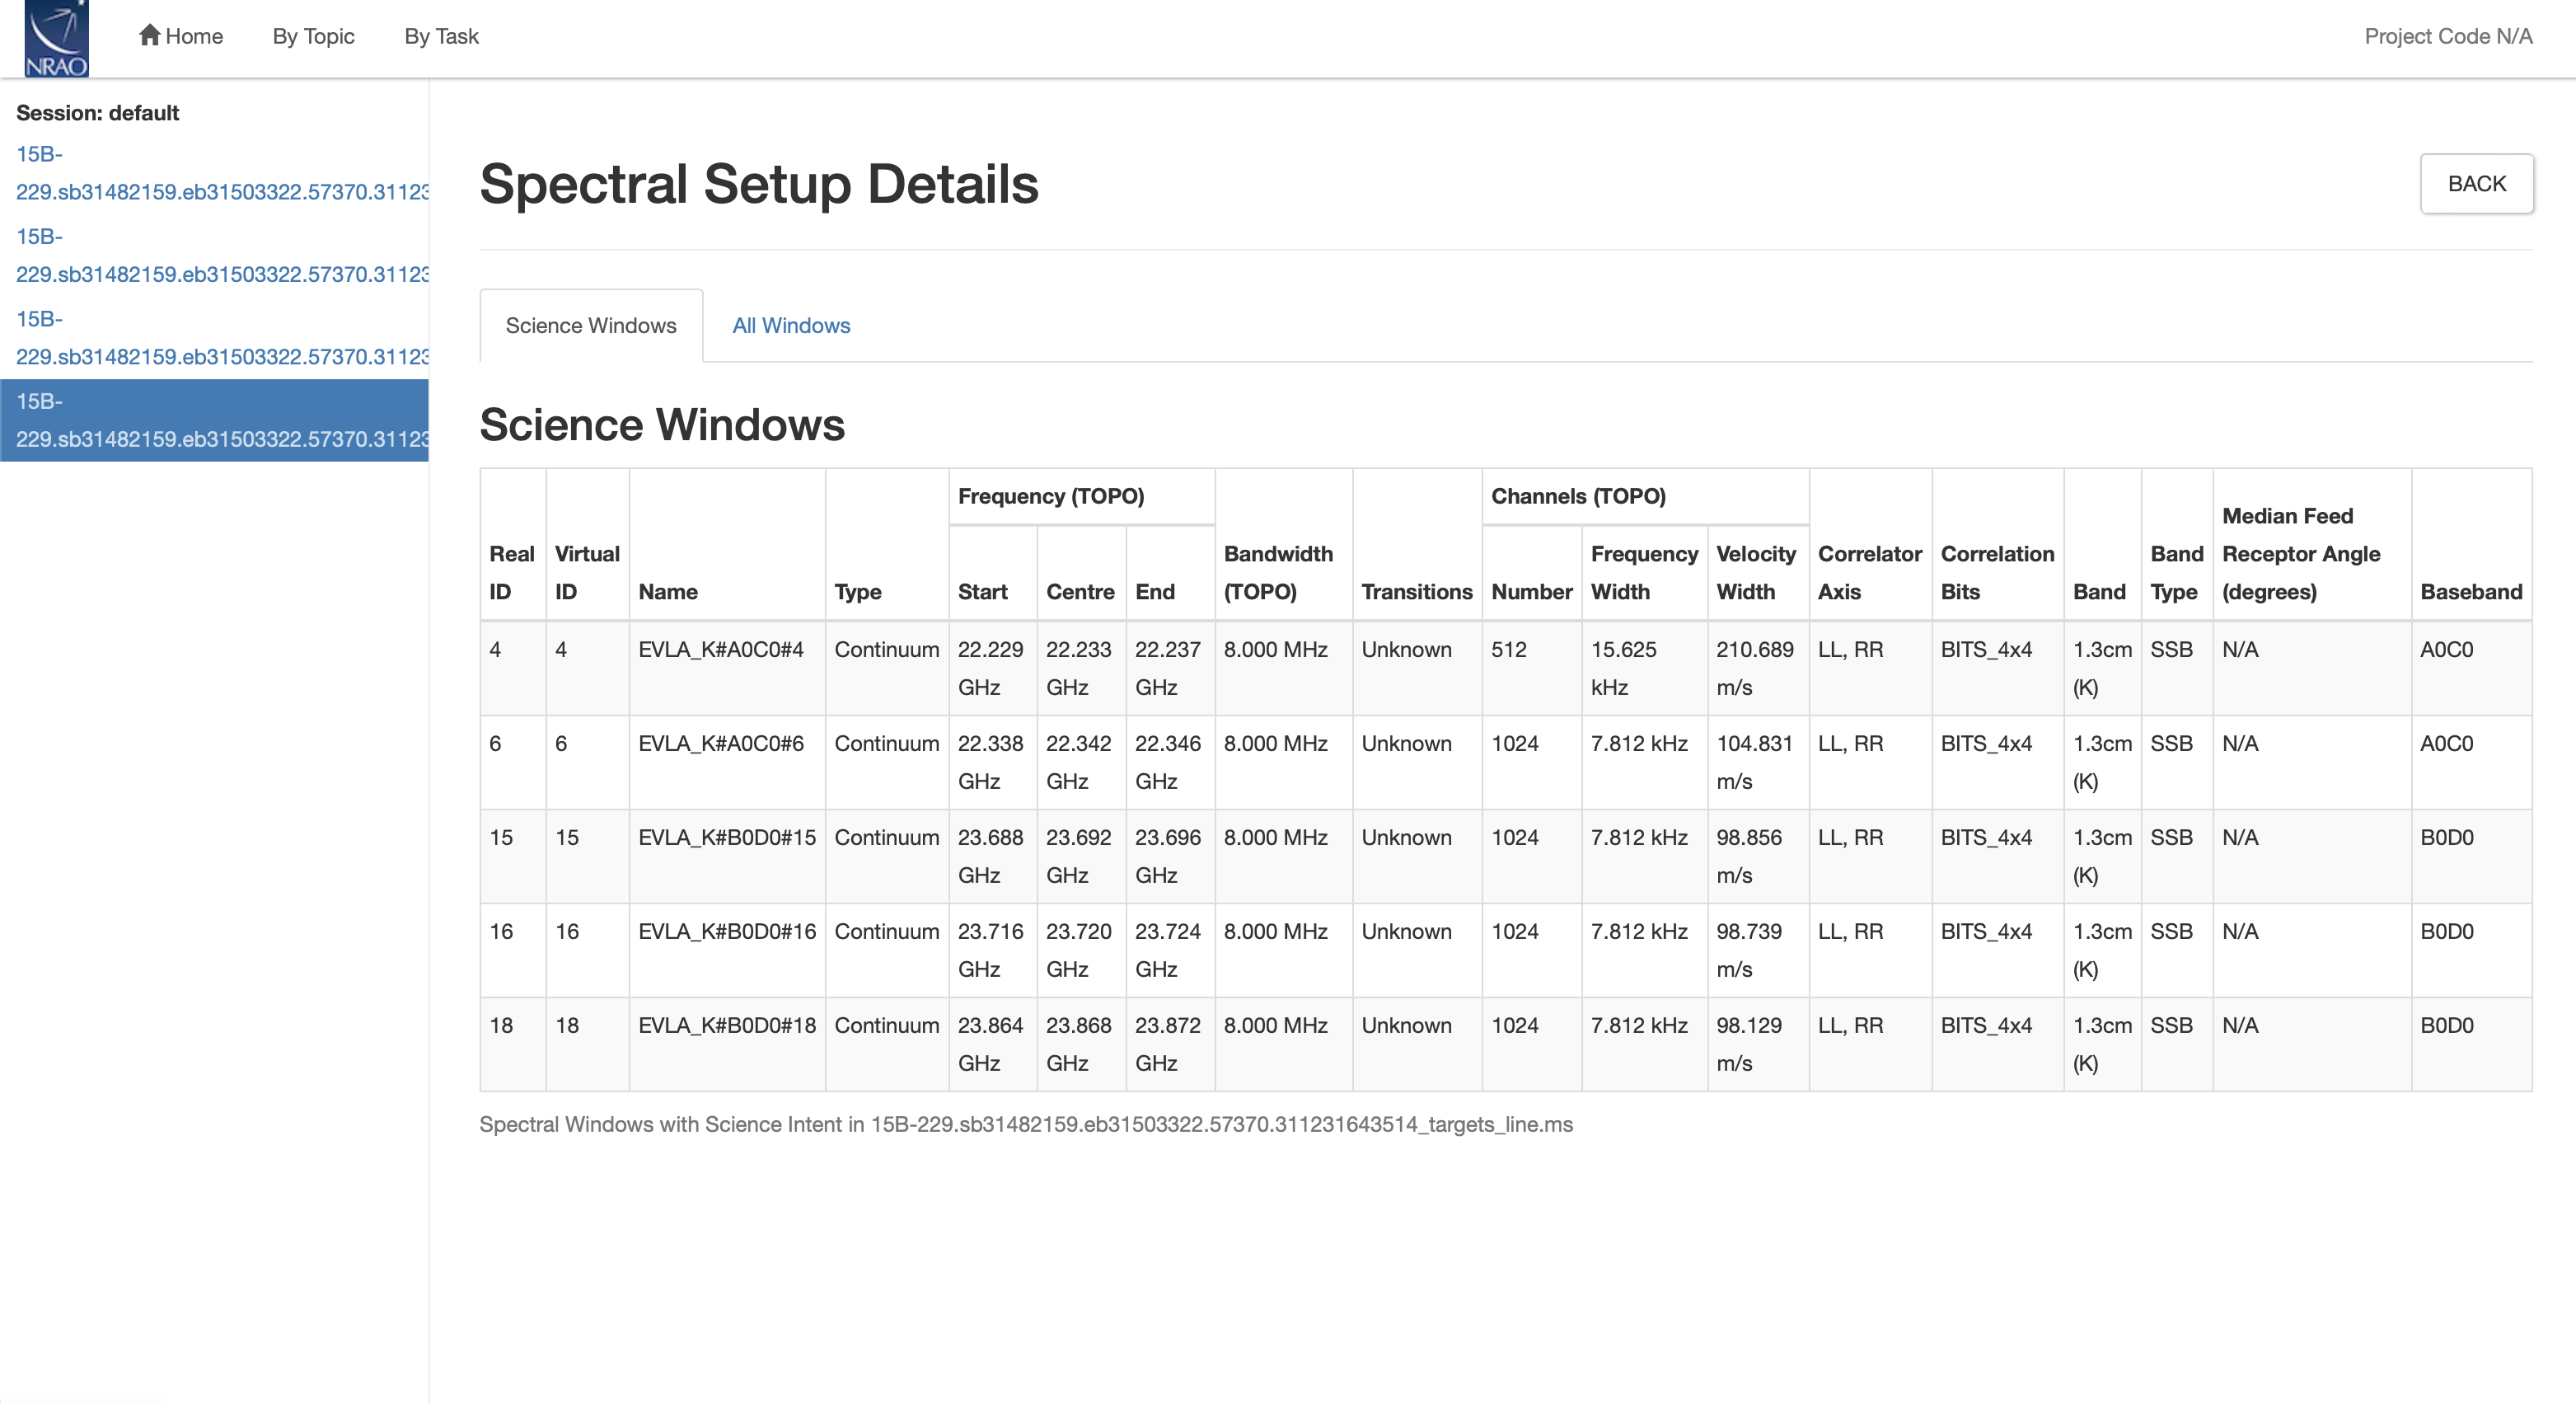
Manual Spectral Line spw identification
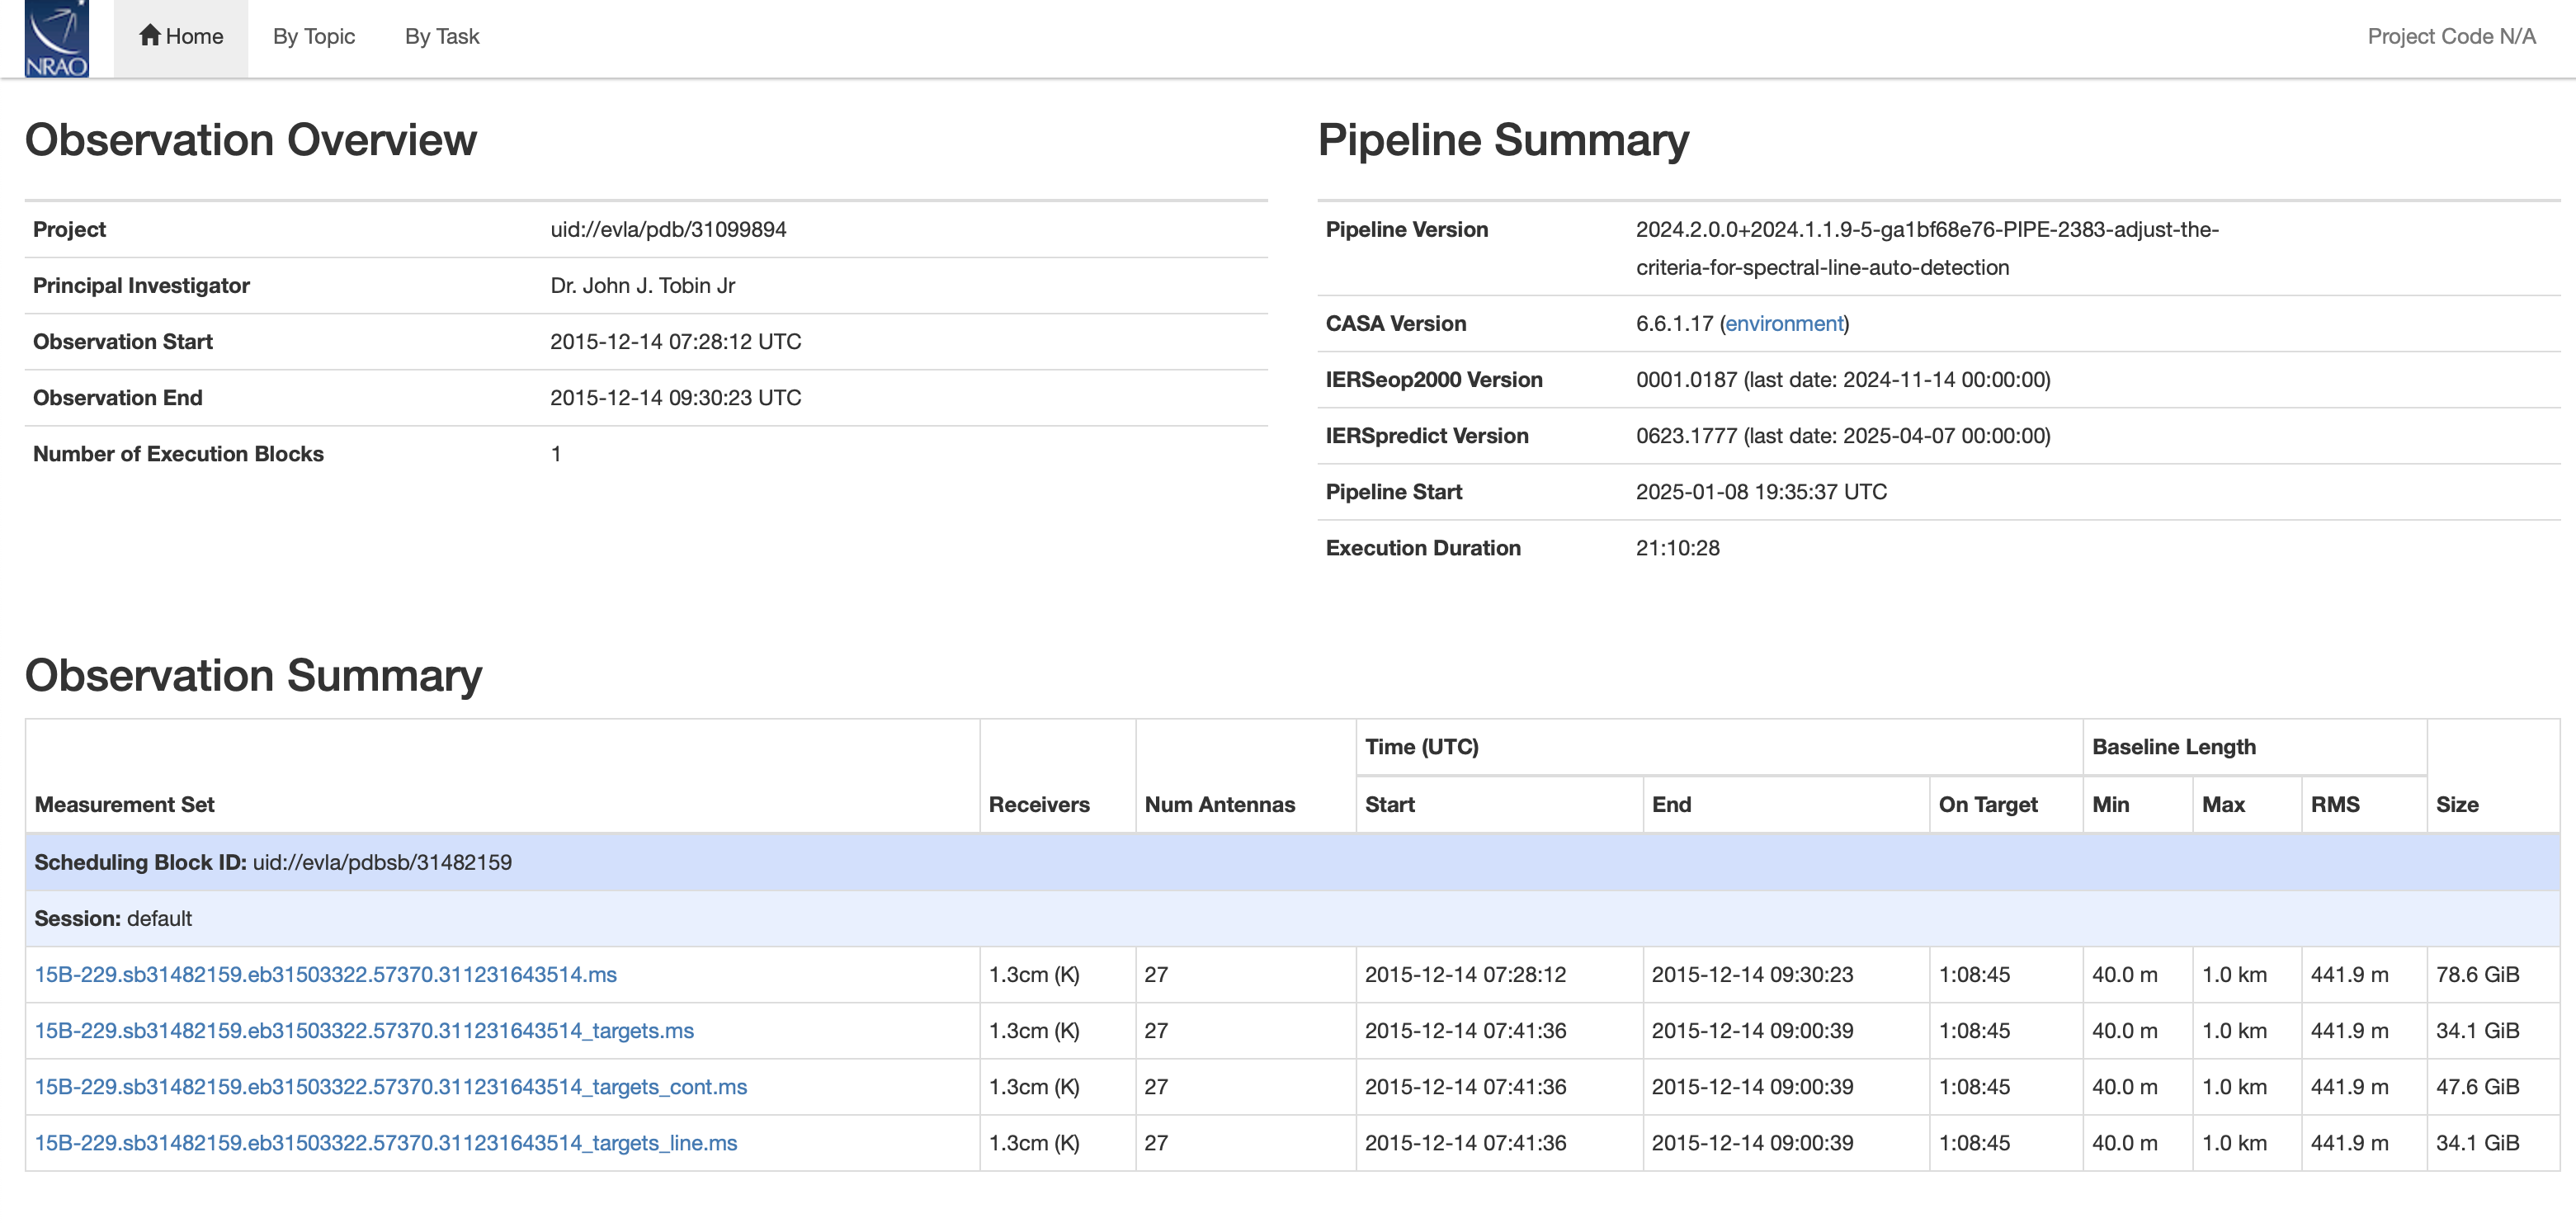
Home Screen
 |
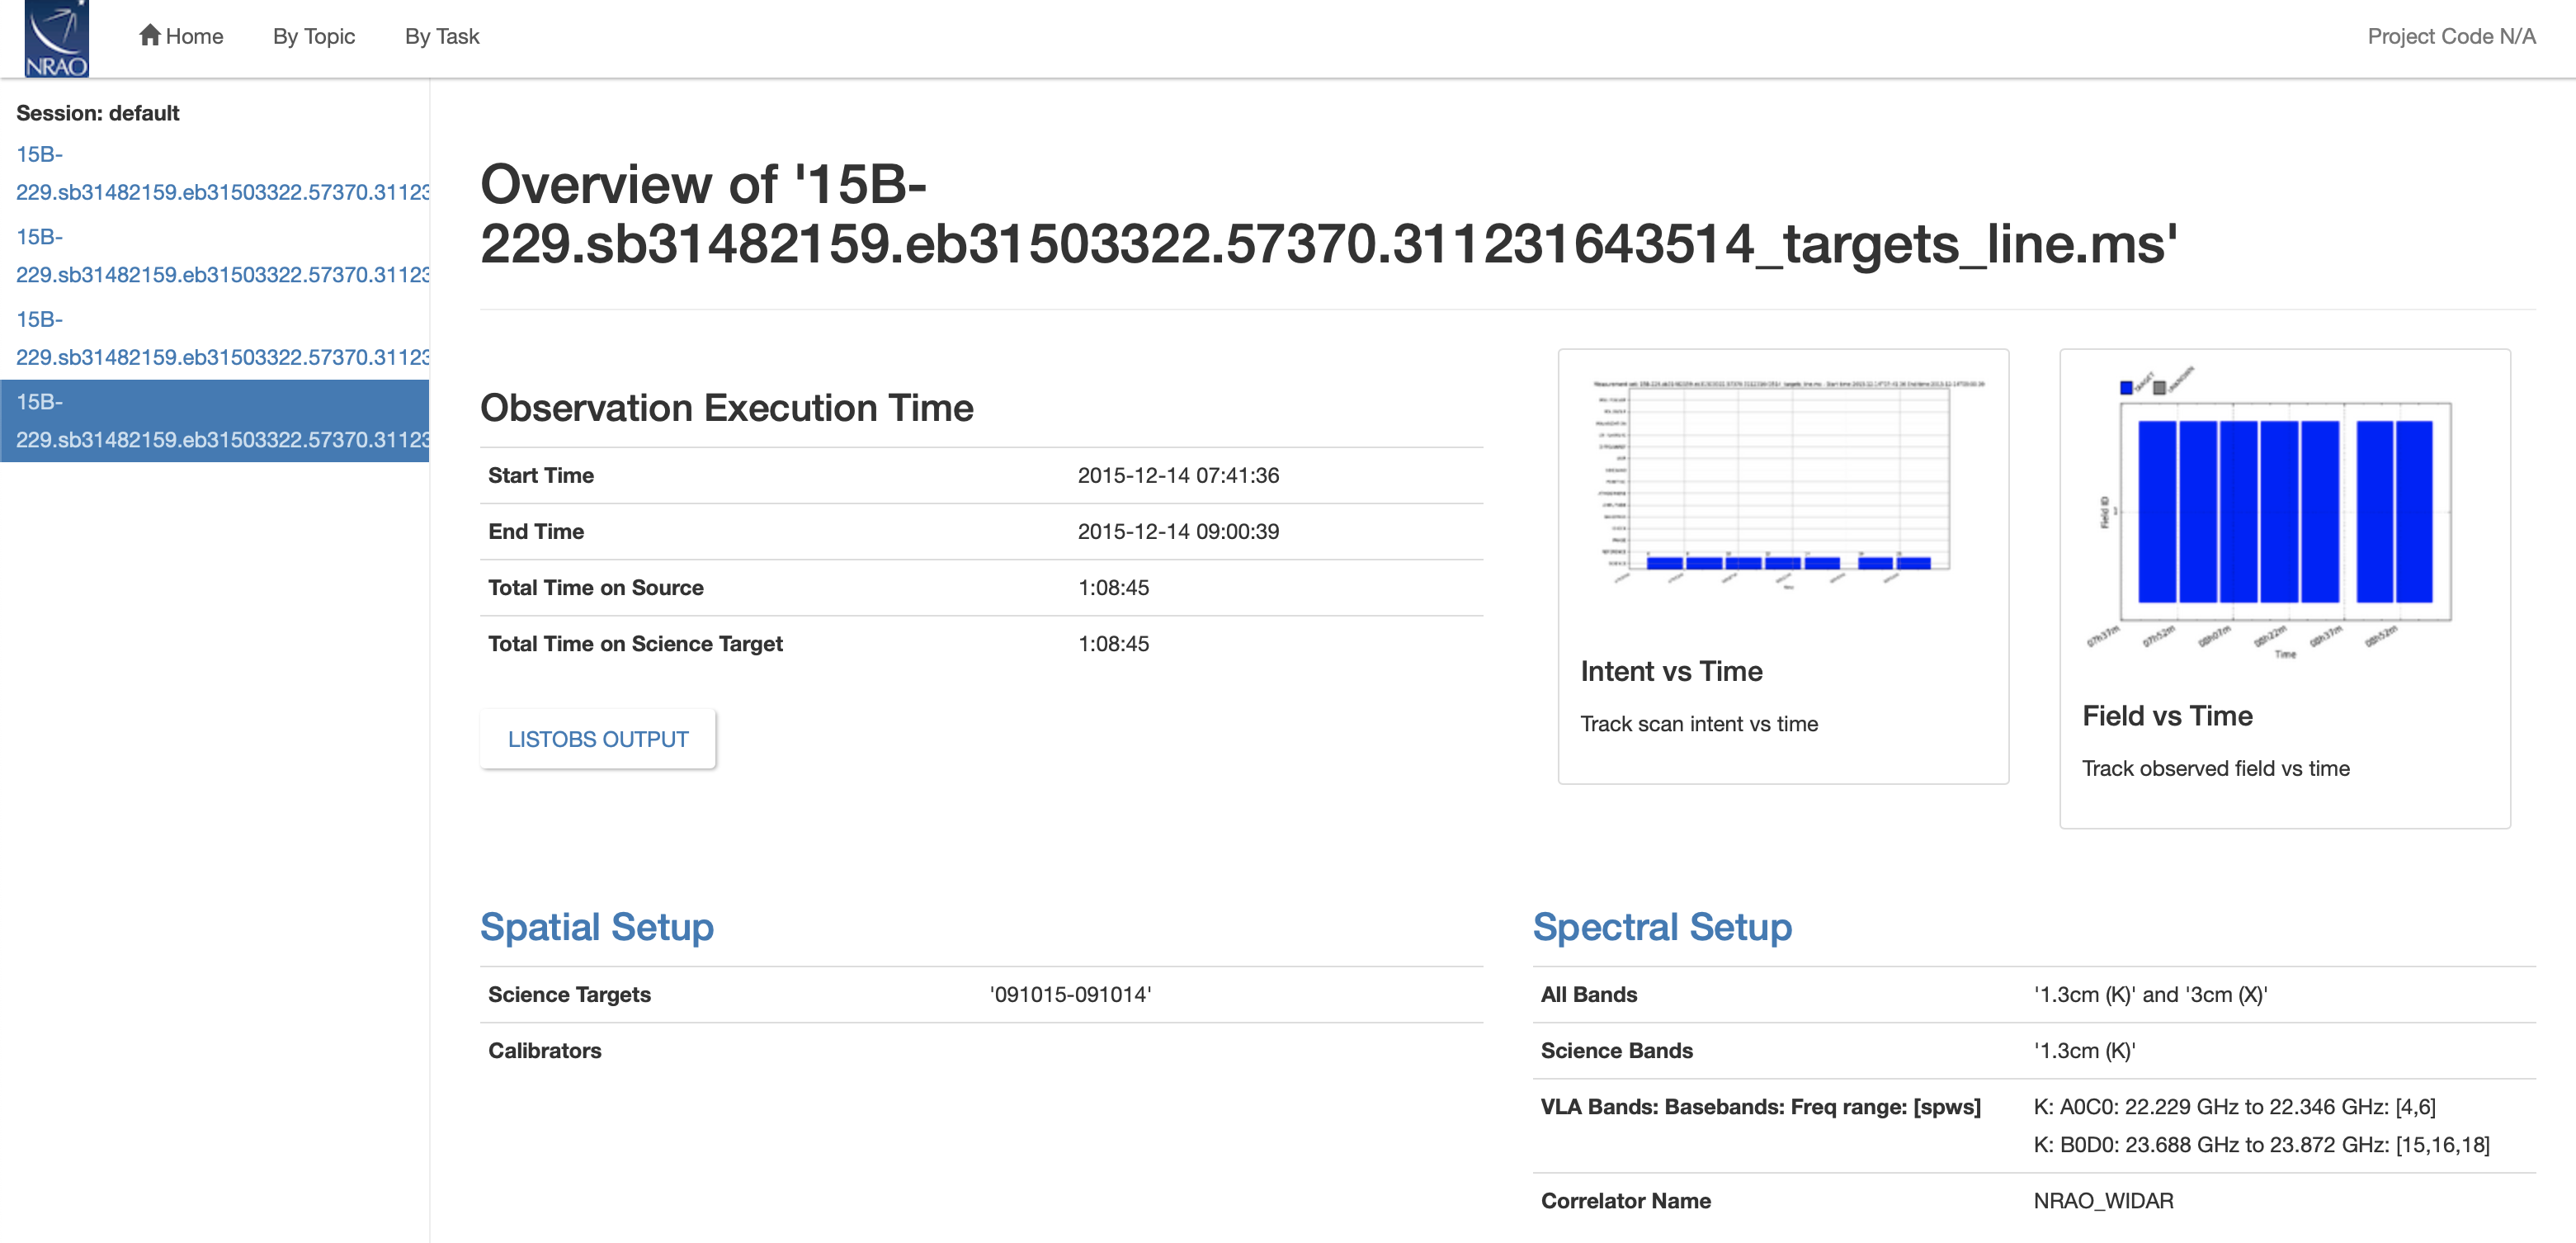
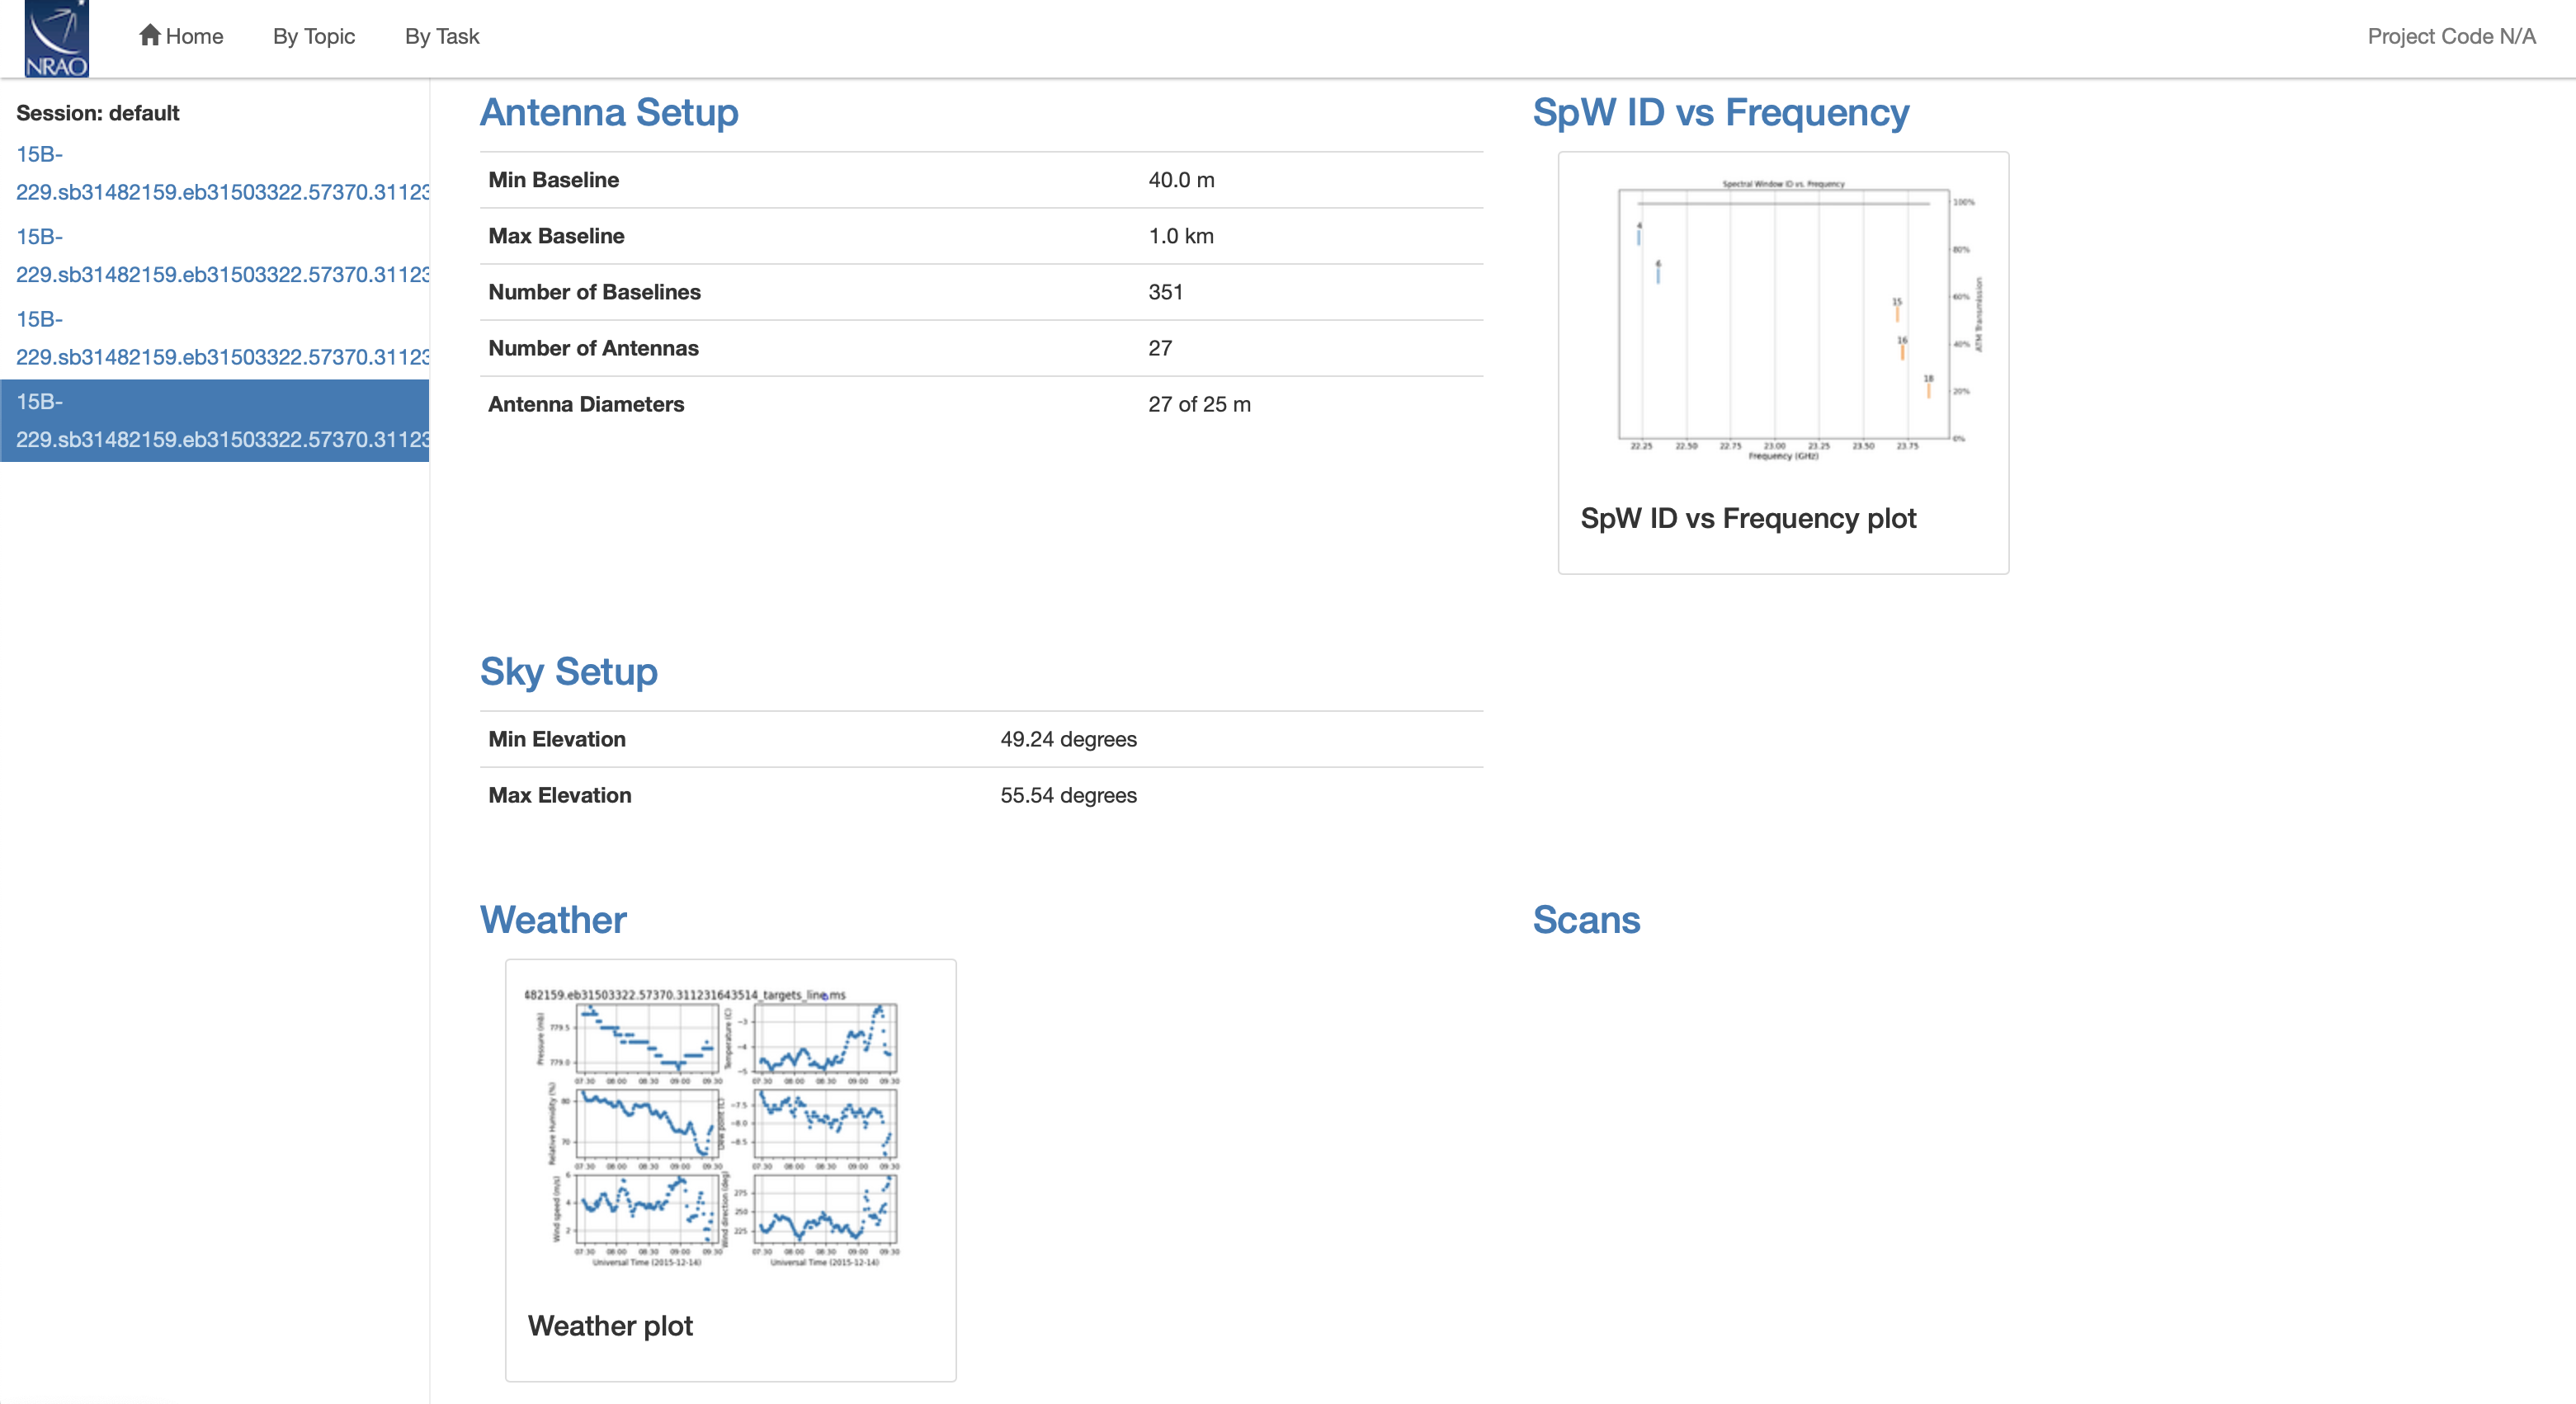
Overview Screen
 |
 |
 |
By Topic Screen
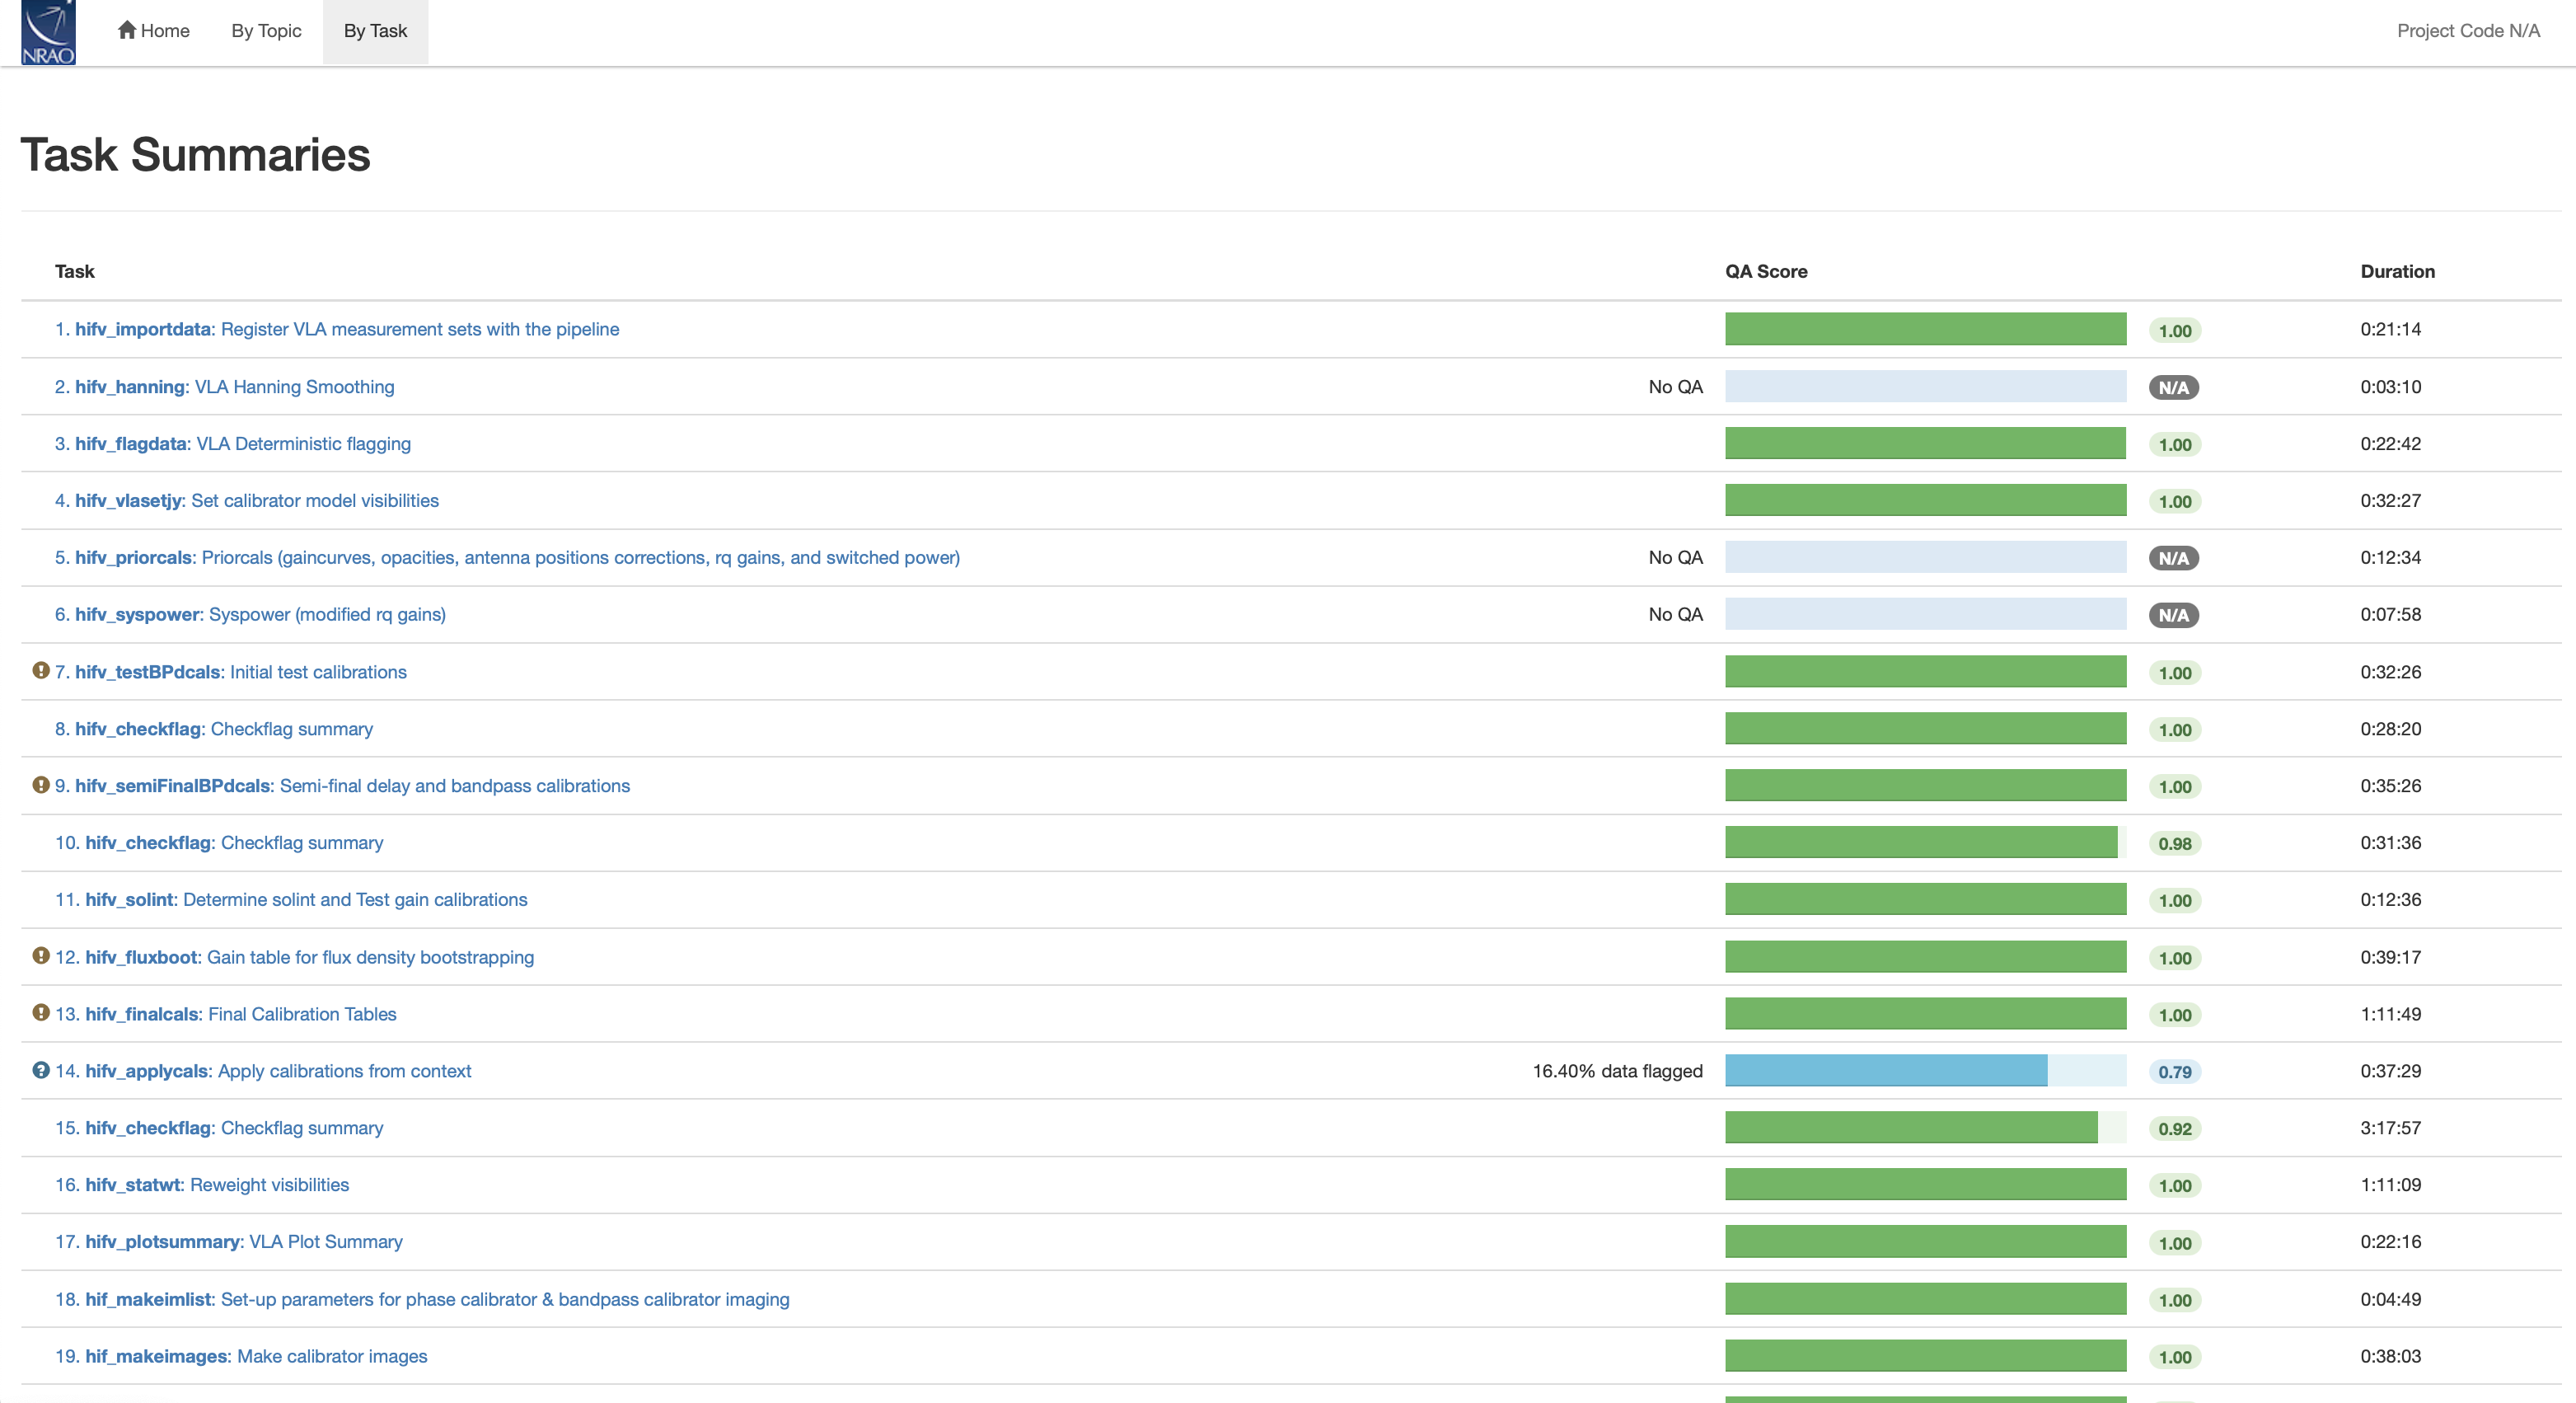
By Task Screen: Overview of the Pipeline Heuristic Stages
The individual Stages
Most of the first 24 stages are very similar to the continuum processing, and we refer to S-band Continuum Pipeline Guide for details. We will only focus on the differences and the extra steps that are performed for spectral line data.
 |
 |
Stage 1. hifv_importdata: Register VLA measurement sets with the pipeline
The only difference to the continuum processing is that the hifv_importdata stage will try to identify spectral line windows. Any spw that is more narrow than a typical continuum spw will be treated as containing a spectra line. The automated spectral line spw identification can be turned off and individual spws can be specified in the task hifv_importdata before the run. Details are described in VLA Pipeline.
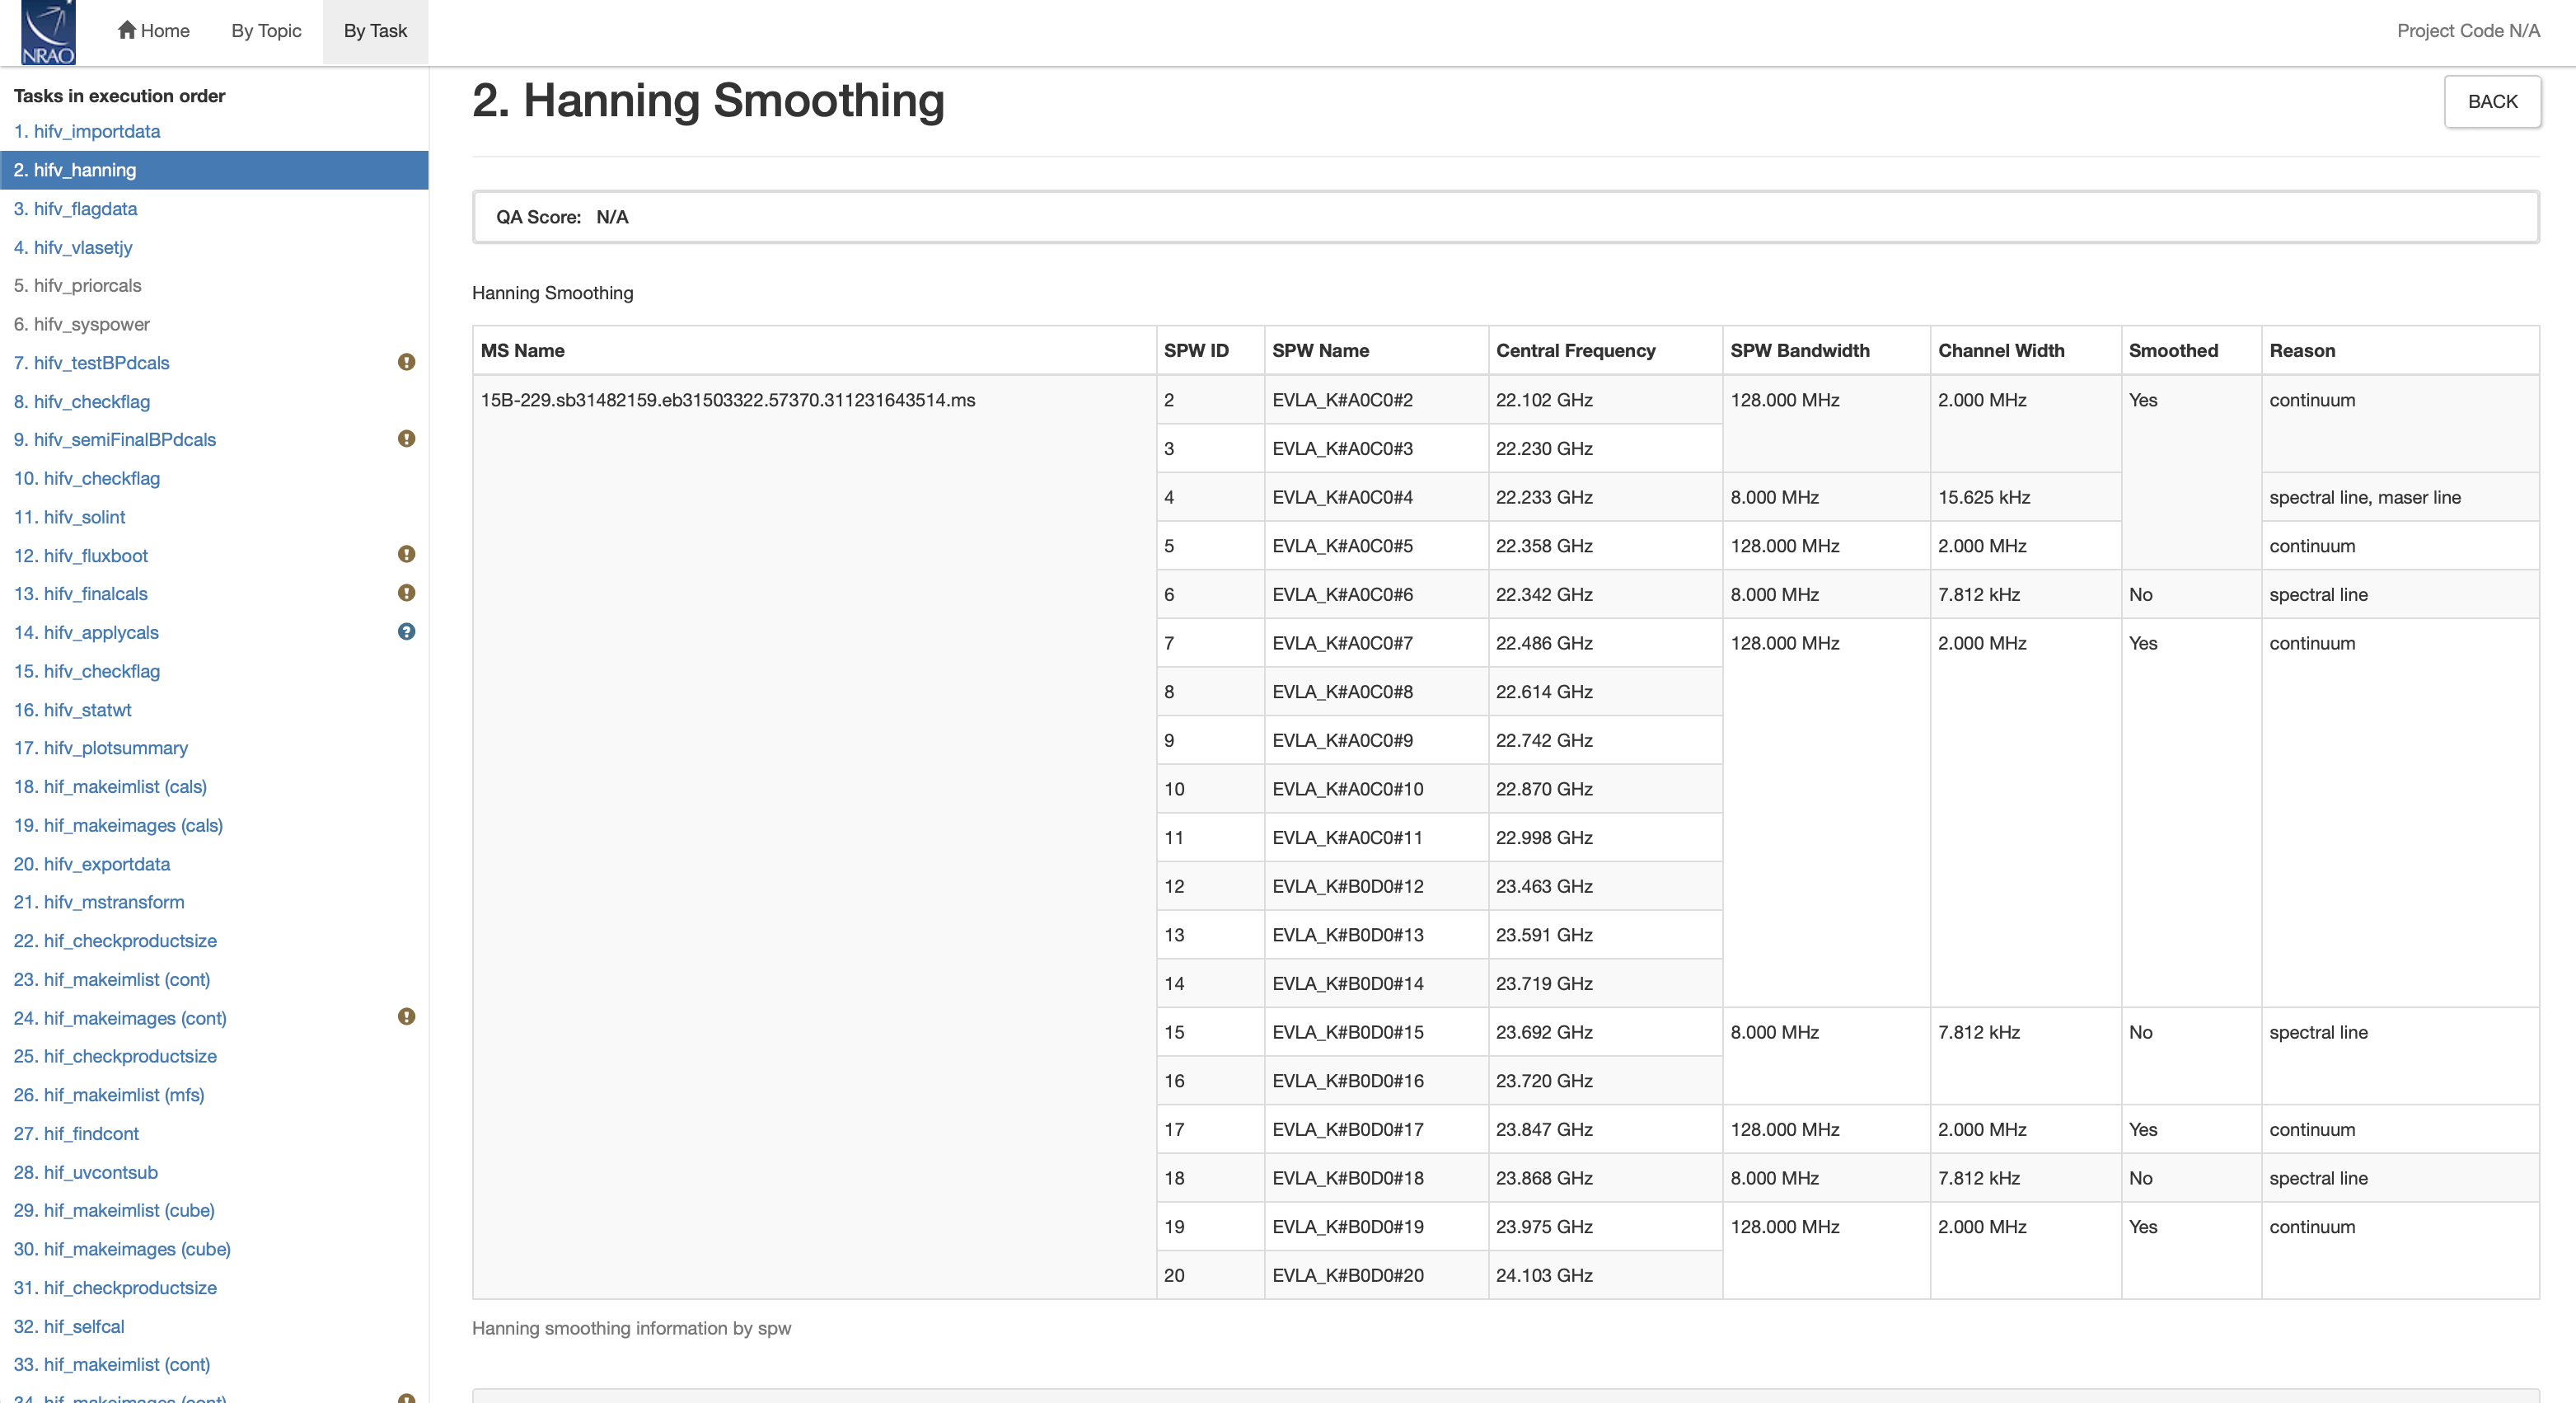
Stage 2. hifv_hanning: VLA Hanning Smoothing
Hanging Smoothing is only useful when the Gibbs effect, originating from strong, narrow band emission is dominating the entire spw. Hanging smoothing will reduce the effect but will also reduce the spectral resolution. Typically only strong RFI and maser lines evoke the Gibbs effect for the JVLA. The continuum and maser spws will receive Hanning smoothing in the pipeline. Thermal spectral lines are usually too weak for a strong Gibbs effect and to retain the spectral resolution is more important. Those spws will not be Hanning smoothed. The maser spw identification is based on known maser rest frequencies. The maser detection can be turned off as described in VLA Pipeline.
 |
Stages 3 to 24
These stages are identical to the continuum processing described in the S-band Continuum Pipeline Guide. Spectral line spws are not treated any differently from continuum spws.
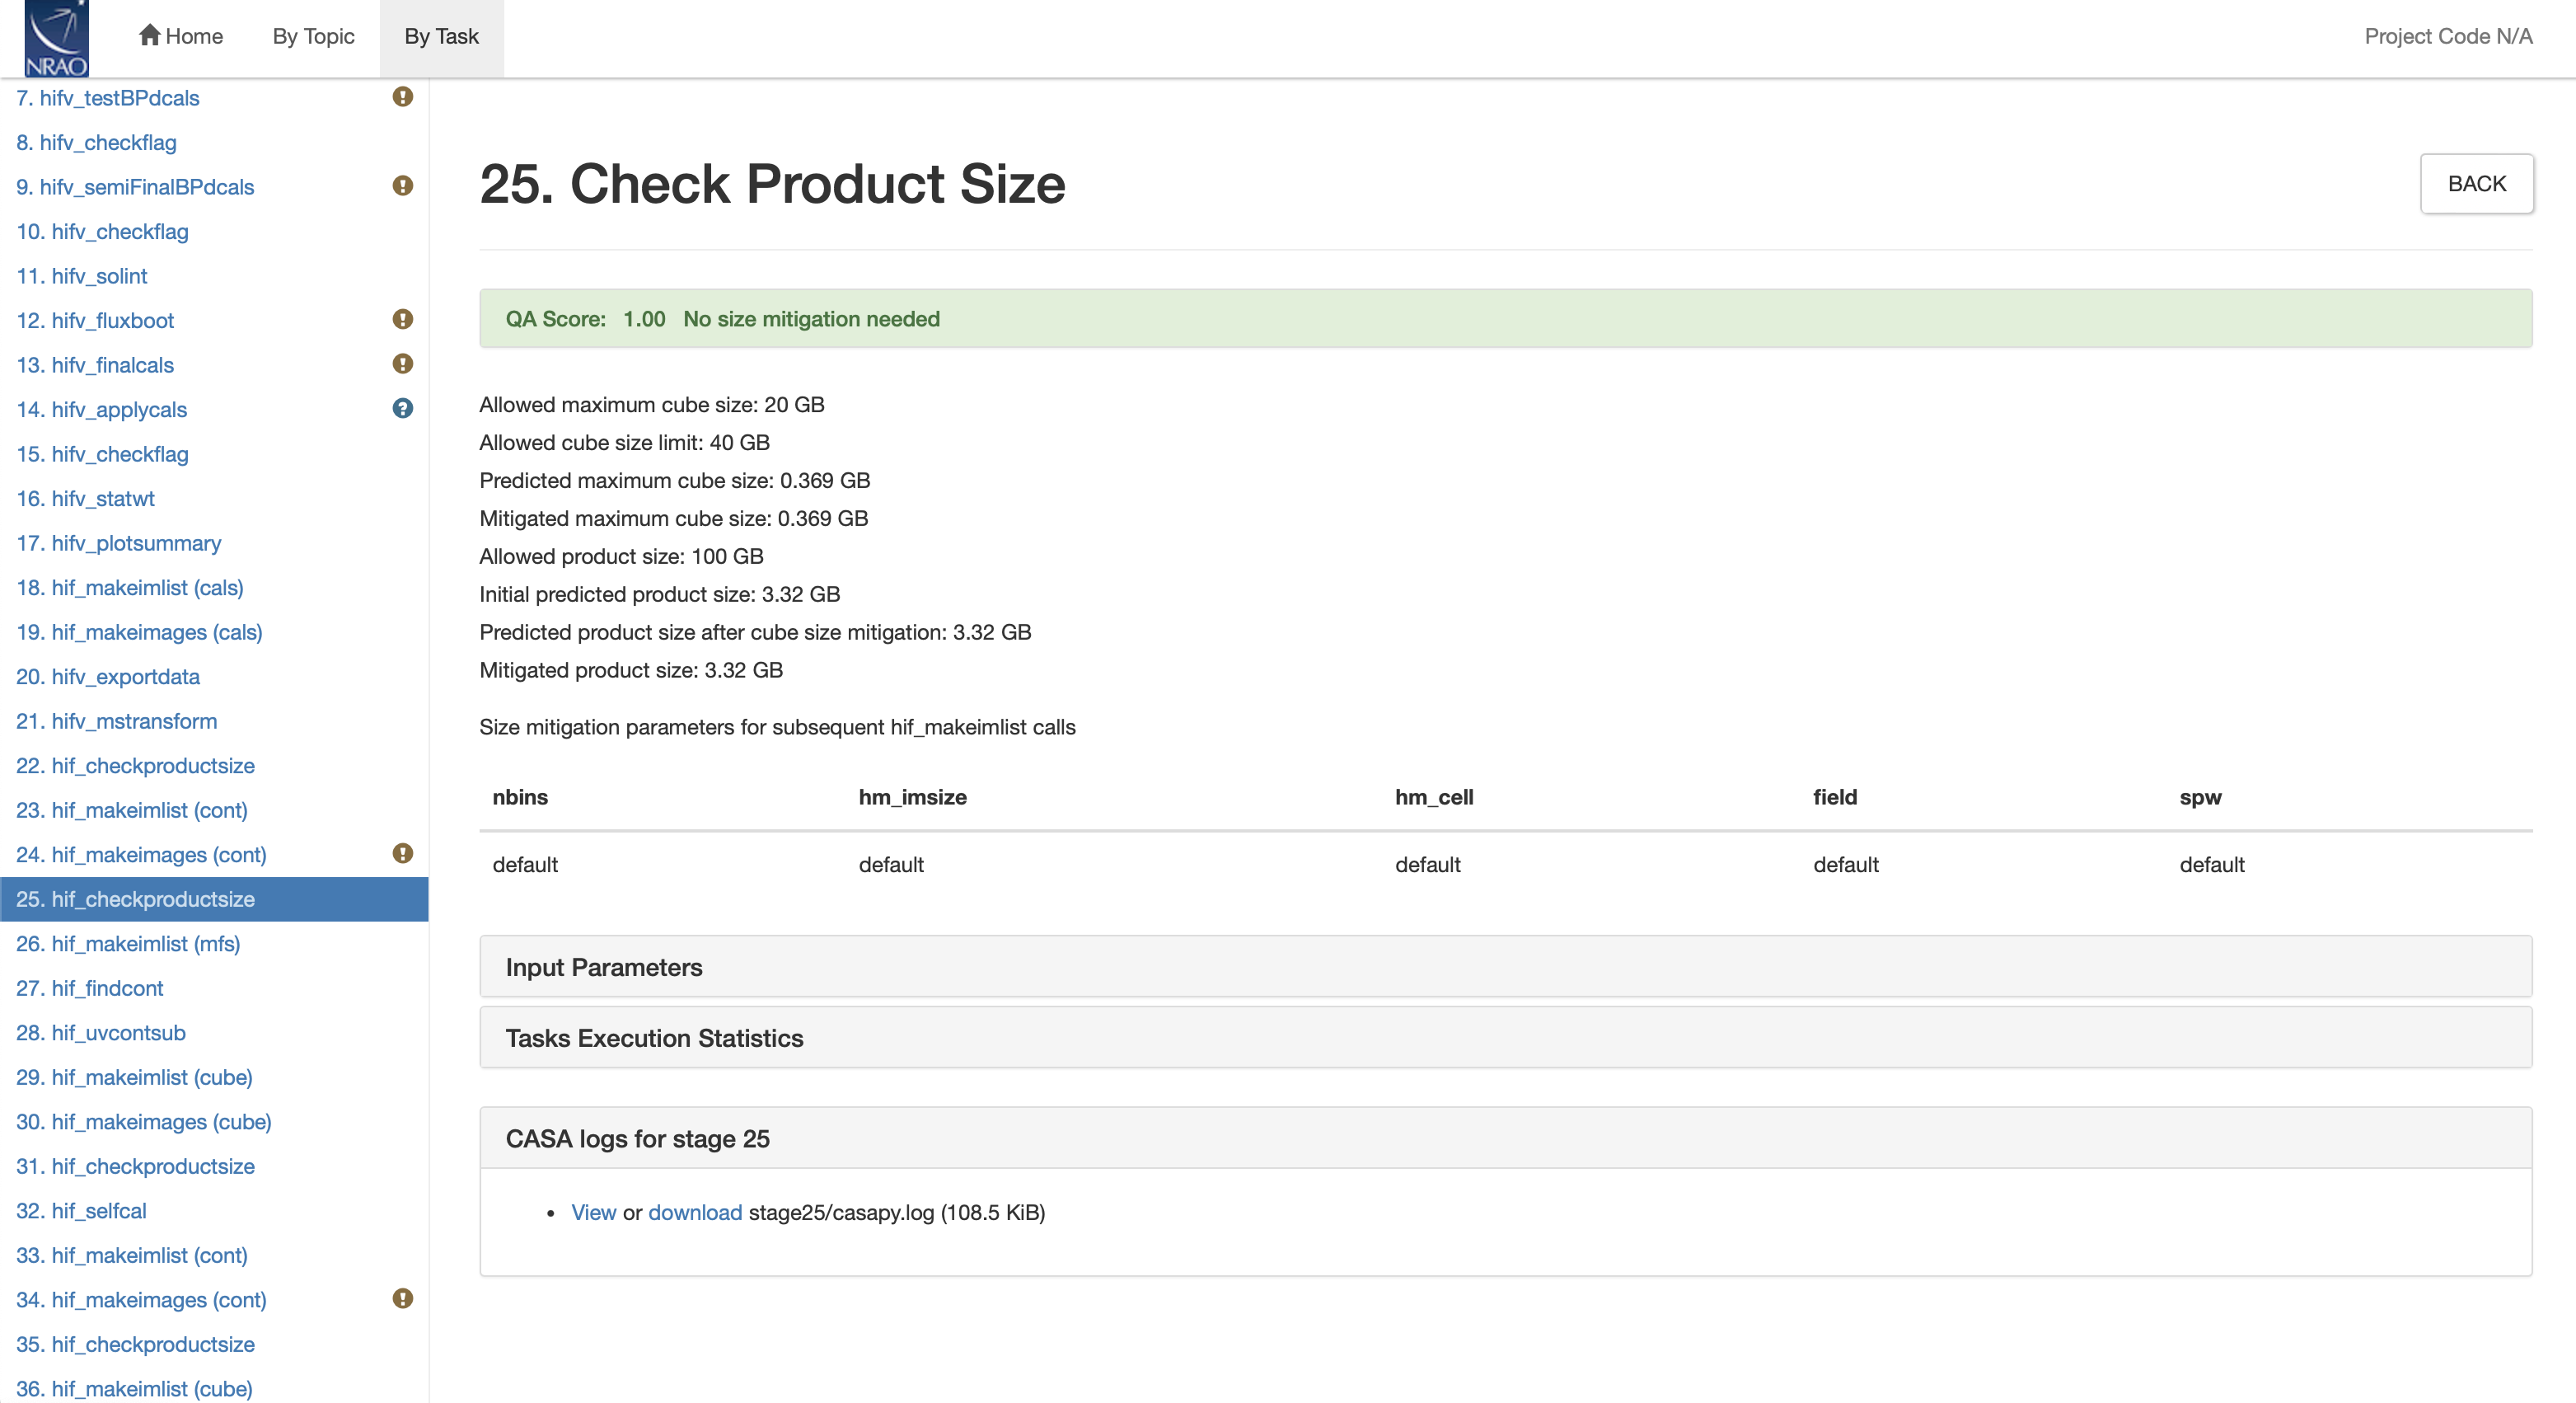
Stage 25. hif_checkproductsize: Check Product Size
 |
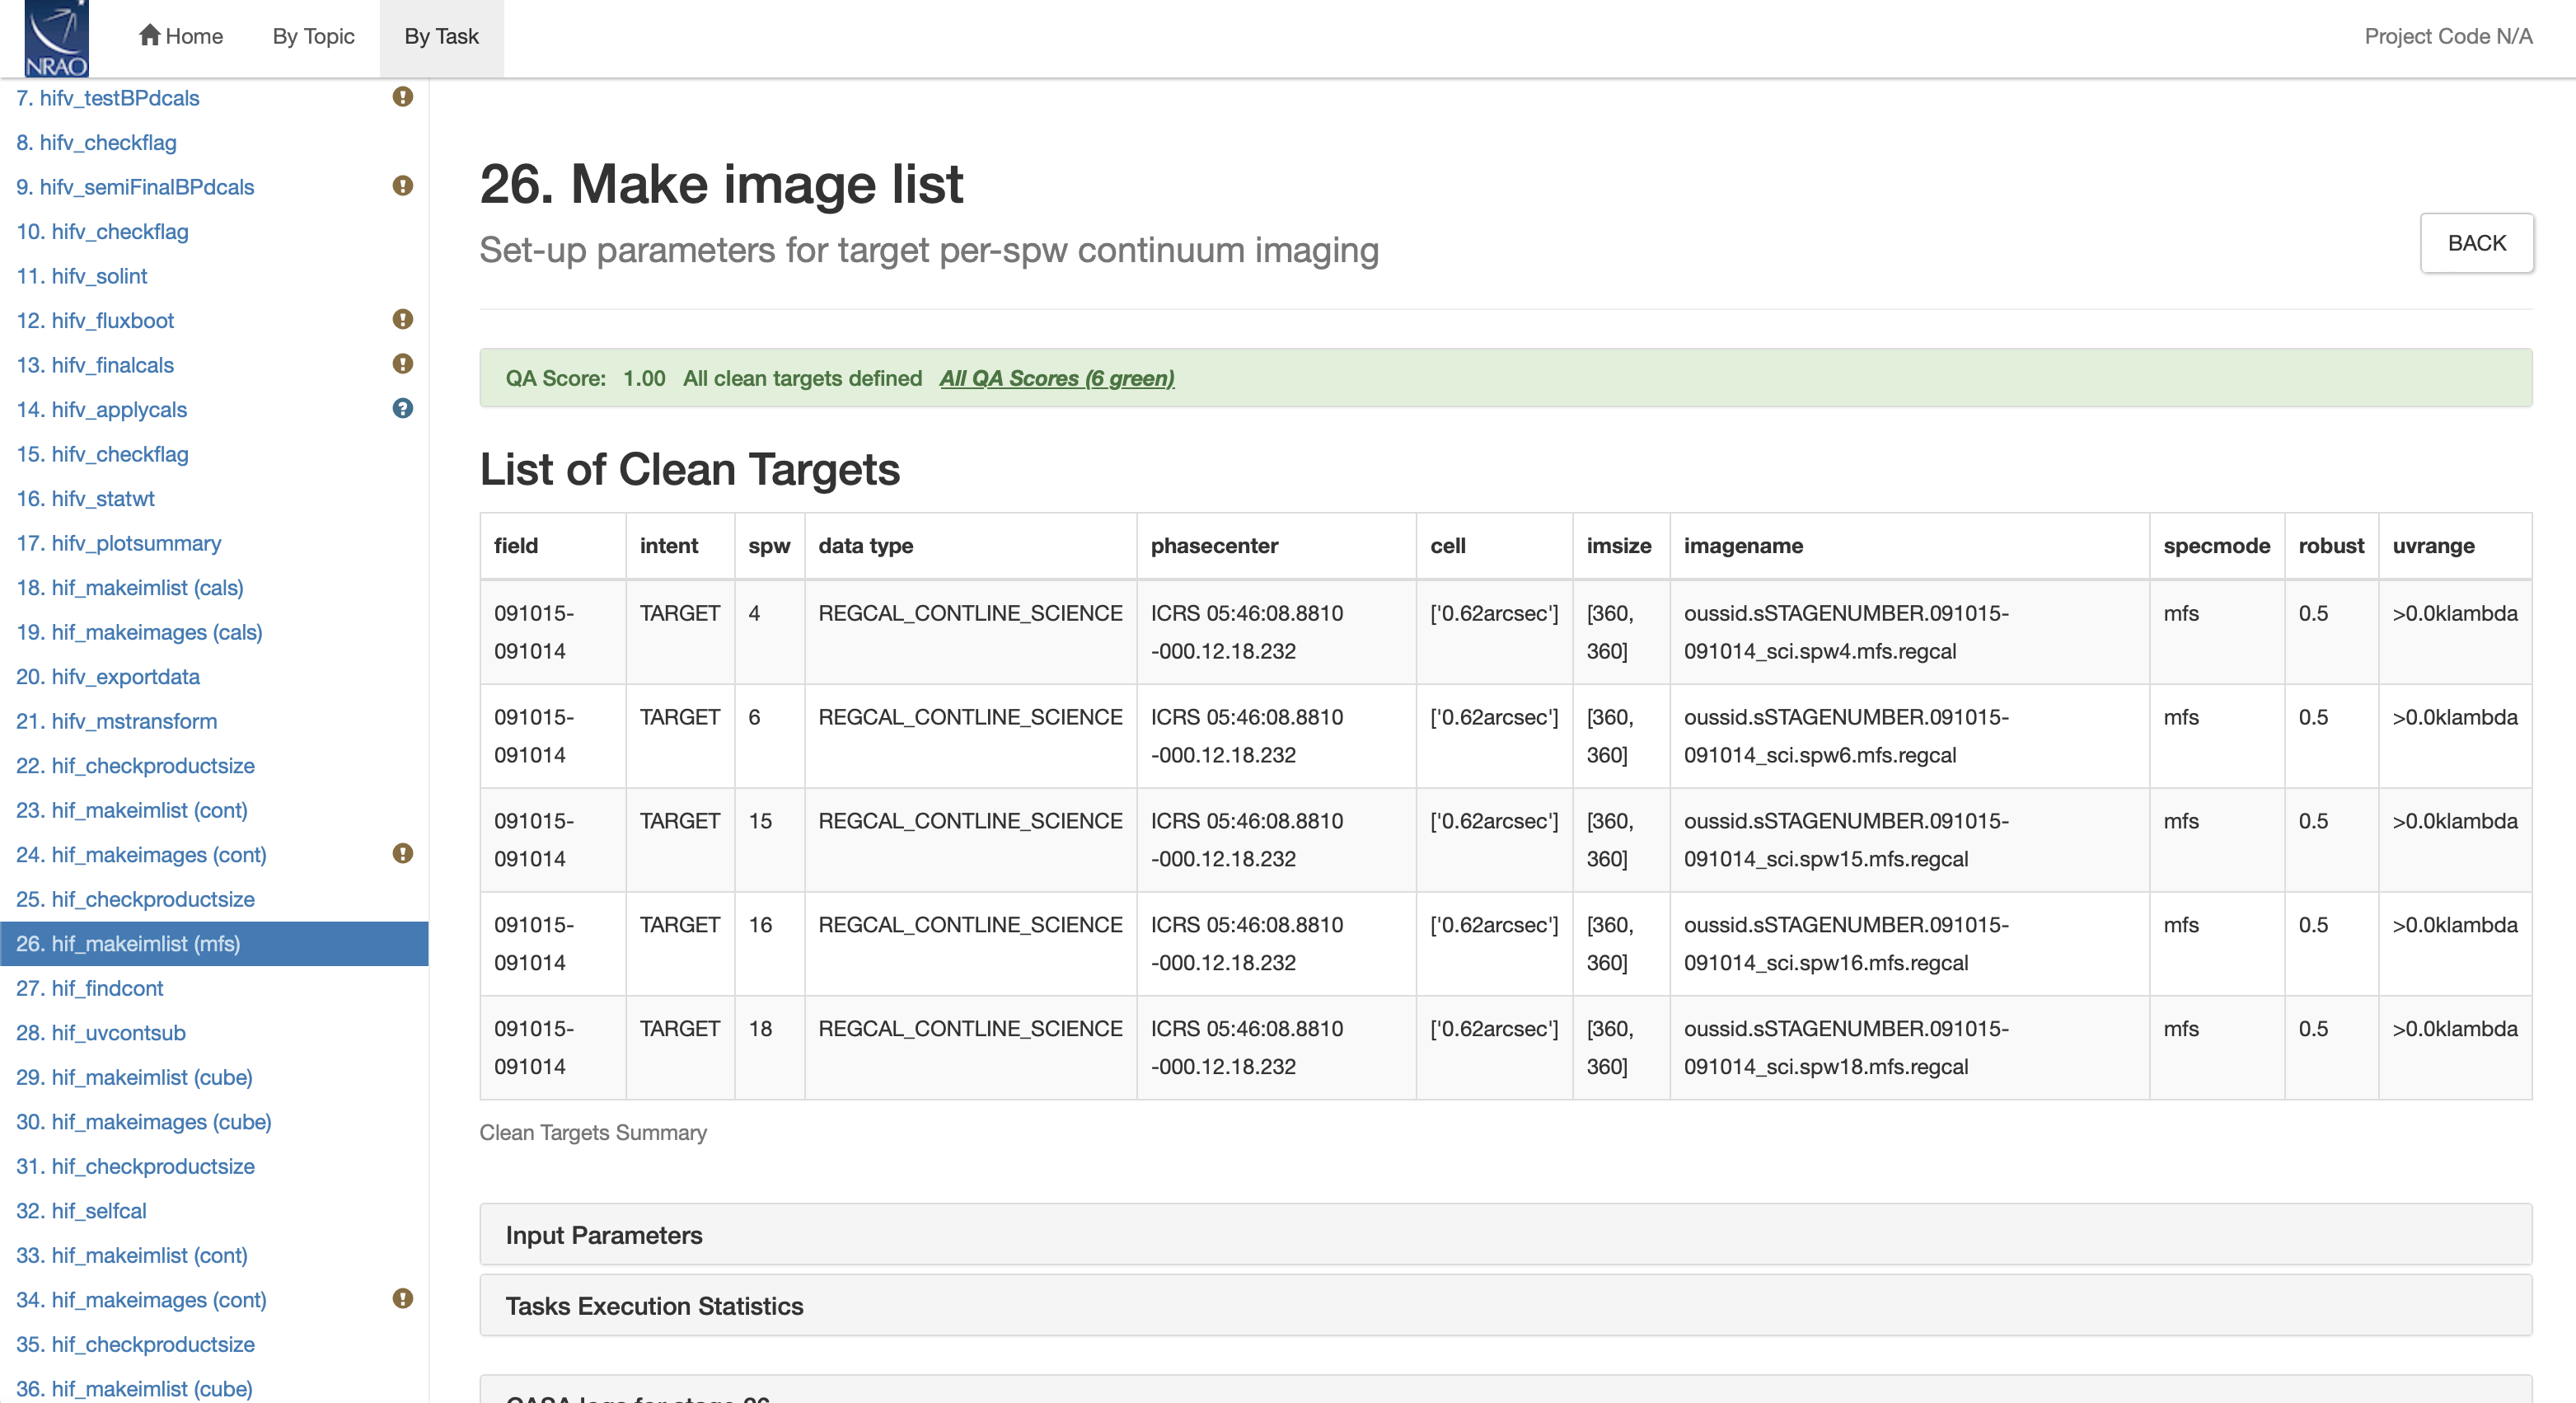
Stage 26. hif_makeimlist (mfs): Make image list; Set-up parameters for target per-spw continuum imaging
 |
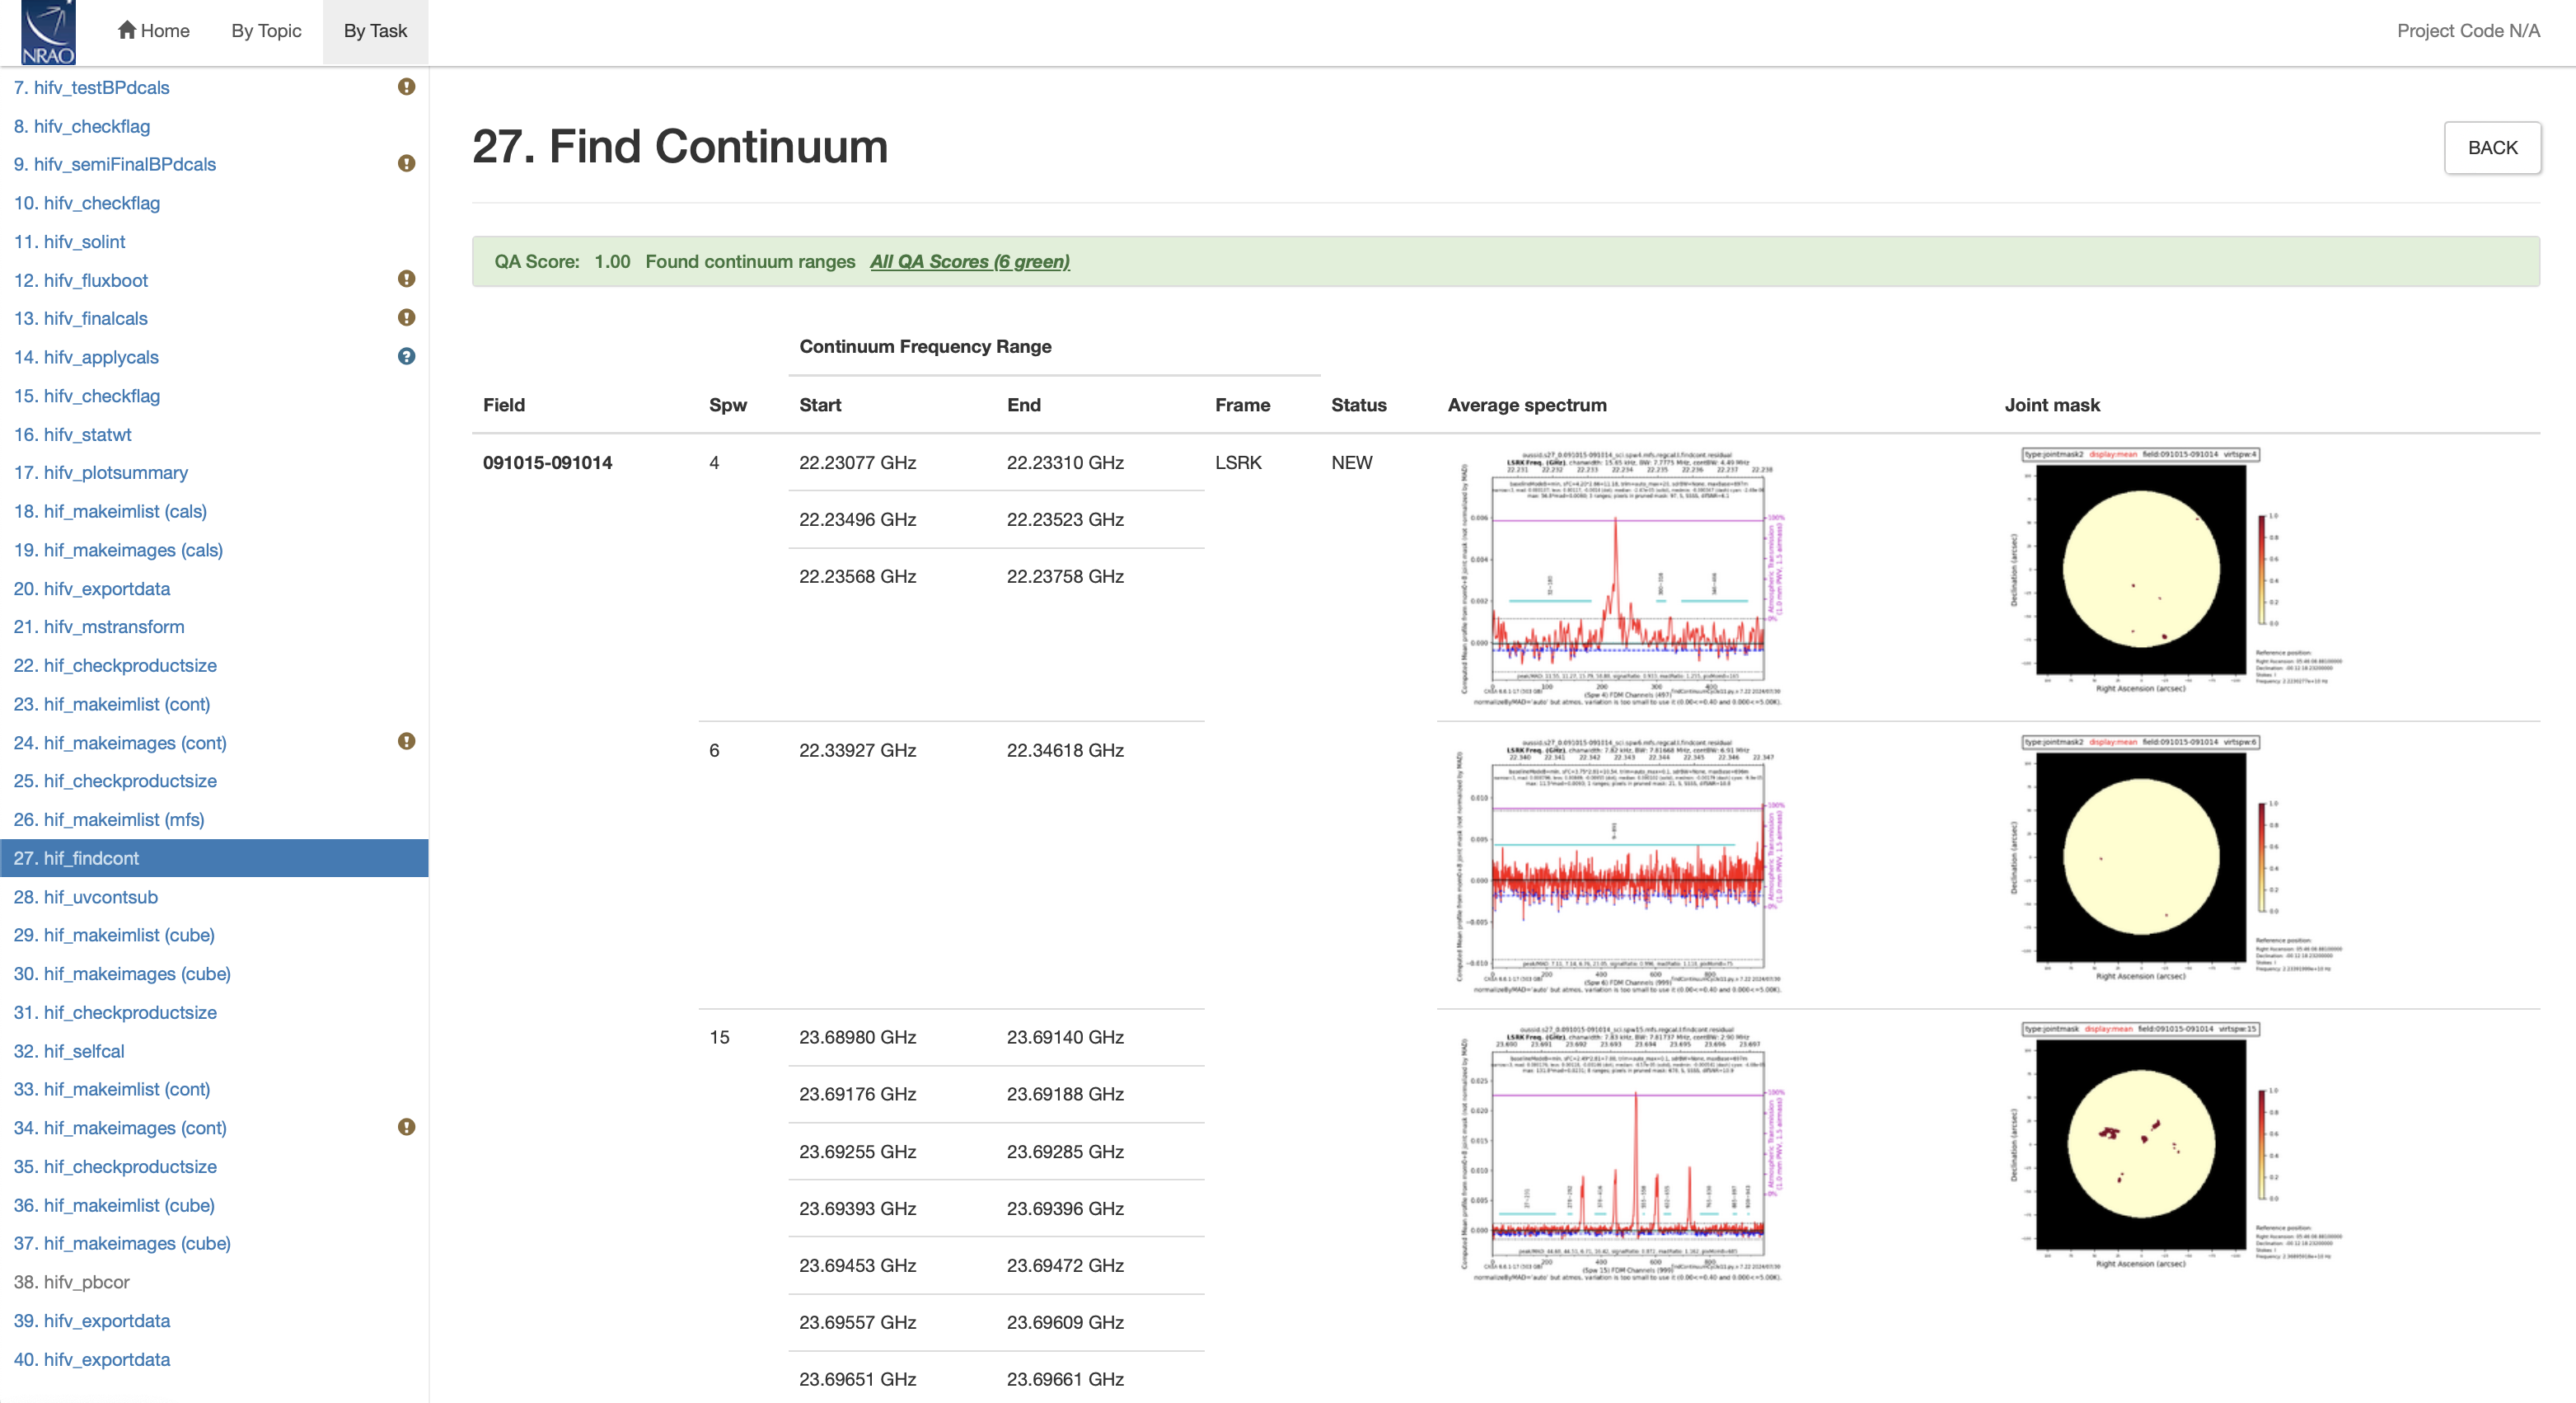
Stage 27. hif_findcont: Find Continuum
 |
 |
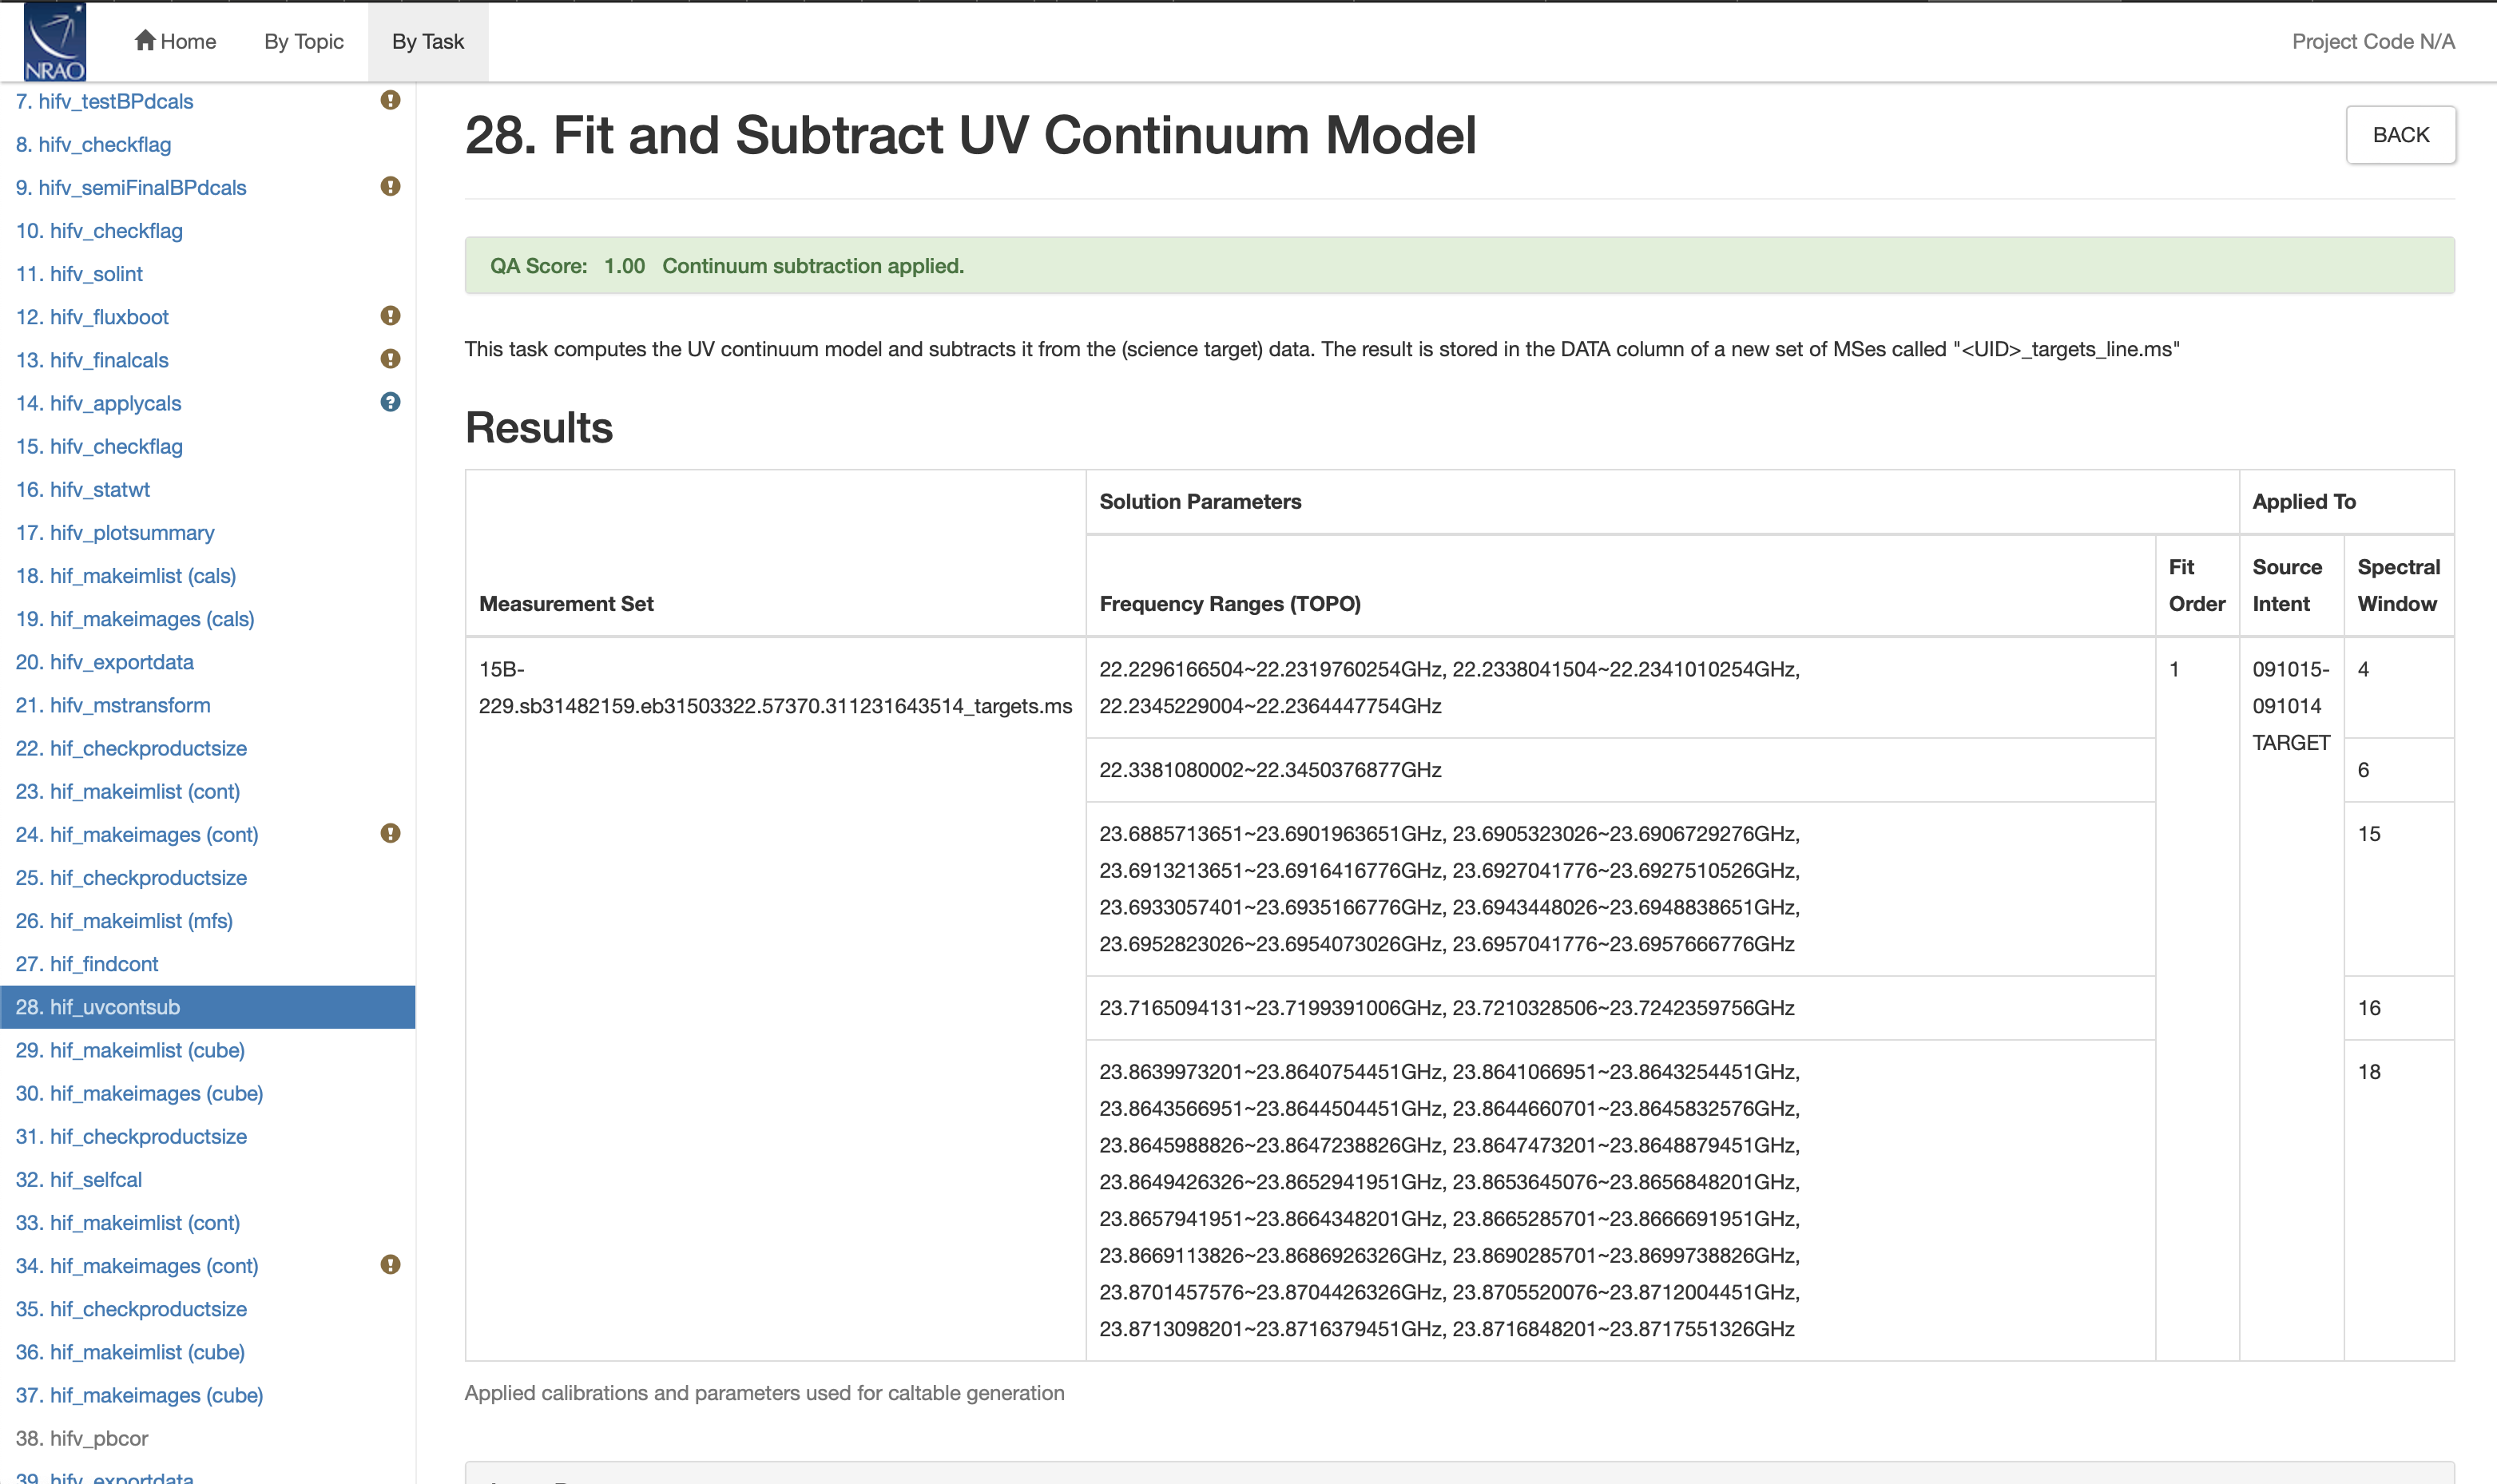
Stage 28. hif_uvcontsub: Fit and Subtract UV Continuum Model
 |
Stage 29. hif_makeimlist (cube): Make image list; Set-up parameters for target cube imaging
 |
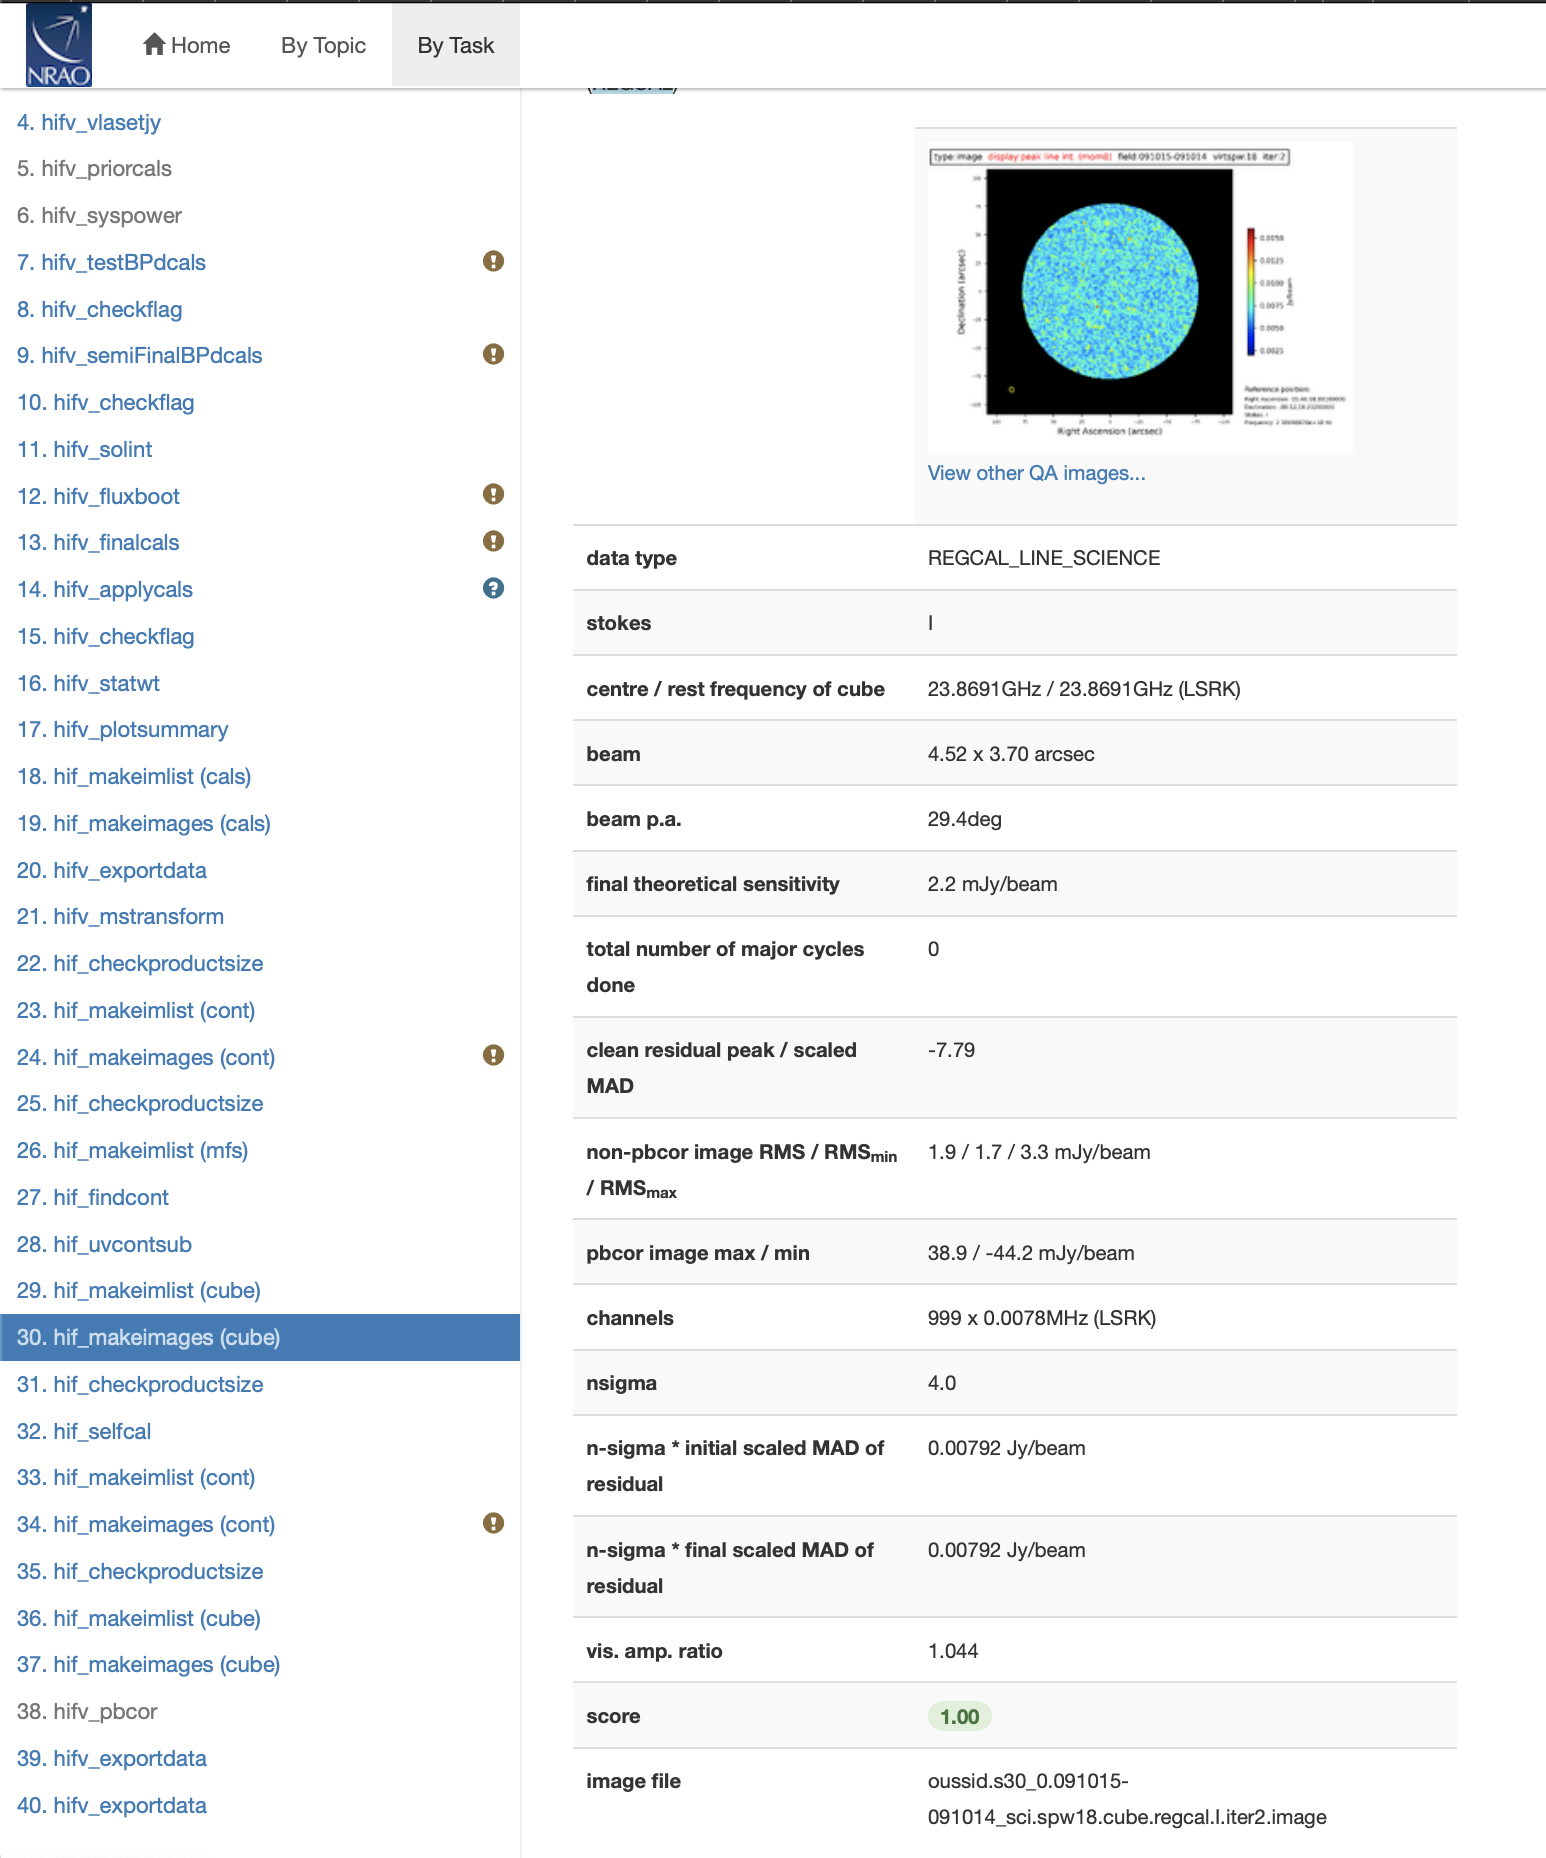
Stage 30. hif_makeimages (cube): MakeImages; Make target cubes
 |
 |
Stage 31. hif_checkproductsize: Check Product Size
 |
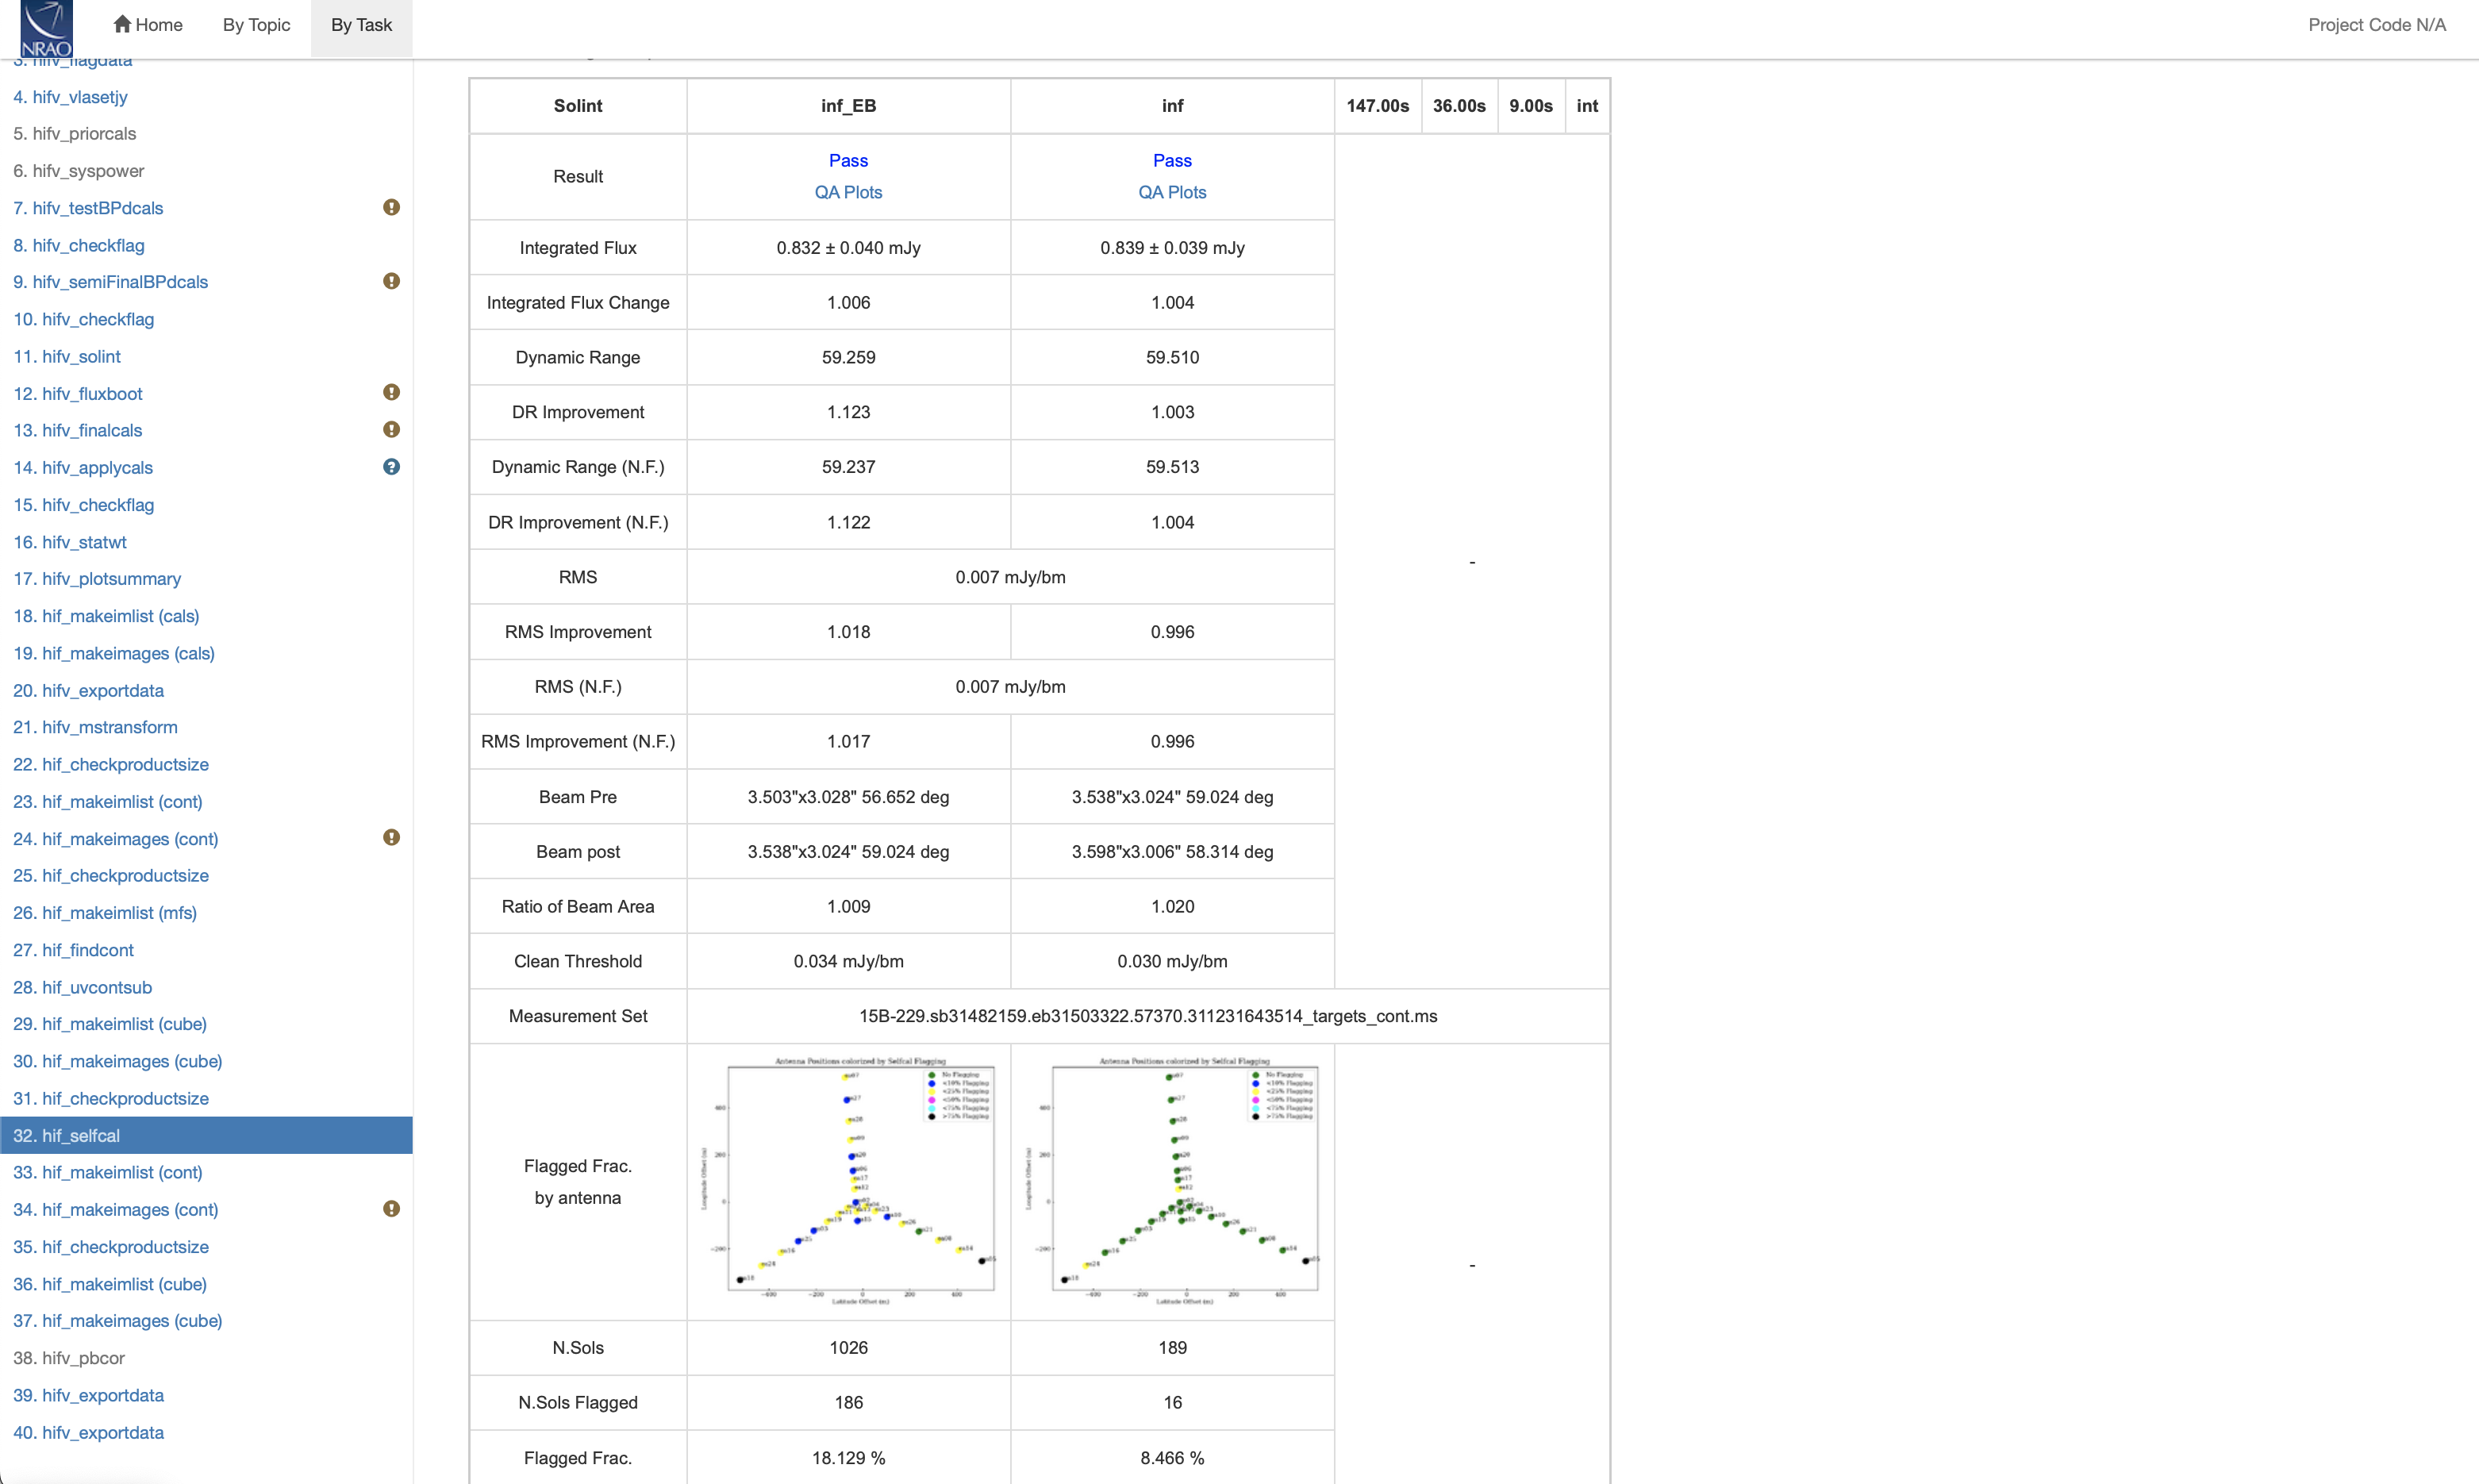
Stage 32. hif_selfcal: Self-Calibration using the science target visibilities
 |
 |