NGC3256Band3
Science Target Overview


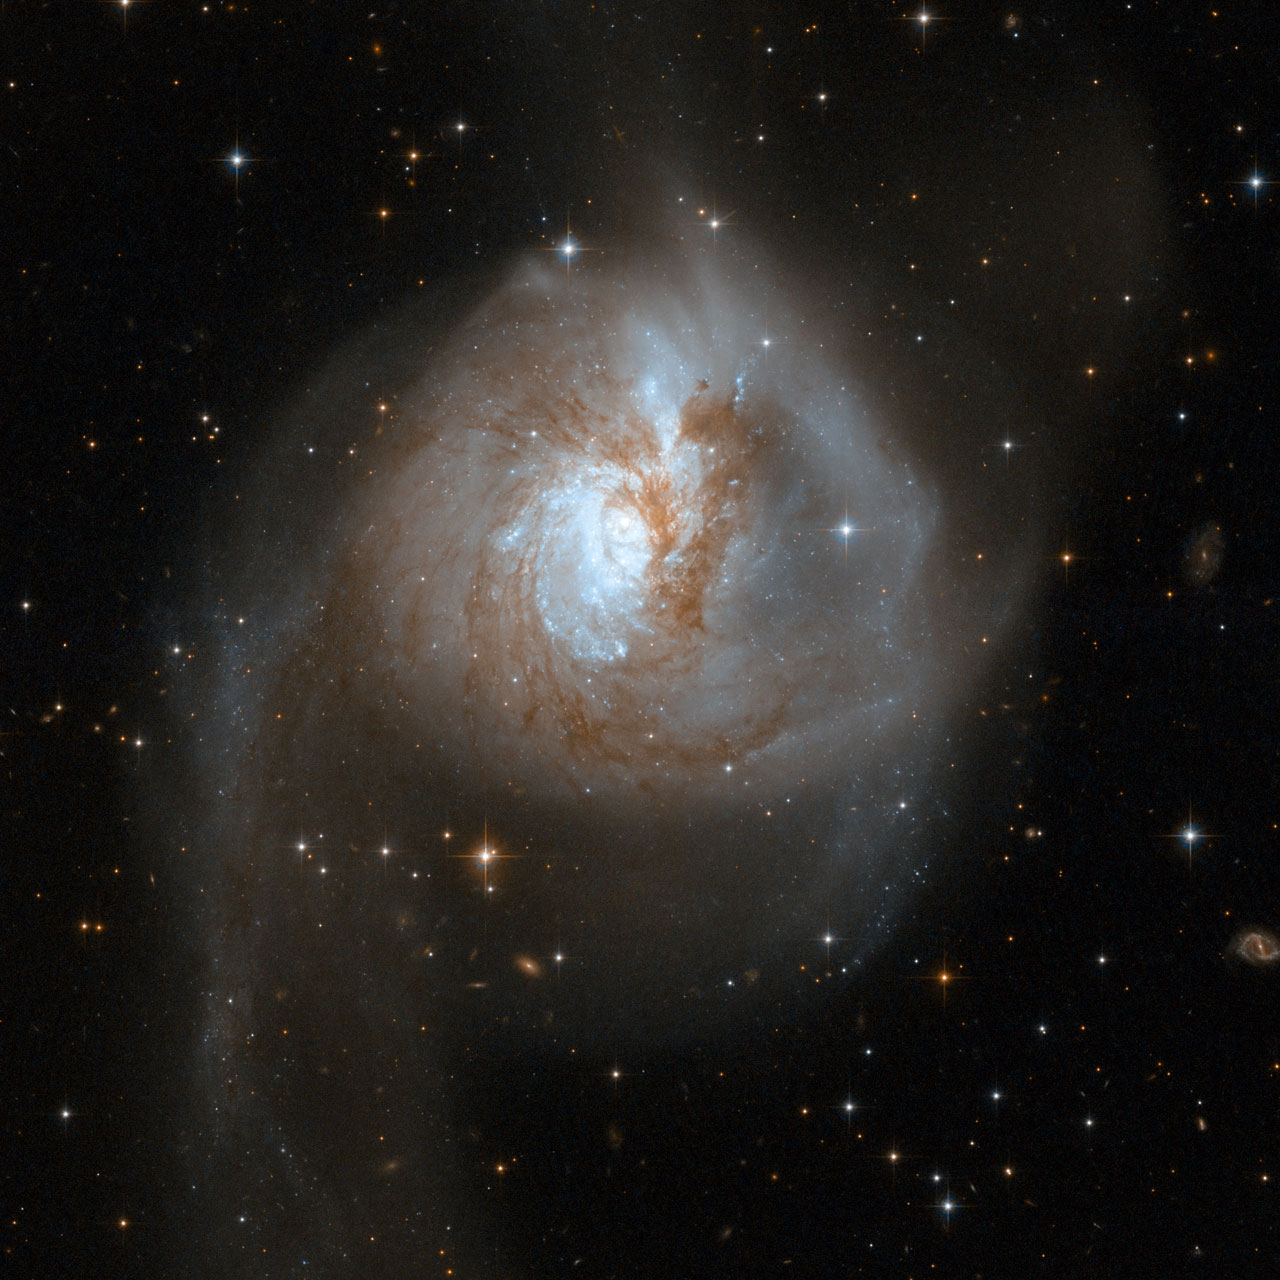
The luminous infrared galaxy NGC 3256 is the brightest galaxy within ~40 Mpc. This galaxy, which is in the later stages of a merger between two gas-rich progenitors, hosts an extreme central starburst that can be seen across a wide range of wavelengths but emits most strongly in the far infrared (Smith & Harvey 1996). Hubble Space Telescope optical imaging has revealed hundreds of bright young clusters in the galactic center (Trancho et al. 2007). There is also strong evidence for a superwind in NGC 3256, indicating strong starburst-driven blow-out of the interstellar medium (Heckman et al. 2000). Imaging in the infrared, radio and X-rays has shown that NGC 3256 has two distinct nuclei aligned in the north-south direction and separated by 5 arcsec, or 850 pc, on the sky. The southern nucleus is highly obscured, rendering it invisible in the optical.
Because of its proximity and the fact that it is observed nearly face-on, NGC 3256 is an ideal target to study merger-induced starbursts in the local Universe. In fact, NGC 3256 could be regarded as the southern sky equivalent of Arp 220, the archetype of infrared-luminous merging galaxies.
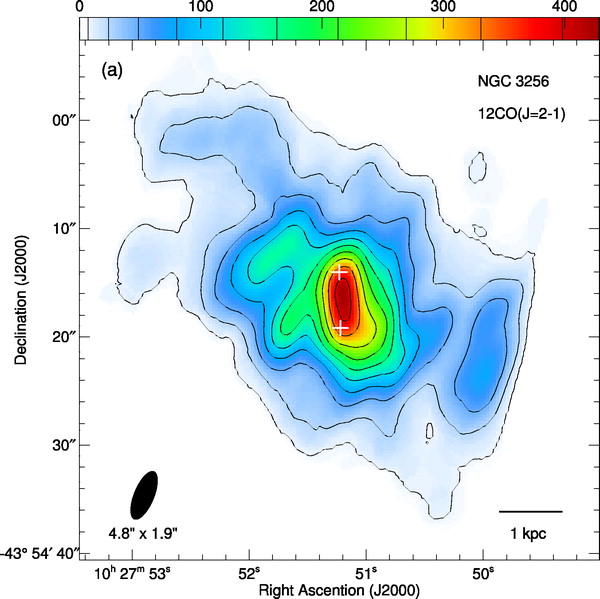
Neutral gas in this galaxy was first studied by English et al (2003), who detected two HI tidal tails that extend up to 50 kpc. High-resolution observations of carbon-monoxide (CO 2-1) in NGC 3256 were made by Sakamoto et al. (2006) using the Submillimeter Array (SMA). This study revealed a large disk of molecular gas (r > 3 kpc) in the center of the merger, with a strong gas concentration toward the double nucleus. This gas disk rotates around a point between the two nuclei. In addition, high-velocity molecular gas was discovered at the galaxy's center, with velocities up to 420 km/s offset from the systemic velocity of the galaxy.
ALMA Data Overview
ALMA Science verification data on NGC3256 in Band 3 were taken in six different datasets over two consecutive nights: April 16-17, 2011. There are three datasets for April 16th and three for April 17th. These Band 3 observations utilized all four available basebands, which are associated with four different spectral windows: two in the Upper Sideband (USB) and two in the Lower Sideband (LSB). The first spectral window is centered on the CO(1-0) emission line in the galaxy NGC 3256 and is our highest frequency spectral window. There is one additional spectral window in the Upper Side Band (USB), and there are two spectral windows in the Lower Side Band (LSB). These additional spectral windows are used to measure the continuum emission in the galaxy and may contain other emission lines as well. Each spectral window has a total bandwidth of 2 GHz divided over 128 channels, for a channel width of 15.625 MHz, corresponding to about 40 km/s. Online Hanning smoothing was applied to the data, resulting in a spectral resolution that is twice the channel separation. For the antenna configuration that was used during these observations, the angular resolution is expected to be about 6.5".
Due to unfortunate weather conditions during the days planned for these observations, the data were taken at Band 3 although no previous interferometric CO(1-0) observations of this galaxy exist. Casoli et al. (1990) observed the CO(1-0) line with the SEST 15 single dish telescope and were just able to measure a velocity field with 22" resolution. Interferometric observations were first made with the SMA in the CO(2-1) line by Sakamoto, Ho & Peck (2006). Because those observations were made at a higher frequency, the angular resolution is higher (~2") than that of the ALMA observations shown here, taken in a very compact configuration. Nonetheless, it is possible to make a direct comparison of the distribution and velocity of the CO(2-1) and (1-0) gas by looking, for example, at the south-western clump and the north-eastern 'arm', which are consistent in both data sets.
We thank the following people for suggesting NGC3256 for ALMA Science Verification: Kazushi Sakamoto, Satoki Matsushita.
Obtaining the Data
To download the data, click on the region closest to your location:
Here you will find three gzipped tar files which, after unpacking, will create three directories:
- NGC3256_Band3_UnCalibratedMSandTablesForReduction - Here we provide you with "starter" datasets, where we have taken the raw data in ALMA Science Data Model (ASDM) format and converted them to CASA Measurement Sets (MS). We did this using the importasdm task in CASA. Along with the raw data, we also provide some tables that you will need for the calibration which cannot currently be generated inside of CASA (for Early Science, these tables will either be pre-applied or supplied with the data).
- NGC3256_Band3_CalibratedData - The fully-calibrated uvdata, ready for imaging and self-calibration
- NGC3256_Band3_ReferenceImages - The final continuum and spectral line images
To see which files you will need, read on below. The downloads to your local computer will take some time, so you may wish to begin them now.
NOTE: CASA 3.3 or later is required to follow this guide. For more information on obtaining the latest version of CASA, see http://casa.nrao.edu.
NGC3256 Data Reduction Tutorial
The tutorial (called a casaguide) for reducing these data using CASA version 3.4 has been split into calibration and imaging pages:
1) NGC3256_Band3_Calibration_for_CASA_3.4
2) NGC3256_Band3_Imaging_for_CASA_3.4
To complete the Calibration section of the tutorial, you will need the data in the first directory: NGC3256_Band3_UnCalibratedMSandTablesForReduction. For those wishing to skip the calibration section and proceed to Imaging, we also provide the fully-calibrated data in the NGC3256_Band3_CalibratedData directory. Finally, we provide the final continuum and spectral line images in the NGC3256_Band3_ReferenceImages directory.
NOTE: CASA 3.4 (≥ r19874) is required to process the data using the guides above see http://casa.nrao.edu/casa_obtaining.shtml. The data products have not changed. The older CASA 3.3 versions are still available at: NGC3256_Band3_-_Calibration_for_CASA_3.3 and NGC3256_Band3_-_Imaging_for_CASA_3.3.
For a similar tutorial on the reduction of ALMA Band 7 data on TW Hydra, see the casaguide TWHydraBand7.
How to use this casaguide
For both portions of the guide, we will provide you with the full CASA commands needed to carry out each step.
# In CASA
The commands you need to execute
will be displayed in regions
like this.
Simply copy and paste the commands in order into your CASA terminal. You may also type the commands in by hand if desired, but be mindful of typos. Note that you may need to hit Enter twice in order for the process to start running. Also note that copying and pasting multiple commands at a time may not work, so only copy and paste the contents of one region at a time.
To learn how to extract the CASA commands into an executable python script, click here.
Occasionally we will also show output to the CASA logger:
This output will be displayed
in regions like this.
For a brief introduction to the different ways CASA can be run, see the EVLA_Spectral_Line_Calibration_IRC+10216#How_to_Use_This_casaguide page. For further help getting started with CASA, see Getting_Started_in_CASA.
Martin Zwaan, Jacqueline Hodge 07:18 UT, 31 May 2011