File list
From CASA Guides
Jump to navigationJump to search
This special page shows all uploaded files.
| Date | Name | Thumbnail | Size | User | Description | Versions |
|---|---|---|---|---|---|---|
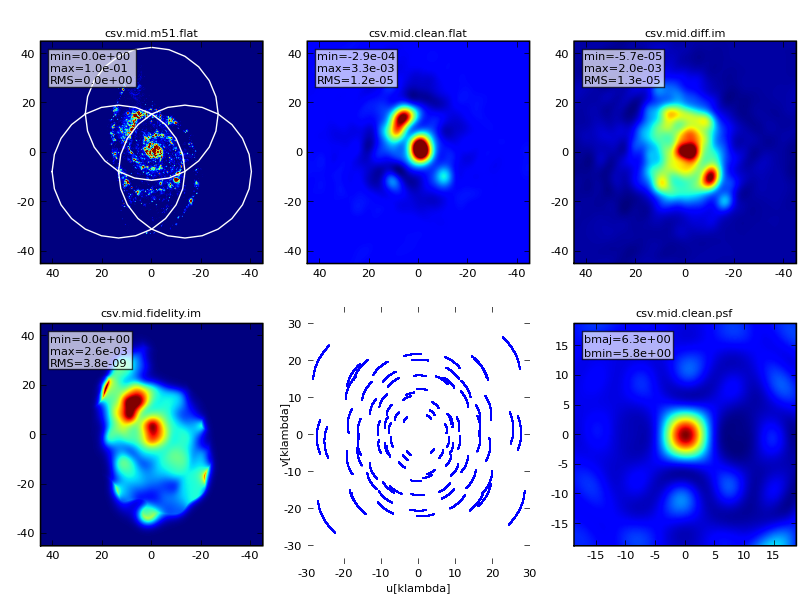
| 01:51, 19 May 2010 | Csv.mid.png (file) |  |
177 KB | Dk3wc | 1 | |
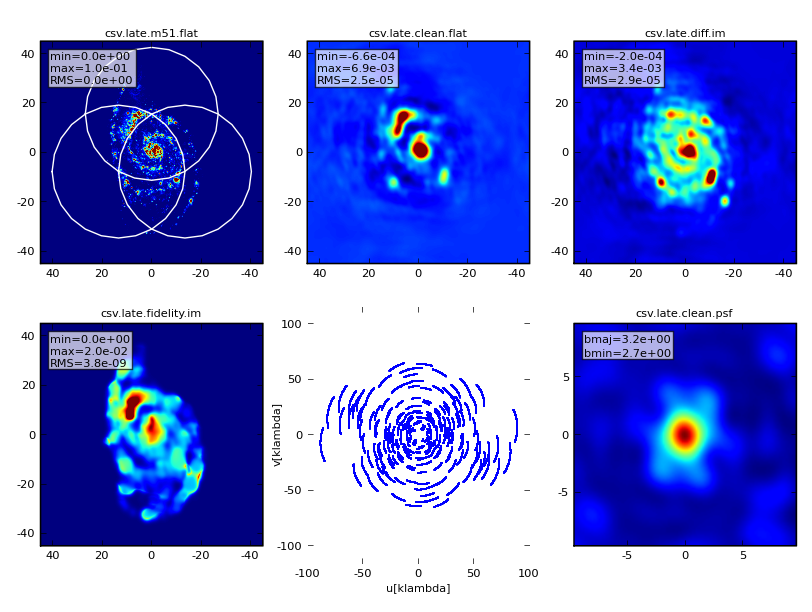
| 01:50, 19 May 2010 | Csv.late.png (file) |  |
192 KB | Dk3wc | 1 | |
| 22:46, 18 May 2010 | Simdata2.png (file) |  |
60 KB | Dk3wc | 1 | |
| 22:45, 18 May 2010 | Simdata.png (file) |  |
47 KB | Dk3wc | 1 | |
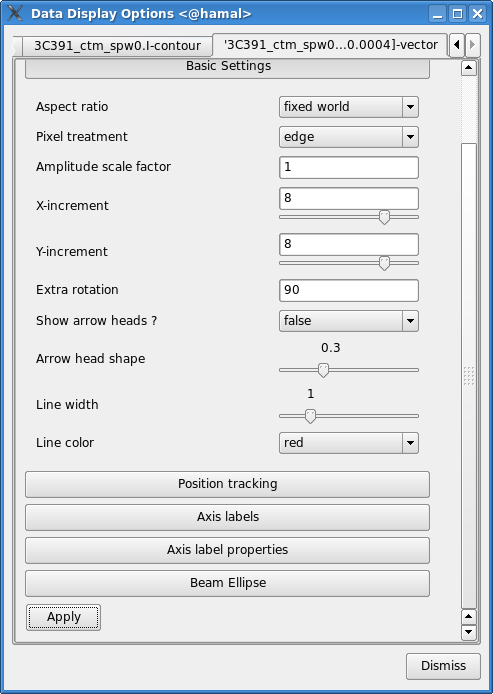
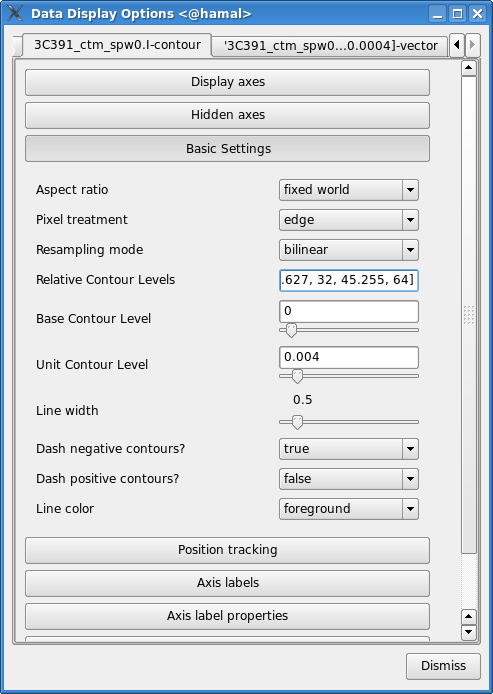
| 21:16, 18 May 2010 | 3C391 full pol image vector settings.png (file) |  |
45 KB | Jmiller | Data Display Options GUI for the position angle vectors in the final polarization image of 3C391. | 1 |
| 21:15, 18 May 2010 | 3C391 full pol image i settings.png (file) |  |
51 KB | Jmiller | Selections for data display of the total intensity (I) image of 3C391, in the Data Display Options GUI | 1 |
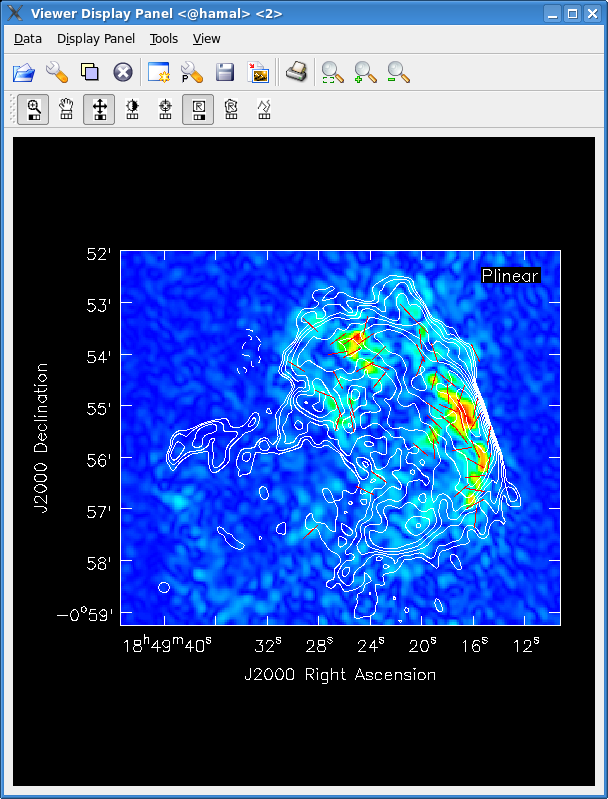
| 21:12, 18 May 2010 | 3C391 full pol image.png (file) |  |
121 KB | Jmiller | Final polarization image of 3C391. The linear polarization (P) is shown in color, white contours show the total intensity image (I), and red vectors show the orientation of the magnetic field where the linear polarization is >5 sigma. | 1 |
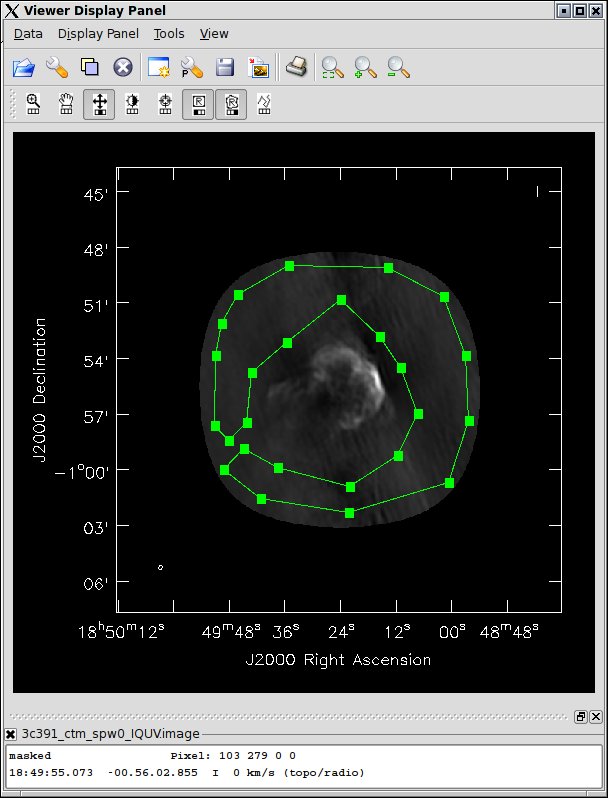
| 20:08, 18 May 2010 | 3C391 rmsnoise.jpg (file) |  |
66 KB | Jlazio | polygonal region within which image noise statistics are estimated | 1 |
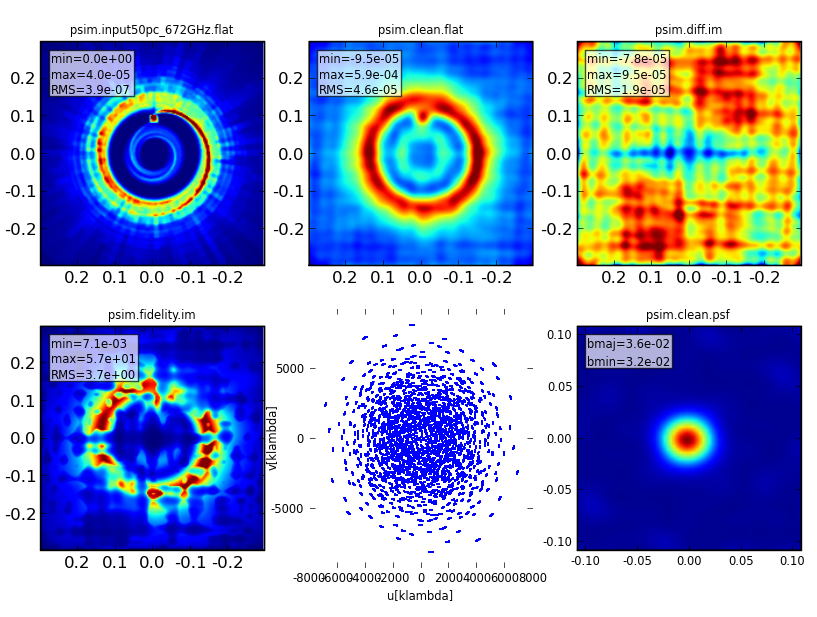
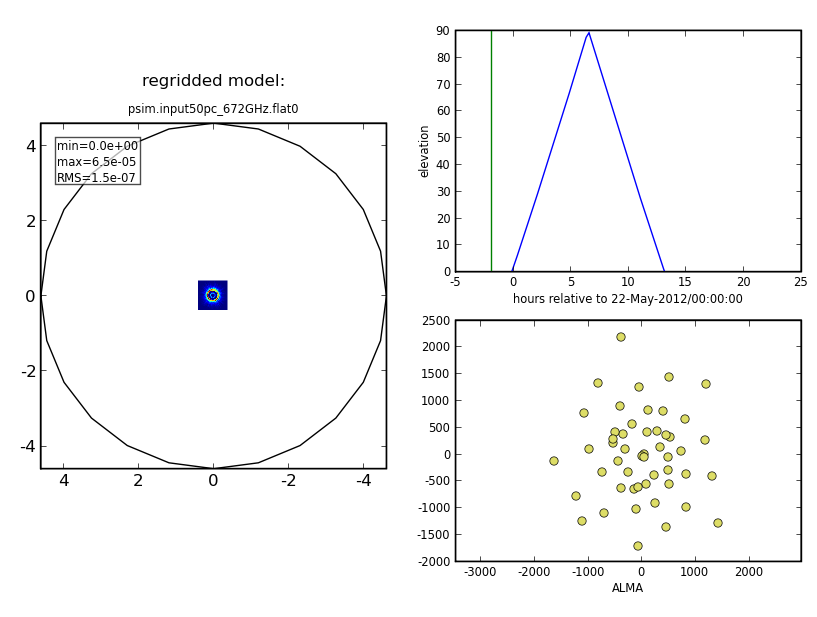
| 19:25, 18 May 2010 | Psim.output.png (file) |  |
316 KB | Rindebet | 1 | |
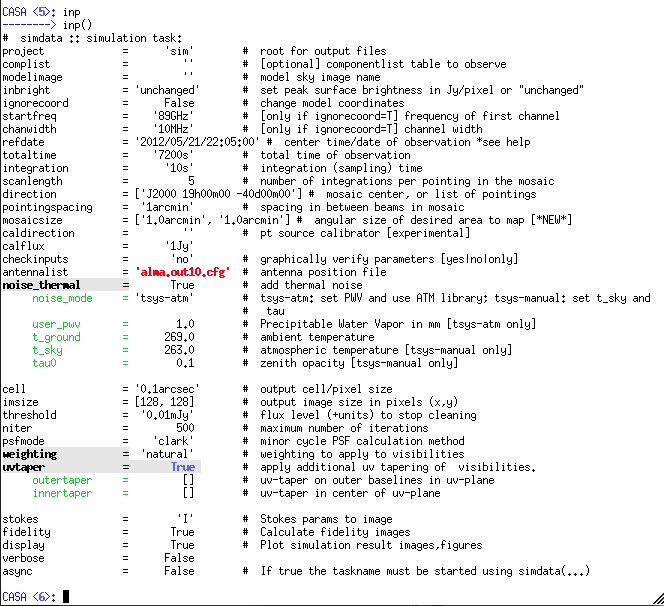
| 19:24, 18 May 2010 | Psim.input.png (file) |  |
59 KB | Rindebet | 1 | |
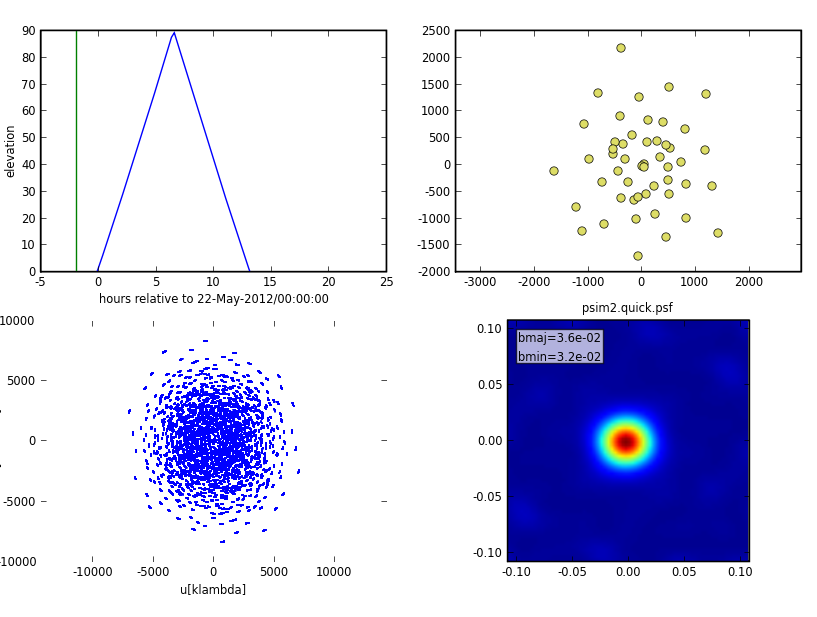
| 19:11, 18 May 2010 | Psim2.predict.png (file) |  |
71 KB | Rindebet | 1 | |
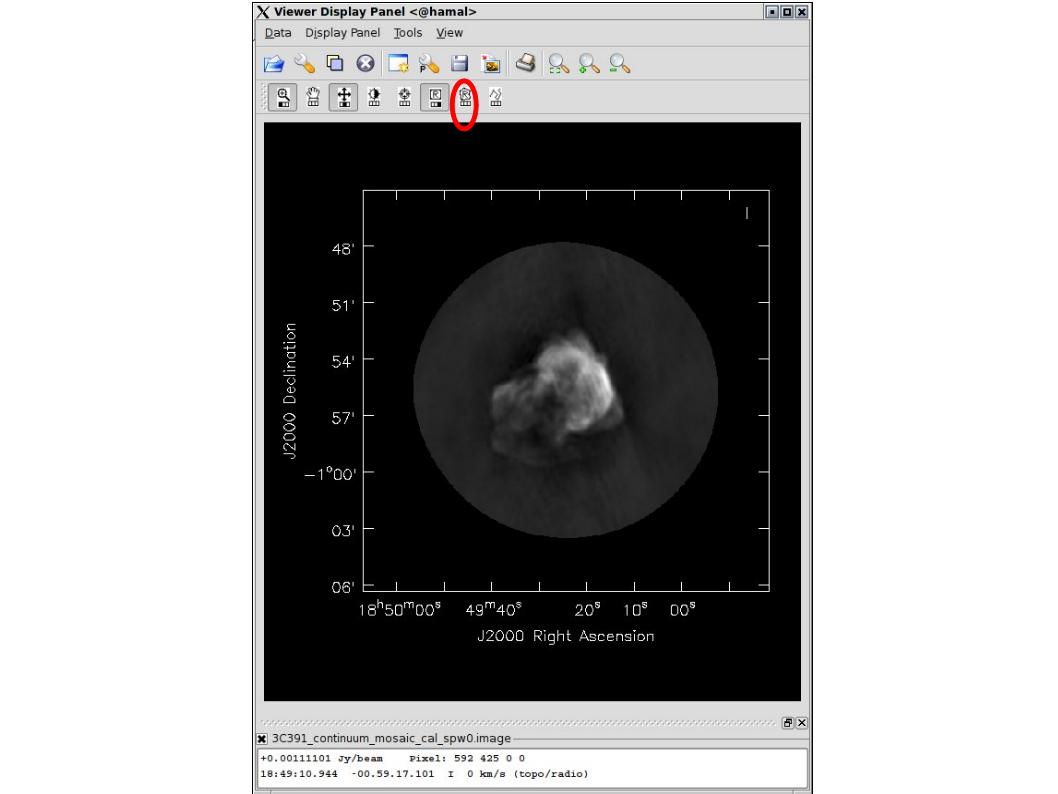
| 19:08, 18 May 2010 | 3C391 viewer.jpg (file) |  |
42 KB | Jlazio | illustration of 'polygon region' icon to be assigned to desired mouse button | 3 |
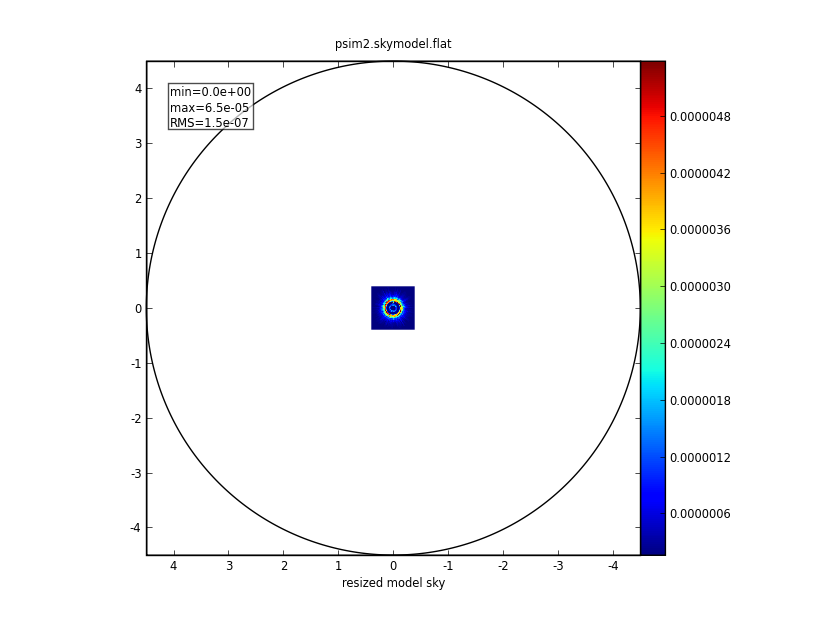
| 19:08, 18 May 2010 | Psim2.skymodel.png (file) |  |
48 KB | Rindebet | 1 | |
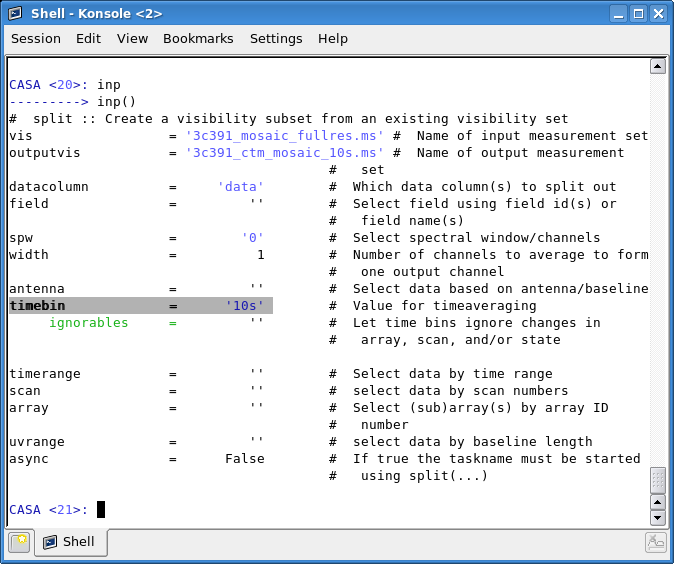
| 00:53, 18 May 2010 | 3C391 precal split parameters.png (file) |  |
69 KB | Jmiller | Input parameters for running split immediately after importevla, to time-average the dataset to 10s prior to performing the external gain calibration. | 1 |
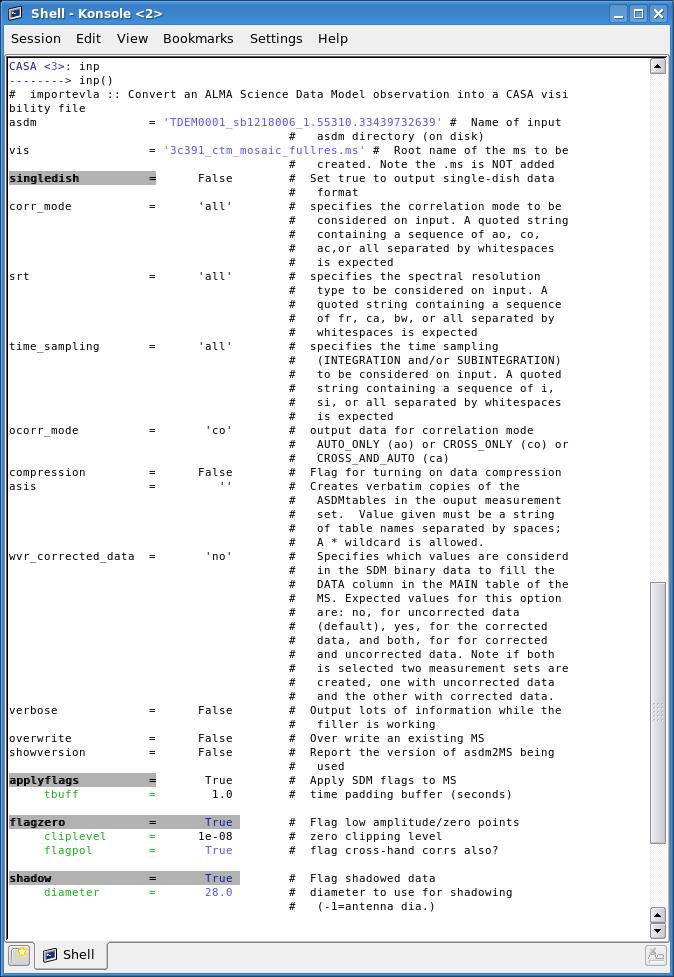
| 23:40, 17 May 2010 | 3c391 ctm importevla parameters.jpg (file) |  |
122 KB | Jmiller | Inputs to importevla for loading the continuum mosaic of 3C391 | 1 |
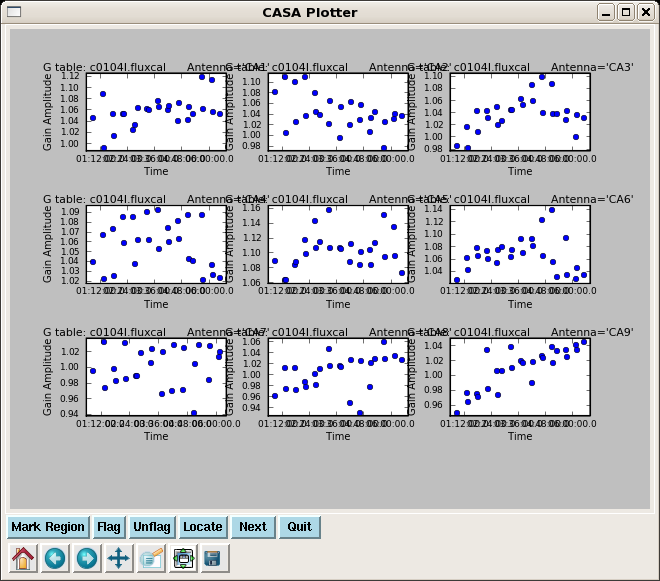
| 14:35, 14 May 2010 | M99plotcalwide7a.png (file) |  |
46 KB | Mthornle | 1 | |
| 14:34, 14 May 2010 | M99plotcalwide5a.png (file) |  |
43 KB | Mthornle | 1 | |
| 13:25, 14 May 2010 | M99plotcalflux2.png (file) |  |
53 KB | Mthornle | 1 | |
| 13:24, 14 May 2010 | M99plotcalflux.png (file) |  |
53 KB | Mthornle | Reverted to version as of 13:21, 14 May 2010 | 8 |
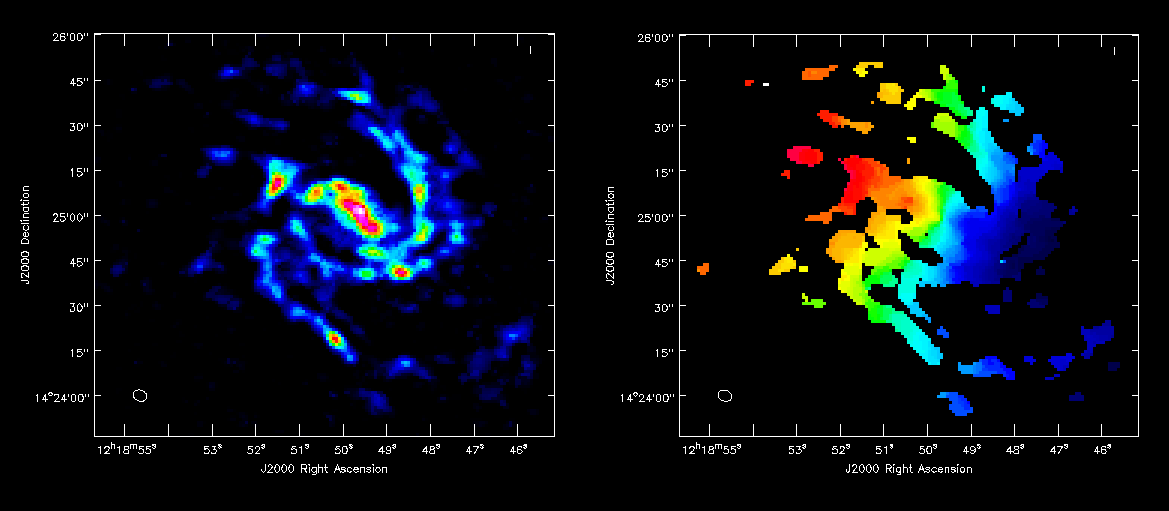
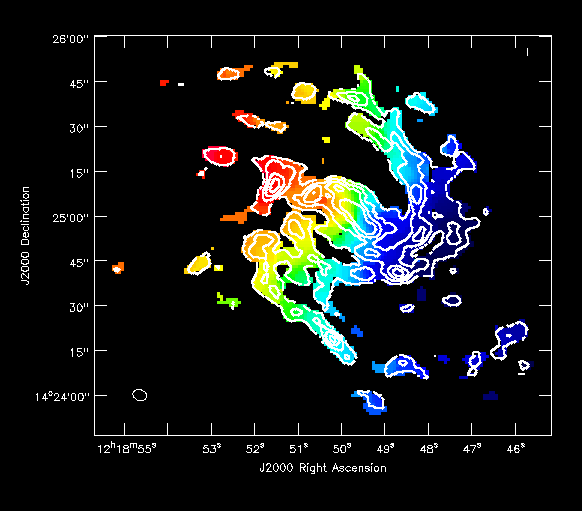
| 23:44, 13 May 2010 | Moment maps 2.png (file) |  |
31 KB | Cbrogan | 1 | |
| 23:37, 13 May 2010 | Moment maps.png (file) |  |
25 KB | Cbrogan | 1 | |
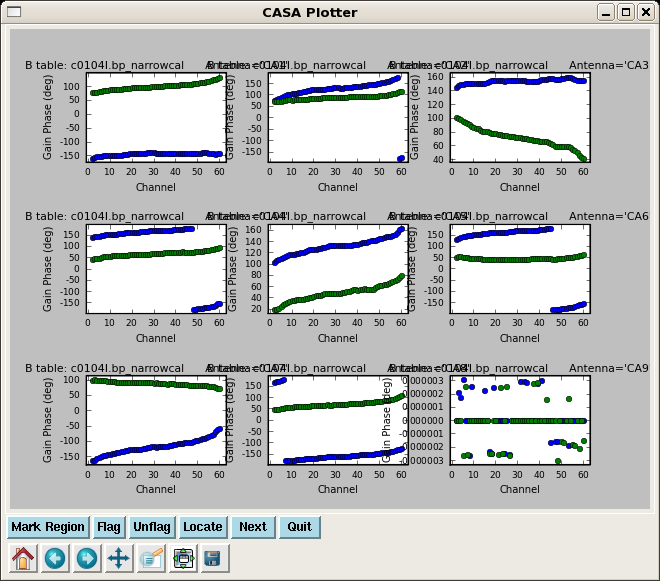
| 19:40, 13 May 2010 | M99plotcalnarrow2.png (file) |  |
62 KB | Mthornle | 1 | |
| 19:40, 13 May 2010 | M99plotcalnarrow1.png (file) |  |
71 KB | Mthornle | 1 | |
| 19:36, 13 May 2010 | M99plotcalwide7.png (file) |  |
46 KB | Mthornle | 1 | |
| 19:35, 13 May 2010 | M99plotcalwide6.png (file) |  |
45 KB | Mthornle | 1 | |
| 19:35, 13 May 2010 | M99plotcalwide5.png (file) |  |
43 KB | Mthornle | 1 | |
| 19:34, 13 May 2010 | M99plotcalwide4.png (file) |  |
60 KB | Mthornle | 1 | |
| 19:17, 13 May 2010 | M99plotcalwide2.png (file) |  |
38 KB | Mthornle | 1 | |
| 19:16, 13 May 2010 | M99plotcalwide1.png (file) |  |
45 KB | Mthornle | 1 | |
| 17:59, 12 May 2010 | Viewer wrench.png (file) |  |
38 KB | Cbrogan | 2 | |
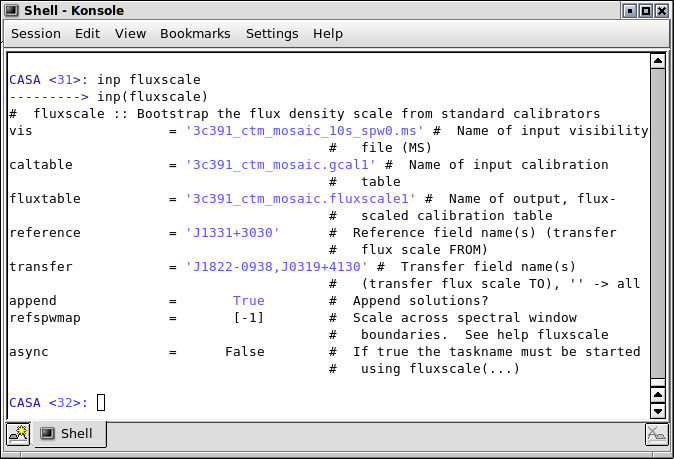
| 23:38, 10 May 2010 | 3C391 fluxscale.png (file) |  |
52 KB | Jlazio | fluxscale inputs, 3C 391 tutorial example | 1 |
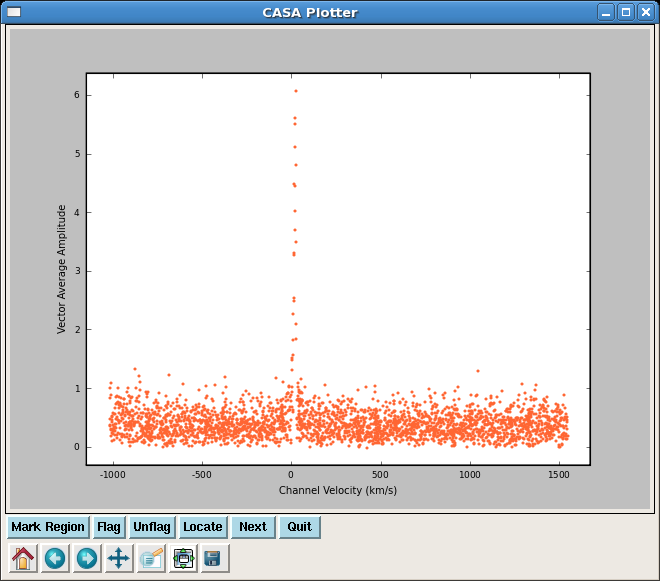
| 19:00, 10 May 2010 | Plotxy-amp vs vel.png (file) |  |
38 KB | Rfriesen | 1 | |
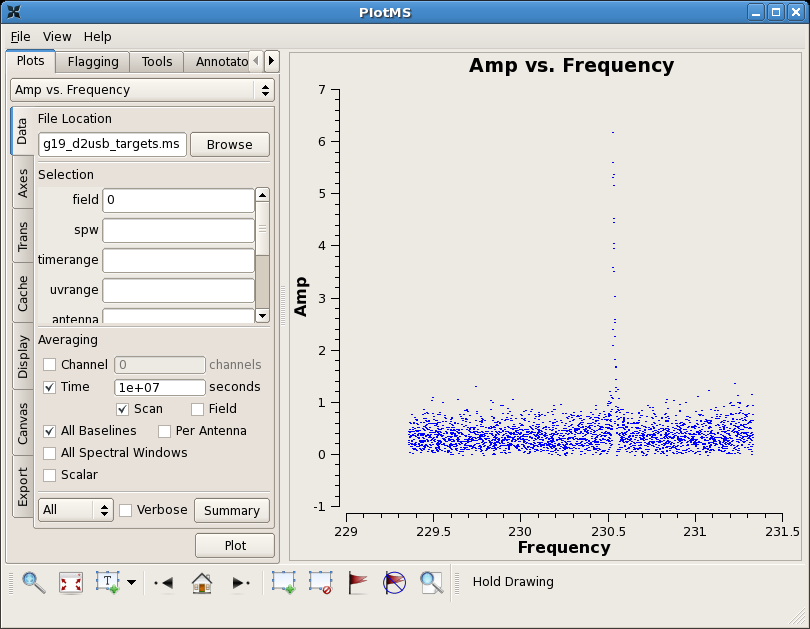
| 18:59, 10 May 2010 | Plotms-amp vs freq.png (file) |  |
62 KB | Rfriesen | 1 | |
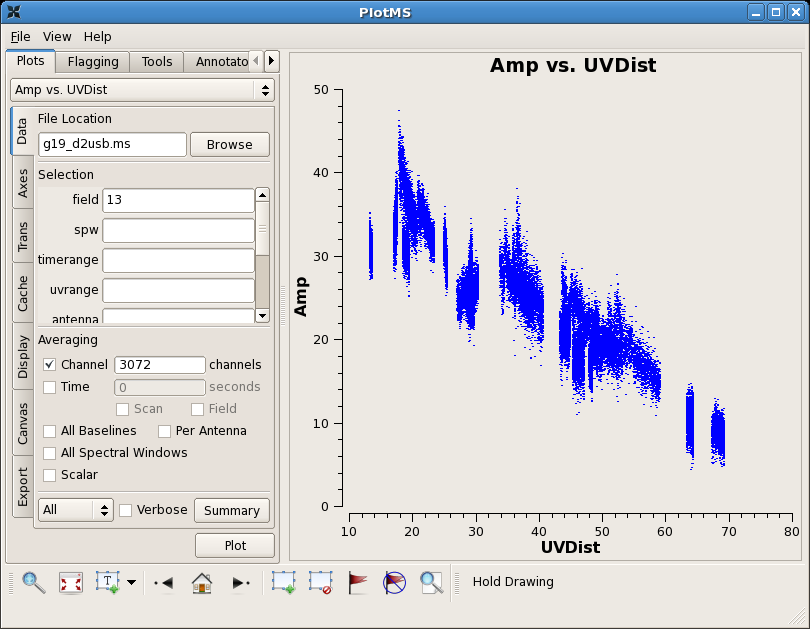
| 18:47, 10 May 2010 | Plotms-amp vs uvdist-uranus.png (file) |  |
62 KB | Rfriesen | 1 | |
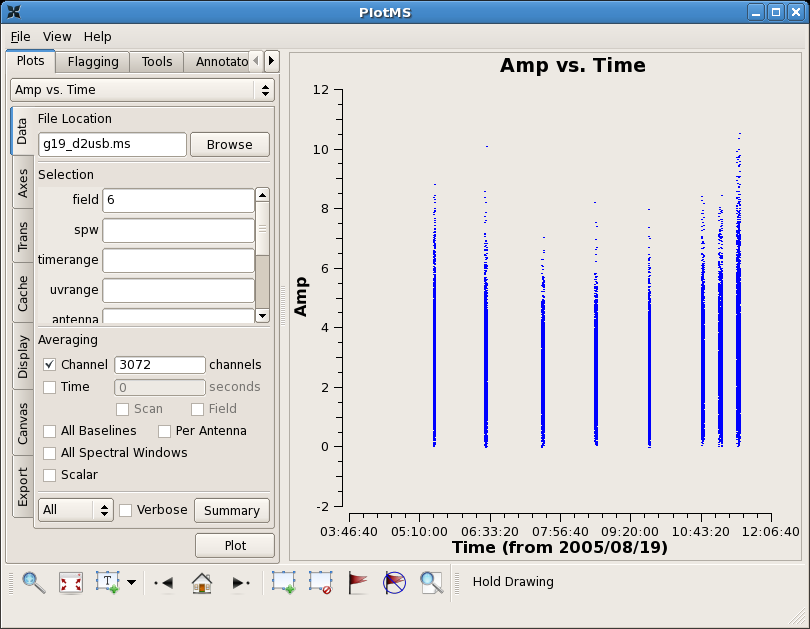
| 18:46, 10 May 2010 | Plotms-amp vs time-4.png (file) |  |
59 KB | Rfriesen | 1 | |
| 18:46, 10 May 2010 | Plotms-amp vs time-3.png (file) |  |
60 KB | Rfriesen | 1 | |
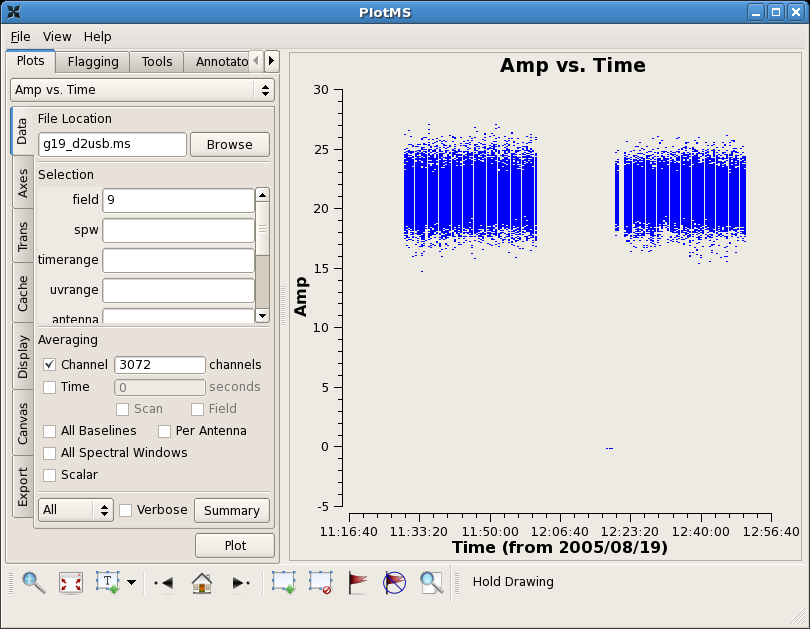
| 18:45, 10 May 2010 | Plotms-amp vs time-2.png (file) |  |
61 KB | Rfriesen | 1 | |
| 18:44, 10 May 2010 | Plotcal-pha vs time-3.png (file) |  |
60 KB | Rfriesen | 1 | |
| 18:42, 10 May 2010 | Plotxy-pha vs time-corr1.png (file) |  |
48 KB | Rfriesen | 1 | |
| 18:42, 10 May 2010 | Plotxy-amp vs time.png (file) |  |
49 KB | Rfriesen | 2 | |
| 18:40, 10 May 2010 | Plotxy-amp vs chan-3.png (file) |  |
66 KB | Rfriesen | 1 | |
| 18:10, 10 May 2010 | Plotxy-amp vs chan-2.png (file) |  |
89 KB | Rfriesen | 1 | |
| 18:05, 10 May 2010 | Plotcal-amp vs time-2.png (file) |  |
55 KB | Rfriesen | 1 | |
| 18:05, 10 May 2010 | Plotcal-pha vs time-2.png (file) |  |
76 KB | Rfriesen | 1 | |
| 18:04, 10 May 2010 | Plotcal-amp vs freq.png (file) |  |
96 KB | Rfriesen | 1 | |
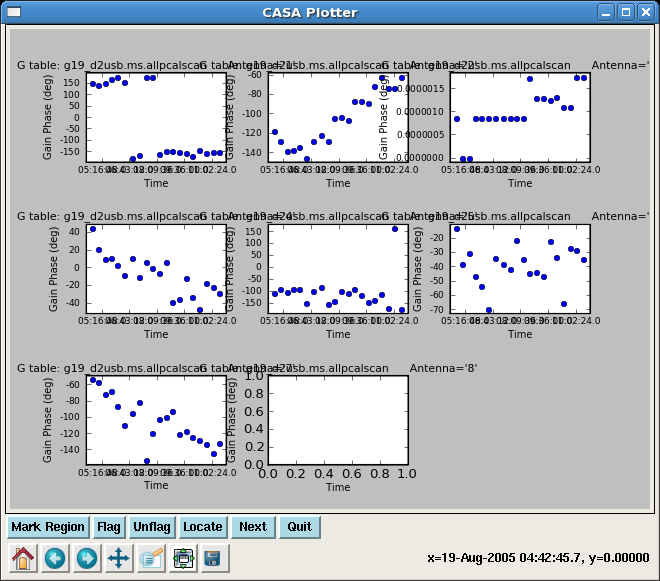
| 18:03, 10 May 2010 | Plotcal-pha vs time.png (file) |  |
75 KB | Rfriesen | 1 | |
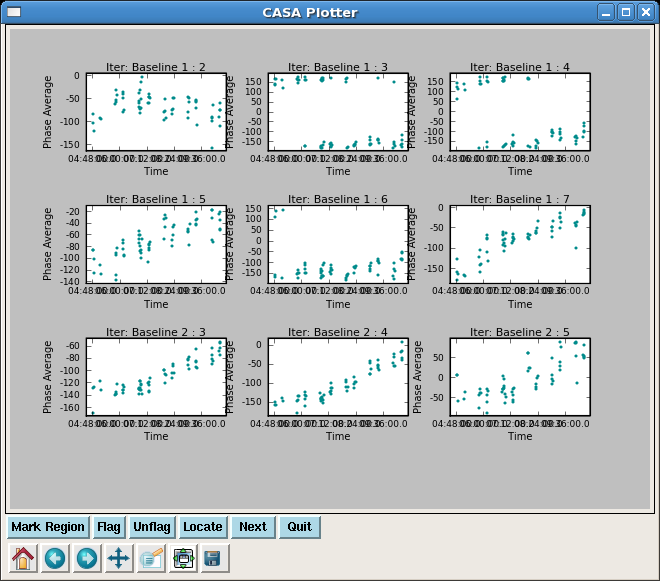
| 17:40, 10 May 2010 | Plotxy-pha vs time.png (file) |  |
50 KB | Rfriesen | 1 | |
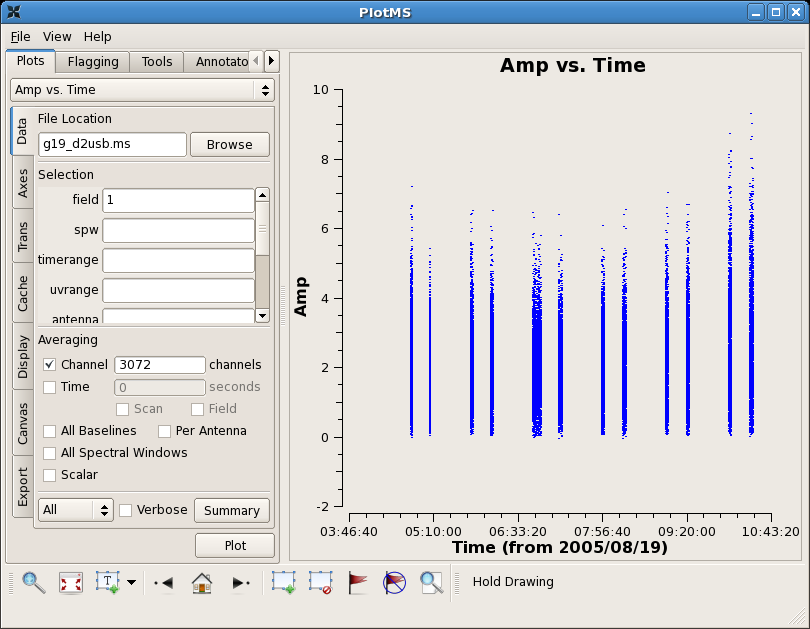
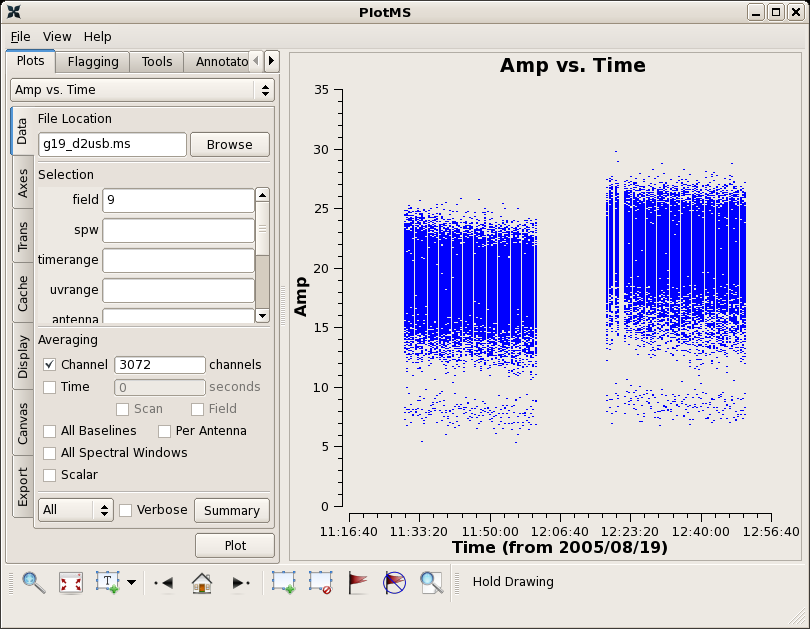
| 17:40, 10 May 2010 | Plotms-amp vs time.png (file) |  |
65 KB | Rfriesen | 1 | |
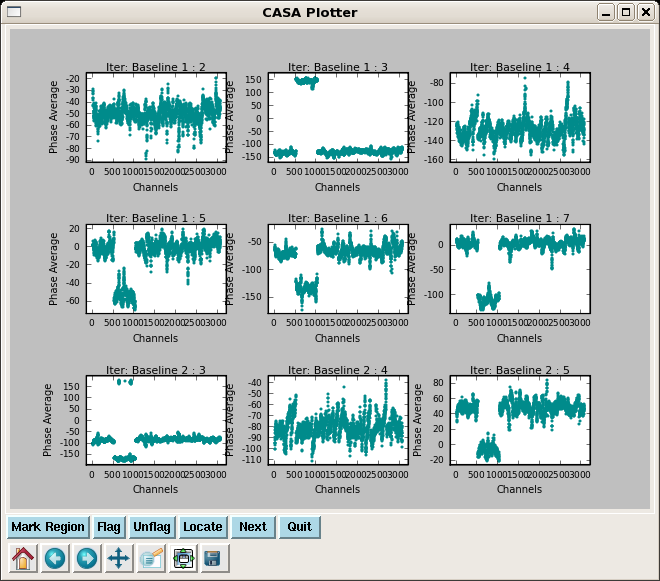
| 17:39, 10 May 2010 | Plotxy-pha vs chan.png (file) |  |
72 KB | Rfriesen | 1 | |
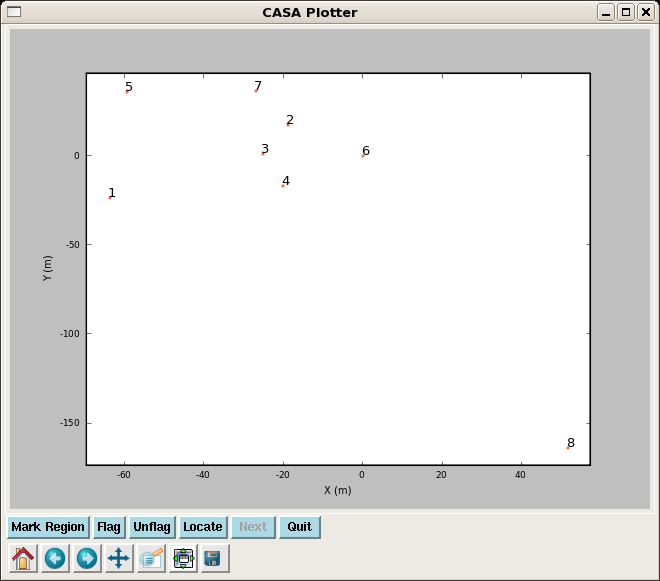
| 17:33, 10 May 2010 | Plotxy-ants.png (file) |  |
16 KB | Rfriesen | 1 |