Plotconfig: Difference between revisions
From CASA Guides
Jump to navigationJump to search
Created page with "'''Return to Analysis Utilities''' This page documents the '''plotconfig''' function of Python module analysisUtils. This function will make a plot o..." |
No edit summary |
||
| Line 5: | Line 5: | ||
This function will make a plot of pad locations for any telescope configuration known to CASA. See also [[obslist]]. | This function will make a plot of pad locations for any telescope configuration known to CASA. See also [[obslist]]. | ||
== | ==Examples== | ||
List the available telescopes and configurations. | List the available telescopes and configurations. | ||
| Line 36: | Line 36: | ||
</pre></code> | </pre></code> | ||
[[File:ALMA.cycle0.compact.png]] | |||
Revision as of 20:33, 16 December 2011
Return to Analysis Utilities
This page documents the plotconfig function of Python module analysisUtils.
This function will make a plot of pad locations for any telescope configuration known to CASA. See also obslist.
Examples
List the available telescopes and configurations.
# In CASA
au.plotconfig()
Telescope and configuration available to plot:
aca: i, ns, tp
alma: cycle0.compact, cycle0.extended, 1..28
carma: a, b, c, d, e
meerkat
pdbi: a, b, c, d
sma: subcompact, compact, compact.n, extended, vextended
vla: a, bna, b, cnb, c, dnc, d
WSRT
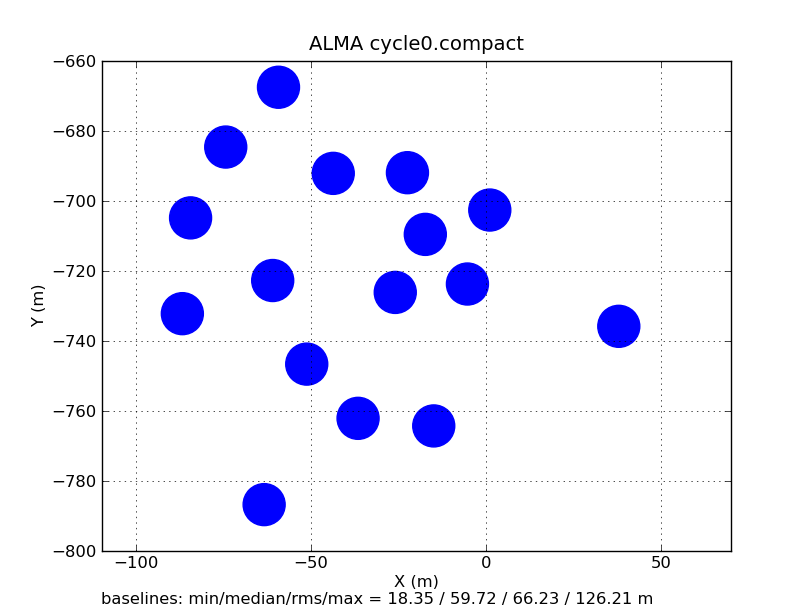
Plot the antenna pad locations for the ALMA Cycle 0 compact configuration.
# In CASA
au.plotconfig('alma','cycle0.compact',figfile=True)
Read 16 pads
Wrote file = ALMA.cycle0.compact.png
