CASA EVLA Scripts: Difference between revisions
No edit summary |
|||
| Line 66: | Line 66: | ||
"buildmosaic" allows users to specify a hexagonally packed mosaic and then outputs this mosaic as a text file in one of three formats: EVLA proposal submission tool, simdata pointing file, or ds9 region file. "buildmosaic" is a python routine. To use it, make sure that "buildmosaic.py", "axisutils.py", "constutils.py", and "geoutils.py" all sit in your casapy path (the easiest way to do this is to just drop them into your working directory). Then type | "buildmosaic" allows users to specify a hexagonally packed mosaic and then outputs this mosaic as a text file in one of three formats: EVLA proposal submission tool, simdata pointing file, or ds9 region file. "buildmosaic" is a python routine. To use it, make sure that "buildmosaic.py", "axisutils.py", "constutils.py", and "geoutils.py" all sit in your casapy path (the easiest way to do this is to just drop them into your working directory). Then type | ||
<source lang="python"> | |||
# In CASA | |||
from buildmosaic import buildmosaic | |||
</source> | </source> | ||
then you can call "buildmosaic". Our test example was to build a large 2 GHz mosaic of M31 and the syntax we used to build this was something like this: | |||
<source lang="python"> | |||
# In CASA | |||
m31_dir = "00h42m44.3s +41d16m09s" | |||
buildmosaic(direction=m31_dir, | |||
format="evlapst", | |||
outfile="m31.pst", | |||
overwrite=True, | |||
freq=2.0e9, | |||
diam=25.0, | |||
posang=12.0, | |||
calcspacing=True, | |||
mask="mask_m31.im", | |||
sourceroot="M31FIELD_", | |||
groupname="M31MOSAIC") | |||
</source> | |||
the options here are: | |||
* | |||
* | |||
* | |||
uses functions from three | uses functions from three | ||
=== buildfluxmap === | === buildfluxmap === | ||
Revision as of 13:34, 13 October 2011
Overview
This is a collection of Python scripts to help process and analyze EVLA data. Although they are not officially supported, some authors may choose to provide contact information. A brief description on how to run each script is provided by the author. If you would like to contribute, and do not have access to the CASA Guides Wiki, you may email Miriam Krauss (mkrauss at nrao.edu).
Plotting the weather table, obtaining observation-specific opacity information

Download script: File:Script plotWX.py
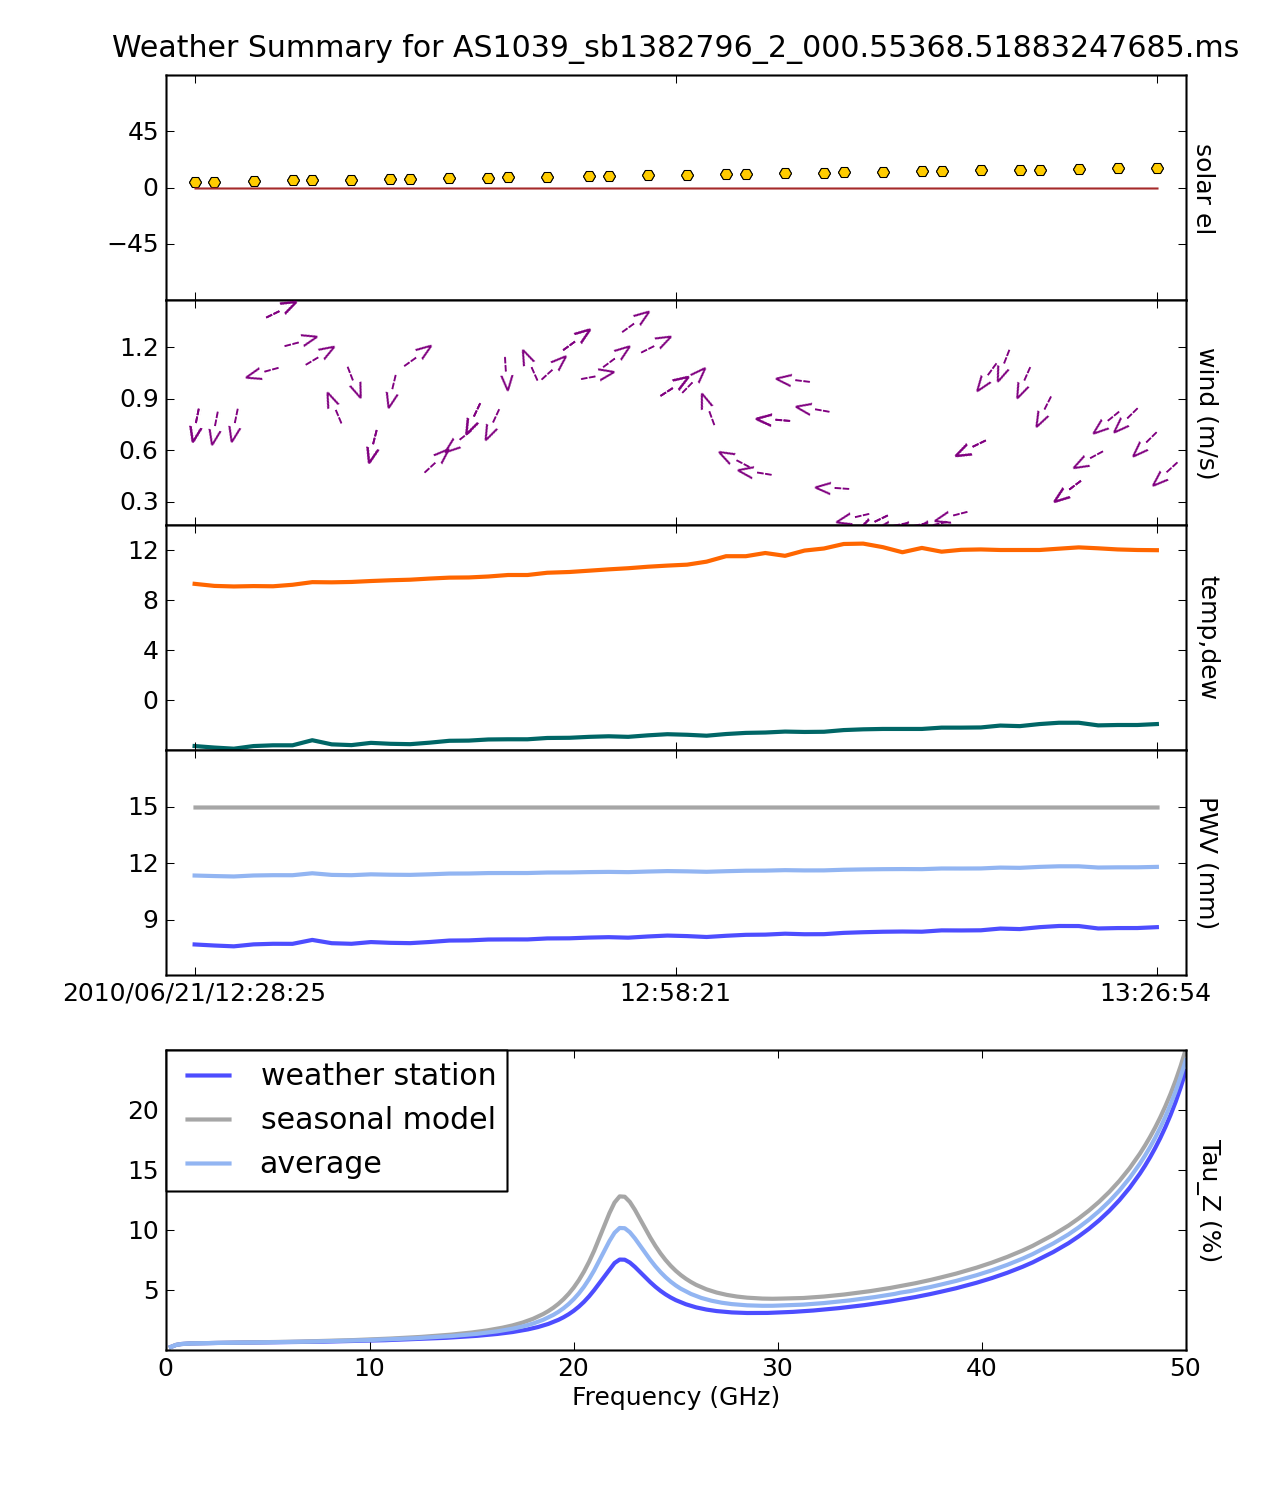
This script will plot weather information contained in the MS (see example below) as well as estimate the zenith opacity for each spectral window. This script is only intended for use with the EVLA-- it contains hardcoded site parameters and EVLA-specific models. Feel free to contact Josh Marvil (jmarvil + 'at' + nrao.edu) with questions or comments.
The plot will contain the following subfigures:
- The Sun's elevation, calculated from the date and time of the observation
- Wind speed and direction, as read from the weather table
- Temperature and Dewpoint, as read from the weather table
- Estimates of Precipitable Water Vapor (PWV), based upon:
- A Seasonal model based on VLA measurements between 1998-2005 (See VLA Test Memo #232)
- A calculation involving temperature and dewpoint (See VLA Scientific Memo #176)
- The average of the above two methods (currently accepted as the best predictor)
- Zenith optical depth from 1-50 GHz, calculated for each of the above three estimates of PWV, averaged over time. This calculation uses the atmospheric toolkit available within casa (see help(at) within CASA for more info)
This can be run from within CASA as a Script in the following way:
- place Script_plotWX.py in your working directory
- open Script_plotWX.py in a text editor
- find this line near the top of the script: myMS='MSname.ms'
- replace MSname.ms with the name of your measurement set, and save
- in CASA, execute the script:
# In CASA
execfile 'Script_plotWX.py'
Or, this script can be run within CASA as a function:
- place Script_plotWX.py in your working directory
- in CASA, import the function definition and call the function, replacing MSname.ms with the name of your measurement set:
# In CASA
from Script_plotWX import plotWX
myTau = plotWX('MSname.ms')
Mosaicking Utilities
User beware: these are tested but not thoroughly vetted scripts provided without any guarantee.
- Download script: File:Buildmosaic.py
- Download script: File:Buildfluxmap.py
- Download supporting module: File:Axisutils.py
- Download supporting module: File:Constutils.py
- Download supporting module: File:Geoutils.py
These are two potentially useful scripts ("buildmosaic" and "buildfluxmap") to aid in mosaic planning. A full-fledged GUI mosaic tool is under development by EVLA staff and RSRO participants but in the meantime these may be useful. They have been used but not heavily tested - please email aleroy at nrao dot edu to suggest improvements or report bugs (or just to report use, if people actually use these then I'll happily wrap it up in the XML for a task and strnegthen the error-checking).
buildmosaic
"buildmosaic" allows users to specify a hexagonally packed mosaic and then outputs this mosaic as a text file in one of three formats: EVLA proposal submission tool, simdata pointing file, or ds9 region file. "buildmosaic" is a python routine. To use it, make sure that "buildmosaic.py", "axisutils.py", "constutils.py", and "geoutils.py" all sit in your casapy path (the easiest way to do this is to just drop them into your working directory). Then type
# In CASA
from buildmosaic import buildmosaic
then you can call "buildmosaic". Our test example was to build a large 2 GHz mosaic of M31 and the syntax we used to build this was something like this:
# In CASA
m31_dir = "00h42m44.3s +41d16m09s"
buildmosaic(direction=m31_dir,
               format="evlapst",
               outfile="m31.pst",
               overwrite=True,
               freq=2.0e9,
               diam=25.0,
               posang=12.0,
               calcspacing=True,
               mask="mask_m31.im",
               sourceroot="M31FIELD_",
               groupname="M31MOSAIC")
the options here are:
uses functions from three