Antennae Band7 - Imaging for CASA 3.3: Difference between revisions
| Line 121: | Line 121: | ||
</source> | </source> | ||
*fitspw='0:5~50,0:120~164': | *fitspw='0:5~50,0:120~164': Line-free channels | ||
*fitorder = 1: | *fitorder = 1: First-order polynomial | ||
*fitmode = 'subtract': | *fitmode = 'subtract': Subtract the continuum from all channels. Note that the result is stored in the CORRECTED_DATA column | ||
Next, we {{clean}} the CO(3-2) line emission. We obtain the dirty map first with {{clean}} and niter=0: | Next, we {{clean}} the CO(3-2) line emission. We obtain the dirty map first with {{clean}} and niter=0: | ||
| Line 177: | Line 177: | ||
</source> | </source> | ||
The threshold is ~ 1.5 the rms of the line-free channel for each dataset. | The threshold is ~ 1.5 the rms of the line-free channel for each dataset. We double the imsize of the southern mosaic to increase the dirty beam, as the emission is quite extended along the mosaic. Using interactive=T the viewer will open when it is ready to start an interactive clean. Step through to the channels to see how extended the emission is. Then either use "All Channels" to define the same clean mask for all channels, or select "This Channel" to select different masks for each channel. Once you have defined a polygon region, you need to double click inside it to save the mask region. You can use the "tape deck" to step through the channels again and check that the emission in all channels fits within the mask(s) you have created. Note that the mask we defined above does not include all emission -- you will have to change the mask interactively! | ||
Using interactive=T the viewer will open when it is ready to start an interactive clean. Step through to the channels to see how extended the emission is. Then either use "All Channels" to define the same clean mask for all channels, or select "This Channel" to select different masks for each channel. Once you have defined a polygon region, you need to double click inside it to save the mask region. You can use the "tape deck" to step through the channels again and check that the emission in all channels fits within the mask(s) you have created. Note that the mask we defined above does not include all emission -- you will have to change the mask interactively! | |||
To continue with clean use the "Next action" buttons in the green area on the Viewer Display GUI: The red X will stop clean where you are; the blue arrow will stop the interactive part of clean, but continue to clean non-interactively until reaching the stopping niter or threshold (whichever comes first); and the green arrow will clean until it reaches the "iterations" parameter on the left side of the green area. | To continue with clean use the "Next action" buttons in the green area on the Viewer Display GUI: The red X will stop clean where you are; the blue arrow will stop the interactive part of clean, but continue to clean non-interactively until reaching the stopping niter or threshold (whichever comes first); and the green arrow will clean until it reaches the "iterations" parameter on the left side of the green area. | ||
| Line 190: | Line 189: | ||
==== Moment maps ==== | ==== Moment maps ==== | ||
Next, we make the | Next, we make the integrated intensity maps and velocity fields of the CO(3-2) emission using the task {{immoments}}. Note that we choose to run the {{immoments}} separately for the total intensity map and the velocity field because we want to use different flux thresholds. | ||
<source lang="python"> | <source lang="python"> | ||
# In CASA | # In CASA | ||
#Mom0 Northern | |||
# | rm -rf Antennae_North.Line.Clean.Mom.image* | ||
immoments('Antennae_North.Line.Clean.image', axis="spec", moments=[0],outfile='Antennae_North.Line.Clean.Mom.image.integrated') | |||
immoments( | imview (raster={'file': 'Antennae_North.Line.Clean.Mom.image.integrated'},out='Antennae_North.Line.Clean.Mom.image.integrated.png') | ||
#Mom1 Northern | |||
immoments('Antennae_North.Line.Clean.image', axis="spec", moments=[1],outfile='Antennae_North.Line.Clean.Mom.Mask.image.weighted_coord',mask="Antennae_North.Line.Clean.image>3.5e-2") | |||
imview (raster={'file': 'Antennae_North.Line.Clean.Mom.Mask.image.weighted_coord','range': [1500,1750]},out='Antennae_North.Line.Clean.Mom.Mask.image.velfield.png') | |||
#Mom0 Southern | |||
rm -rf Antennae_South.Line.Clean.Mom.image* | |||
immoments('Antennae_South.Line.Clean.image', axis="spec", moments=[0],outfile='Antennae_South.Line.Clean.Mom.image.integrated') | |||
imview (raster={'file': 'Antennae_South.Line.Clean.Mom.image.integrated'},out='Antennae_South.Line.Clean.Mom.image.integrated.png') | |||
#Mom1 Southern | |||
immoments('Antennae_North.Line.Clean.image', axis="spec", moments=[1],outfile='Antennae_South.Line.Clean.Mom.Mask.image.weighted_coord',mask="Antennae_South.Line.Clean.image>2.5e-2") | |||
imview (raster={'file': 'Antennae_South.Line.Clean.Mom.Mask.image.weighted_coord','range': [1300,1900]},out='Antennae_South.Line.Clean.Mom.Mask.image.velfield.png') | |||
</source> | </source> | ||
[[File:Antennae_North.Line.Clean.Mom.image.integrated.png|200px|thumb|right|The CO(3-2) total intensity map (moment 0) of the northern mosaic]] | |||
[[File:Antennae_North.Line.Clean.Mom.Mask.image.velfield.png|200px|thumb|right|The CO(3-2) velocity field (moment 1) of the northern mosaic]] | |||
[[File:Antennae_South.Line.Clean.Mom.image.integrated.png|200px|thumb|right|The CO(3-2) total intensity map (moment 0) of the southern mosaic]] | |||
[[File:Antennae_South.Line.Clean.Mom.Mask.image.velfield.png|200px|thumb|right|The CO(3-2) velocity field (moment 1) of the southern mosaic]] | |||
*moments=[x]: To specify that we wish to make the xth moment map. The 0th moment map gives integrated emission and the 1st gives the intensity-weighted velocity field | |||
*axis='spectral': Indicates the moment axis; in this case, 'spectral' | |||
*mask="Antennae_North.Line.Clean.image>X" Mask applied to the image before calculating the moments. Consider pixels in Antennae_North.Line.Clean.image that are larger than X | |||
*outfile='result-ngc3256_CO1-0.mom0': The output image name | |||
[[User:Despada|Daniel Espada]] 12:00 UT, 14 July 2011 | [[User:Despada|Daniel Espada]] 12:00 UT, 14 July 2011 | ||
Revision as of 07:34, 20 July 2011
Overview
This section of the AntennaeBand7 CASA Guide cover the imaging of the continuum and spectral line data. It begins where the Antennae Band7 - Calibration section left off. If you completed the Calibration section of the guide, then you may want to continue with the calibrated data sets Antennae_South.ms and Antennae_North.ms. If you did not complete the Calibration section, then you can download the calibrated uv-data from the region closest to your location:
Once there, download the file 'Antennae_Band7_CalibratedData.tgz' to obtain the calibrated uvdata.
Once the download has finished, unpack the file:
# In a terminal outside CASA
tar -xvzf Antennae_Band7_CalibratedData.tgz

cd Antennae_Band7_CalibratedData

# Start CASA
casapy
After that, you should have Antennae_South.ms and Antennae_North.ms in your working directory.
Continuum map
We will make 345 GHz continuum images for the two regions covered by the mosaics. We use the task clean over the channels that are free of the line emission. The line-free channels are found by plotting the average spectrum. We find the CO(3-2) line from channels 50 to 100 in the southern mosaic, and from 70 to 100 in the northern mosaic.
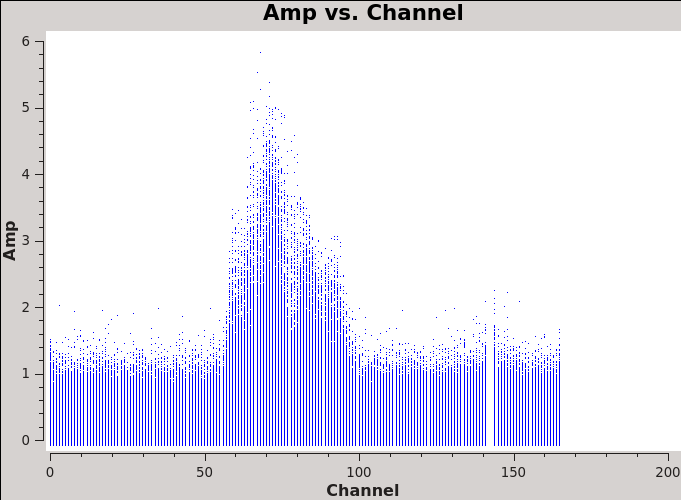
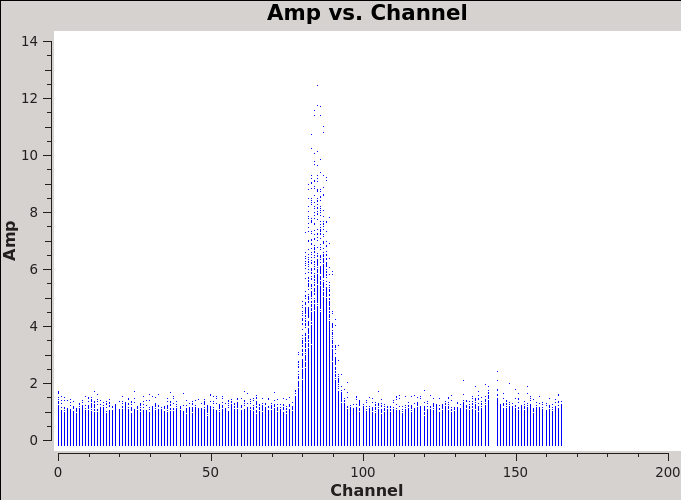
# In CASA
plotms(vis='Antennae_South.cal.ms',xaxis='channel',yaxis='amp',
      avgtime='1e8',avgscan=T)
plotms(vis='Antennae_North.cal.ms',xaxis='channel',yaxis='amp',
      avgtime='1e8',avgscan=T)
The avgtime is set to a large value so that it averages over all the integrations, and avgscan is set to allow averaging of the different scans.
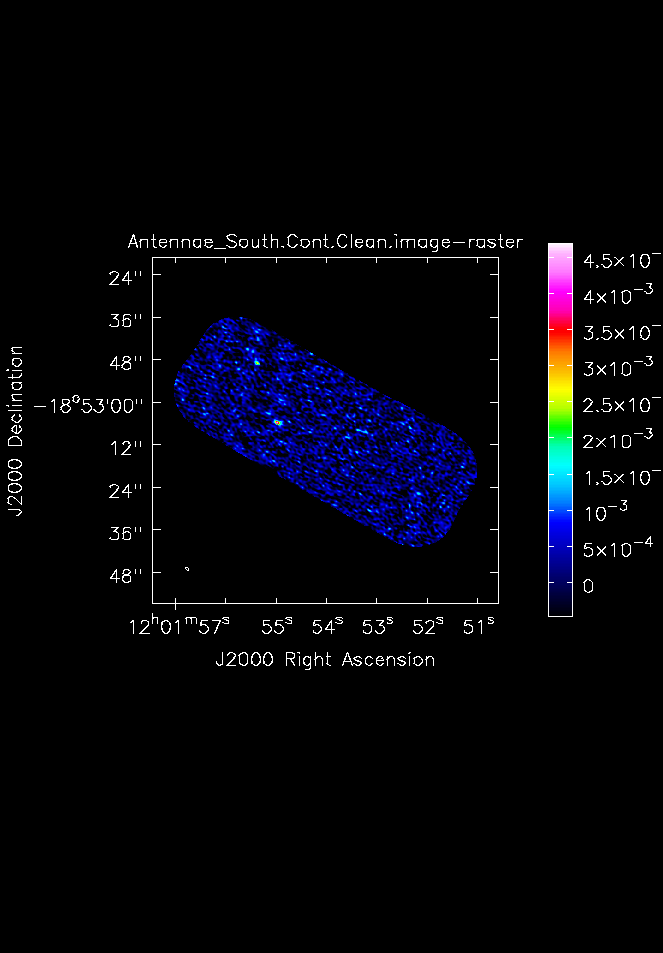
Next we create the continuum emission map. We use the default non-interactive mode and niter=0 as a first step to see if there is any continuum emission. The resolution in Band 7 for the extended configuration is approximately 1 arcsec. We therefore choose a cell size of 0.2 arcsec to oversample the beam sufficiently (at least three times). Note that we need to delete any previous clean output images before proceeding with the clean command, otherwise CASA will clean the data further instead of producing new output images.
For the northern mosaic:
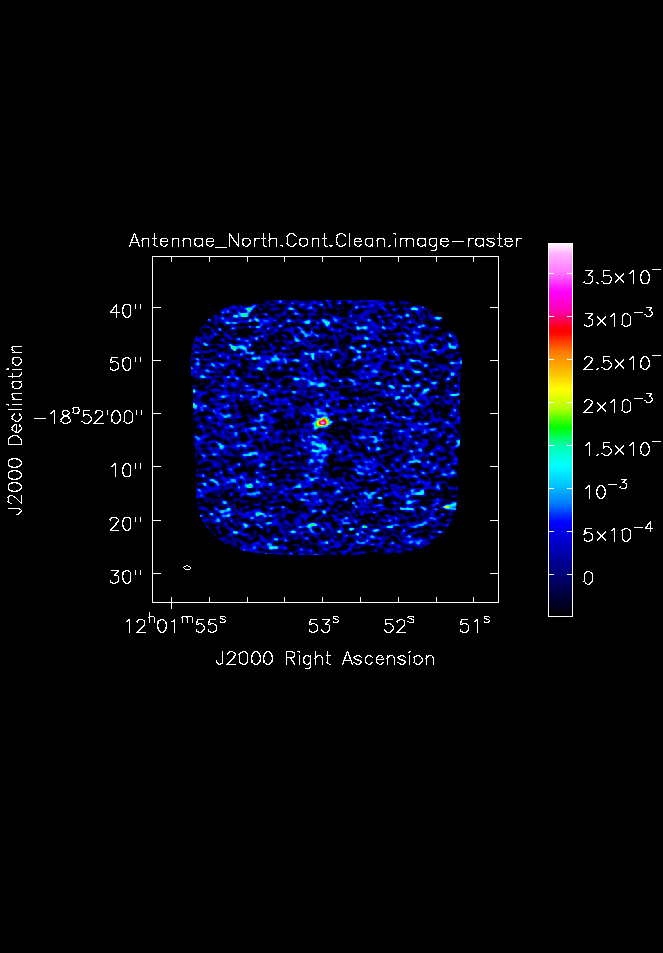
# In CASA
os.system('rm -rf Antennae_North.Cont.Clean*')

clean(vis='Antennae_North.cal.ms',imagename='Antennae_North.Cont.Clean',
     field='',phasecenter='12',
     mode='mfs',restfreq='345.79599GHz',
     spw='0:0~50,0:120~164',
     imagermode='mosaic',
     imsize=500,cell='0.2arcsec',
     interactive=F,
     niter=1000, threshold='0.5mJy')
The input parameters include:
- vis='Antennae_North.cal.ms': The calibrated dataset on the science target
- imagename='Antennae_North.Cont.Clean': The base name of the output images
- phasecenter='12': the source id of the mosaic.
- spw='0:0~50,0:120~164': To specify only the line-free channels
- mode='mfs': Multi-Frequency Synthesis: The default mode, which produces one image from all the specified data combined
- niter=1000: Maximum number of clean iterations
- theshold='0.5mJy': Stop cleaning if the maximum residual is below this value (~1.5 times the rms noise)
- imsize=500, cell='0.2arcsec': Image size in pixels, chosen to cover the mosaic, and the cell size per pixel in arcsec to properly sample the synthesized beam (at least three times).
For the southern mosaic we modify the phase center and the line-free channels:
# In CASA
os.system('rm -rf Antennae_South.Cont.Clean*')

clean(vis='Antennae_South.cal.ms',imagename='Antennae_South.Cont.Clean',
     field='',phasecenter='15',
     mode='mfs',restfreq='345.79599GHz',
     spw='0:0~30,0:120~164',
     imagermode='mosaic',
     imsize=500,cell='0.2arcsec',
     interactive=F,
     niter=1000, threshold='0.5mJy')
The Half Power Beam Width (HPBW) of the elliptical synthesized beam is:
- Northern mosaic: 1.28" times 0.66", with a position angle (PA) equal to 86 deg.
- Southern mosaic: 1.15" times 0.66", and PA equal to 68 deg.
We will determine some statistics for the images using the task imstat:
# In CASA
imstat('Antennae_North.Cont.Clean.image')
imstat('Antennae_South.Cont.Clean.image')
The peak flux densities of the images are ~4.4 and 2.9 mJy for the southern and northern mosaics, and both have a similar rms ~ 0.3 mJy, thus the obtained dynamic ranges are larger or equal than 10.
Line cubes of the galaxy
First, we subtract the continuum emission in the uv-domain using the task uvcontsub.
# In CASA

uvcontsub(vis = 'Antennae_North.cal.ms',
	  fitspw='0:5~50,0:120~164', solint ='inf',
	  fitorder = 1, fitmode = 'subtract')

uvcontsub(vis = 'Antennae_South.cal.ms',
	  fitspw='0:5~30,0:120~164', solint ='inf',
	  fitorder = 1, fitmode = 'subtract')
- fitspw='0:5~50,0:120~164': Line-free channels
- fitorder = 1: First-order polynomial
- fitmode = 'subtract': Subtract the continuum from all channels. Note that the result is stored in the CORRECTED_DATA column
Next, we clean the CO(3-2) line emission. We obtain the dirty map first with clean and niter=0:
# In CASA
os.system('rm -rf Antennae_North.Line,Antennae_South.Line*')
clean(vis='Antennae_North.cal.ms',imagename='Antennae_North.Line.Clean',
     spw='0',field='',phasecenter='12',
     mode='velocity',outframe='LSRK',restfreq='345.79599GHz',
     nchan=60,start='1300km/s',width='10km/s',
     imagermode='mosaic',
     imsize=500,cell='0.2arcsec',
     interactive=T,
     niter=0)

clean(vis='Antennae_South.cal.ms',imagename='Antennae_South.Line.Clean',
     spw='0',field='',phasecenter='15',
     mode='velocity',outframe='LSRK',restfreq='345.79599GHz',
     nchan=60,start='1300km/s',width='10km/s',
     imagermode='mosaic',
     imsize=500,cell='0.2arcsec',
     interactive=T,
     niter=0)
Notable parameters include:
- mode='velocity',outframe='LSRK',restfreq='345.79599GHz',nchan=60,start='1300km/s',width='10km/s': To produce a data cube specified by the number of channels("nchan"=60), and "start" and "width" local standard of rest velocities (starting at 1300 km/s and with velocity widths of 10 km/s). The rest frequency of the CO line is used.
- start='', nchan=31, width='': To include all 31 channels specified by spw, with no channel averaging
- niter=0: Maximum number of clean iterations.
The (line-free) channel rms for the northern and southern mosaics are 2.7 mJy/beam and 2.4 mJy/beam, respectively, for 2.3 and 3.8 hours times on source approximately. The ALMA sensitivity calculator gives an on-source observing time of ~3-4 hours to reach a noise level of 2.5 mJy using 12 antennas for an angular resolution of 1. Note that the fields are overlapping by 0.5 the size of the primary beam.
We modify the following keywords to clean the mosaics:
# In CASA
minpb=0.2
interactive=T: To do interactive cleaning with the viewer GUI

#For the Northern mosaic
threshold='4.0mJy'

#For the Southern mosaic
threshold='3.5mJy',
imsize=1000

*minpb=0.2
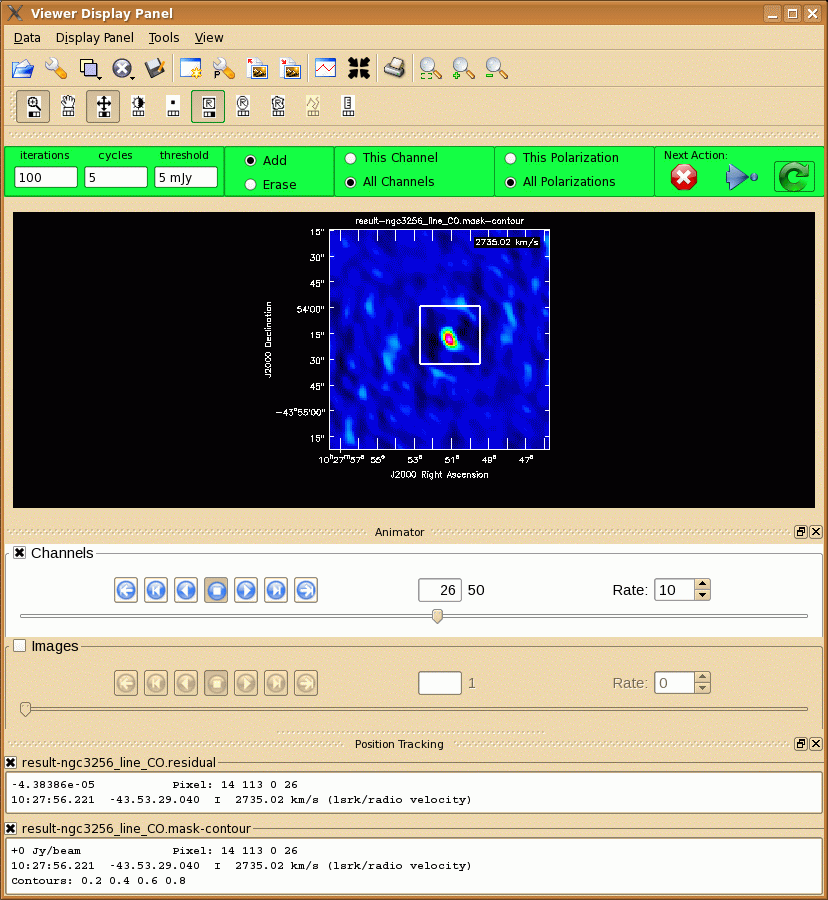
*interactive=T: To do interactive cleaning with the viewer GUI (read more about this below)
*threshold='5 mJy': Stop cleaning if the maximum residual is below this value.
The threshold is ~ 1.5 the rms of the line-free channel for each dataset. We double the imsize of the southern mosaic to increase the dirty beam, as the emission is quite extended along the mosaic. Using interactive=T the viewer will open when it is ready to start an interactive clean. Step through to the channels to see how extended the emission is. Then either use "All Channels" to define the same clean mask for all channels, or select "This Channel" to select different masks for each channel. Once you have defined a polygon region, you need to double click inside it to save the mask region. You can use the "tape deck" to step through the channels again and check that the emission in all channels fits within the mask(s) you have created. Note that the mask we defined above does not include all emission -- you will have to change the mask interactively! To continue with clean use the "Next action" buttons in the green area on the Viewer Display GUI: The red X will stop clean where you are; the blue arrow will stop the interactive part of clean, but continue to clean non-interactively until reaching the stopping niter or threshold (whichever comes first); and the green arrow will clean until it reaches the "iterations" parameter on the left side of the green area.
When the cleaning has finished, you may want to inspect the resulting data cube
imview (raster={'file': 'Antennae_North.Line.Clean.image'})
imview (raster={'file': 'Antennae_South.Line.Clean.image'})
Moment maps
Next, we make the integrated intensity maps and velocity fields of the CO(3-2) emission using the task immoments. Note that we choose to run the immoments separately for the total intensity map and the velocity field because we want to use different flux thresholds.
# In CASA

#Mom0 Northern
rm -rf Antennae_North.Line.Clean.Mom.image*
immoments('Antennae_North.Line.Clean.image', axis="spec", moments=[0],outfile='Antennae_North.Line.Clean.Mom.image.integrated')
imview (raster={'file': 'Antennae_North.Line.Clean.Mom.image.integrated'},out='Antennae_North.Line.Clean.Mom.image.integrated.png')

#Mom1 Northern
immoments('Antennae_North.Line.Clean.image', axis="spec", moments=[1],outfile='Antennae_North.Line.Clean.Mom.Mask.image.weighted_coord',mask="Antennae_North.Line.Clean.image>3.5e-2")
imview (raster={'file': 'Antennae_North.Line.Clean.Mom.Mask.image.weighted_coord','range': [1500,1750]},out='Antennae_North.Line.Clean.Mom.Mask.image.velfield.png')

#Mom0 Southern
rm -rf Antennae_South.Line.Clean.Mom.image*
immoments('Antennae_South.Line.Clean.image', axis="spec", moments=[0],outfile='Antennae_South.Line.Clean.Mom.image.integrated')
imview (raster={'file': 'Antennae_South.Line.Clean.Mom.image.integrated'},out='Antennae_South.Line.Clean.Mom.image.integrated.png')

#Mom1 Southern
immoments('Antennae_North.Line.Clean.image', axis="spec", moments=[1],outfile='Antennae_South.Line.Clean.Mom.Mask.image.weighted_coord',mask="Antennae_South.Line.Clean.image>2.5e-2")
imview (raster={'file': 'Antennae_South.Line.Clean.Mom.Mask.image.weighted_coord','range': [1300,1900]},out='Antennae_South.Line.Clean.Mom.Mask.image.velfield.png')
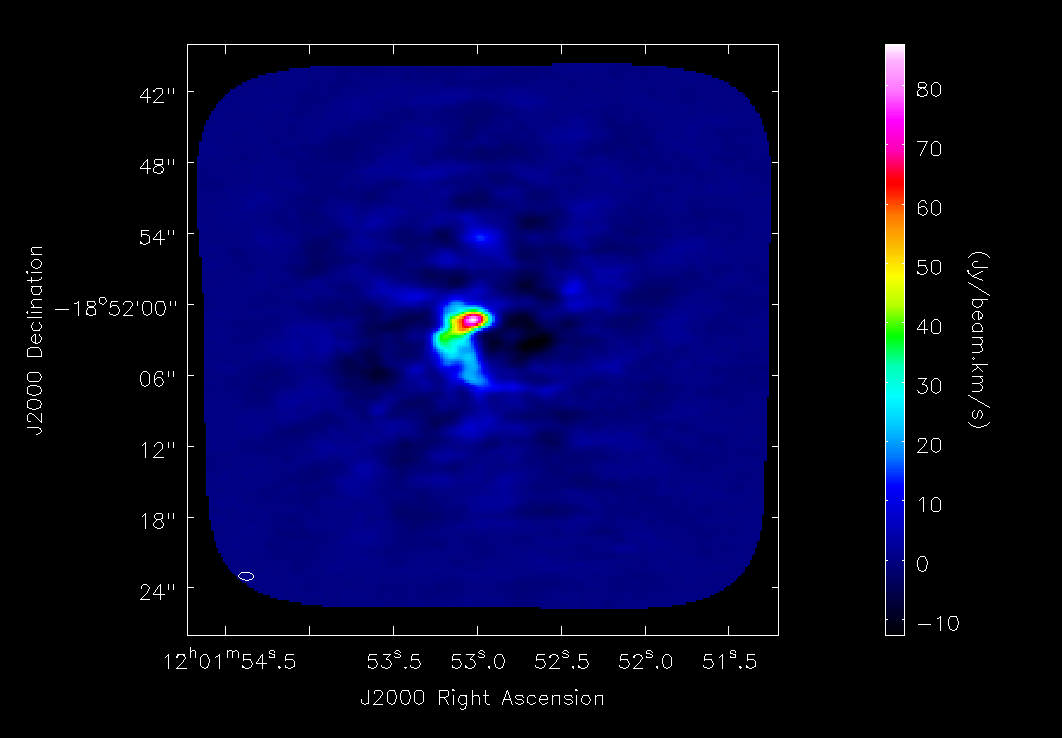
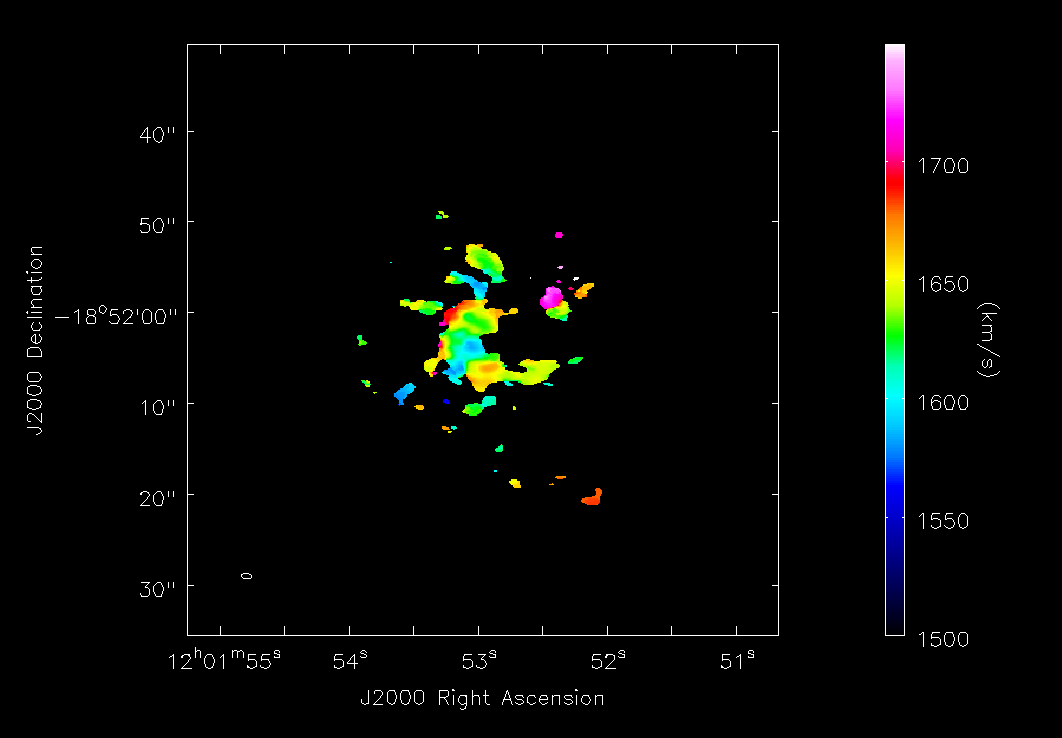
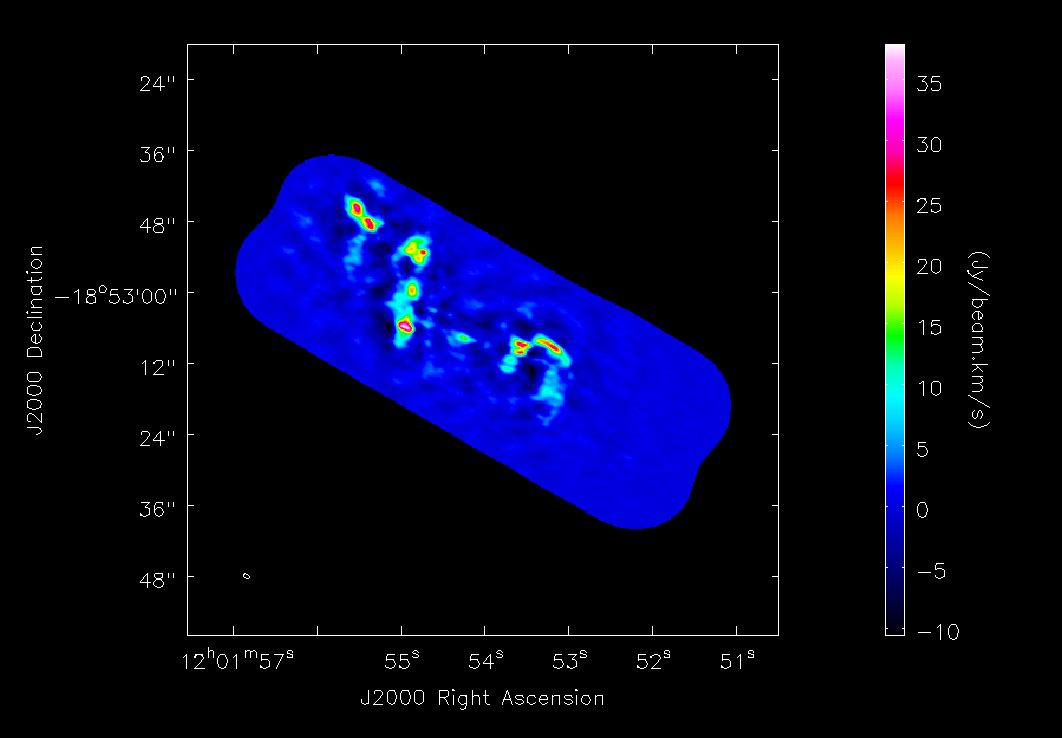
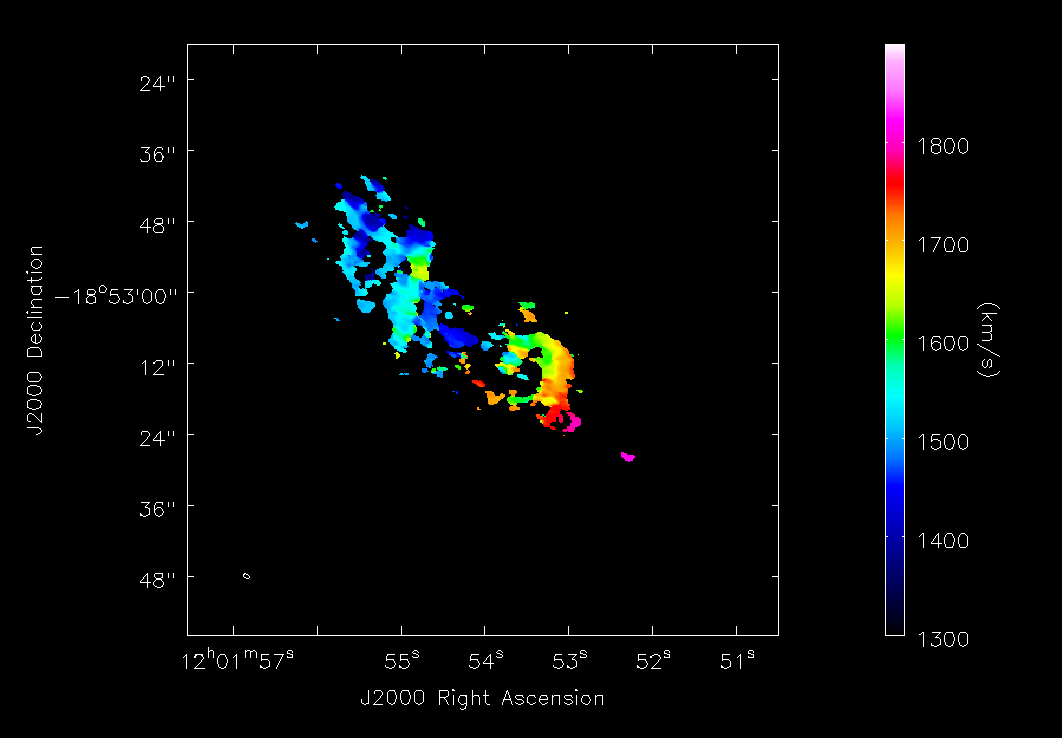
- moments=[x]: To specify that we wish to make the xth moment map. The 0th moment map gives integrated emission and the 1st gives the intensity-weighted velocity field
- axis='spectral': Indicates the moment axis; in this case, 'spectral'
- mask="Antennae_North.Line.Clean.image>X" Mask applied to the image before calculating the moments. Consider pixels in Antennae_North.Line.Clean.image that are larger than X
- outfile='result-ngc3256_CO1-0.mom0': The output image name
Daniel Espada 12:00 UT, 14 July 2011