Data flagging with viewer: Difference between revisions
No edit summary |
No edit summary |
||
| Line 1: | Line 1: | ||
[[VLA Tutorials | ↵ '''VLA Tutorials''']] | [[VLA Tutorials | ↵ '''VLA Tutorials''']]<br> | ||
[[Main Page | ↵ '''CASA Guides''']] | [[Main Page | ↵ '''CASA Guides''']] | ||
| Line 181: | Line 181: | ||
</div> | </div> | ||
[[VLA Tutorials | ↵ '''VLA Tutorials''']]<br> | |||
[[Main Page | ↵ '''CASA Guides''']] | |||
--[[User:Jgallimo|Jack Gallimore]] 19:14, 23 November 2009 (UTC) | --[[User:Jgallimo|Jack Gallimore]] 19:14, 23 November 2009 (UTC) | ||
Revision as of 14:48, 3 December 2009
Overview
Your data will inevitably have some bad data. Perhaps a receiver on a given antenna is acting up, or perhaps the pointing on a given antenna is poor, and these problematic data will (hopefully) appear obviously in your measurement set. It's a good idea to inspect your data carefully before calibration and imaging, and CASA offers several tools to flag bad data interactively.
This tutorial illustrates how to use viewer to flag poor quality data. It will use the continuum dataset AU079 from the VLA archive; this dataset is also used in the Imaging Flanking Fields and Data flagging with casaplotms tutorials.
Loading the Measurement Set into Viewer
As described in the Imaging Flanking Fields tutorial, the data may be loaded into CASA using the importvla command. The following commands import the data into the measurement set au079.ms and send them to the viewer.
# from loaddata.py
from glob import glob

# Define the list of files for reading. Use glob to perform wildcard matching with VLA archive filenames.
fileList = glob('AU079_*.xp?')

importvla(archivefiles=fileList,vis='au079.ms')
viewer('au079.ms') # load the data into the viewer for editing
The viewer command can also be invoked without argument, in which case a file selector GUI will appear.
Setting Up for Antenna-based Flagging
|
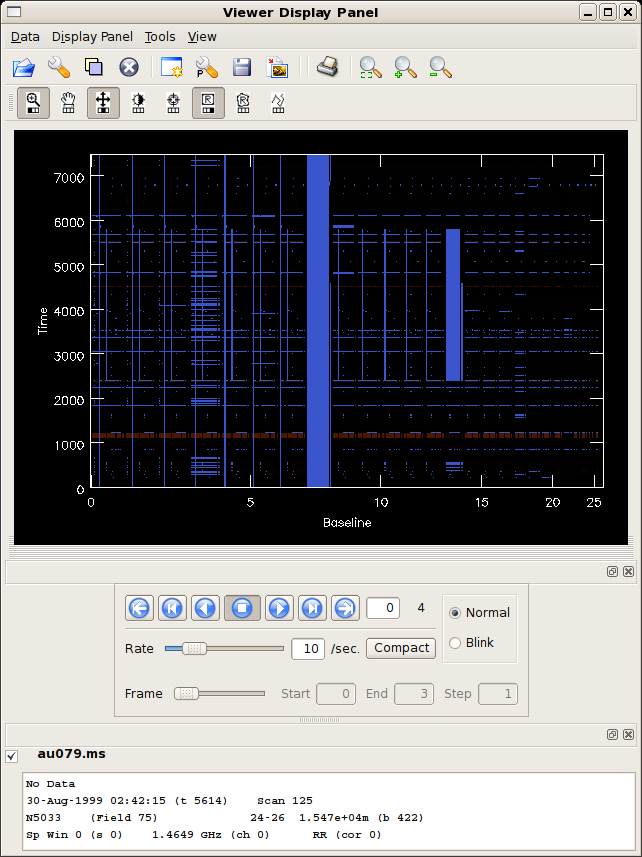
The figure at right shows the default viewer display for a measurement set. The axes are (y) time and (x) baseline, or antenna pair, enumerated by the common antenna number of the pair. Flagged data are highlighted in pale blue. Another window, titled Data Display Options, will also appear, allowing you to alter the display and flagging options. |
|
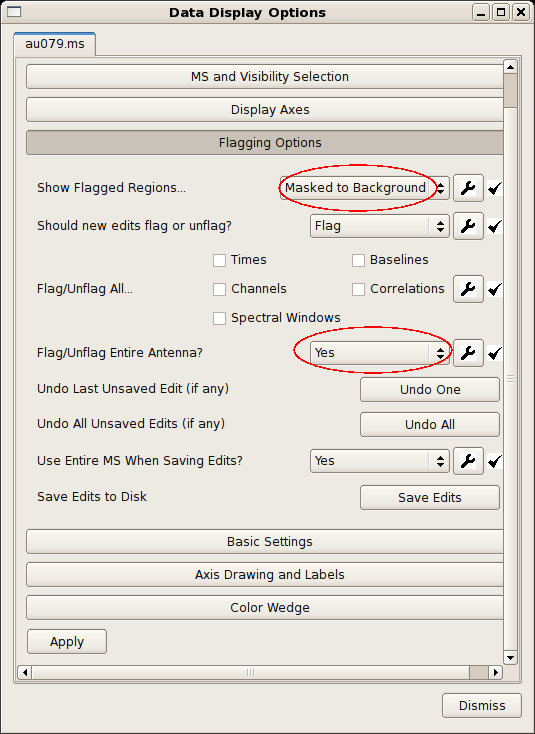
The blue highlights can be initially distracting, and they can be optionally suppressed by altering the Flagging Options in the Data Display Options. The figure at right shows the options.
In anticipation of the antenna-based editing to come, it's also worth setting the antenna flag.
Now, when multiple baselines are selected, all baselines to the common antenna will be flagged. There are also options to flag all correlators or channels, the latter being particularly helpful for spectral-line experiments. |
|
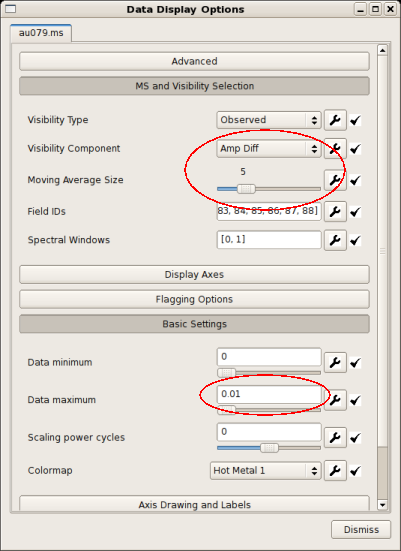
There is a choice of data to display. Select the MS and Visibility Selection tab on the Data Display Options window; see the figure at right. The Visibility Component menu allows you to choose to display visibility data from the following list.
The rolling time windows needed to calculate the Diff and RMS options are tuned using the Moving Average Size slider. All of these options are useful to investigate aberrant data, but Amp Diff can be efficient to start with. Reasonable options are shown in the figure at right. Be sure to turn down the display maximum (Data Maximum under Basic Settings) to bring out the fainter variations.
|
|
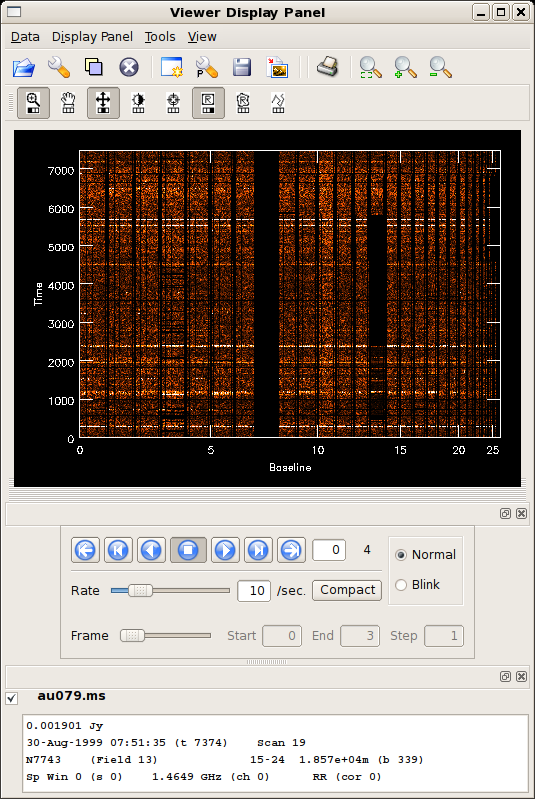
The result of these operations is illustrated in the figure at right. Data from the RR correlator are shown, but you can easily select the other correlators (RL, LR, LL) by using the blue, DVD-style control buttons The RR data look overall pretty good. The brighter horizontal stripes mark calibrator observations; brighter sources show greater noise. Antenna 13 looks a little junky, however, especially between time marks 1000 and 2500. |
Antenna-Based Flagging
The following steps outline flagging with viewer.
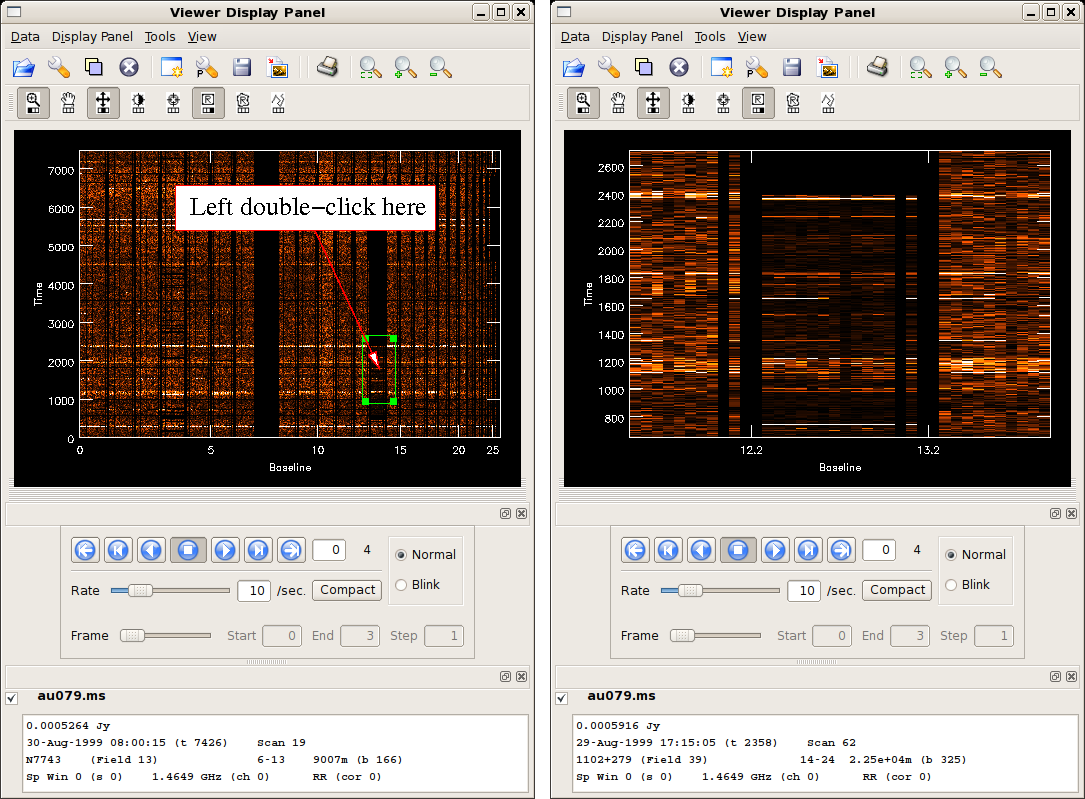
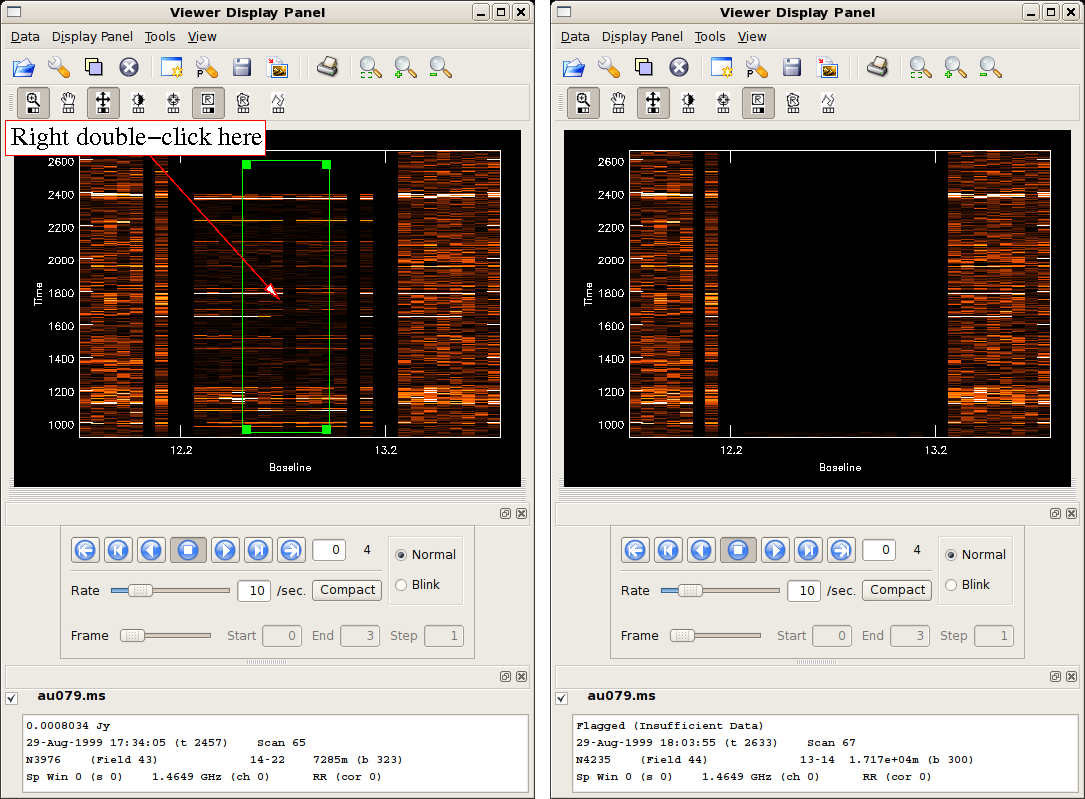
- Zoom in on junky-looking data using the zoom tool
 .
. - Use one of the drawing selectors
 to identify the bad data.
 - Zoom out
 and repeat.
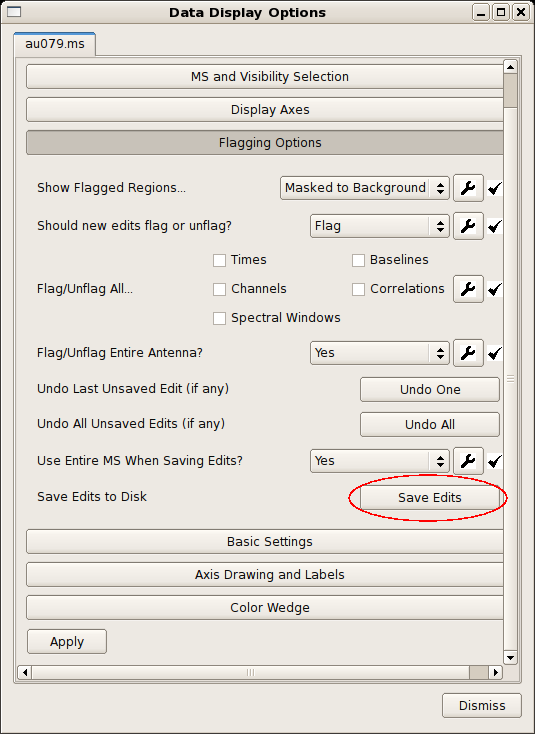
 - Important: save your edits! Under Flagging Options, use the Save Edits button.
This section of the tutorial provides a more detailed walkthrough.
Finishing up
To flag additional data, zoom out ![]() , select correlators
, select correlators ![]() as necessary, and repeat the steps outlined above.
as necessary, and repeat the steps outlined above.
It is absolutely vital to save your edits before leaving viewer. From the Data Display Options window, select Flagging Options and Save Edits (see figure at right). You are now ready for calibration and imaging!
--Jack Gallimore 19:14, 23 November 2009 (UTC)
