CASA EVLA Scripts: Difference between revisions
No edit summary |
No edit summary |
||
| Line 15: | Line 15: | ||
Download script: [[File:Script_plotWX.py]] | Download script: [[File:Script_plotWX.py]] | ||
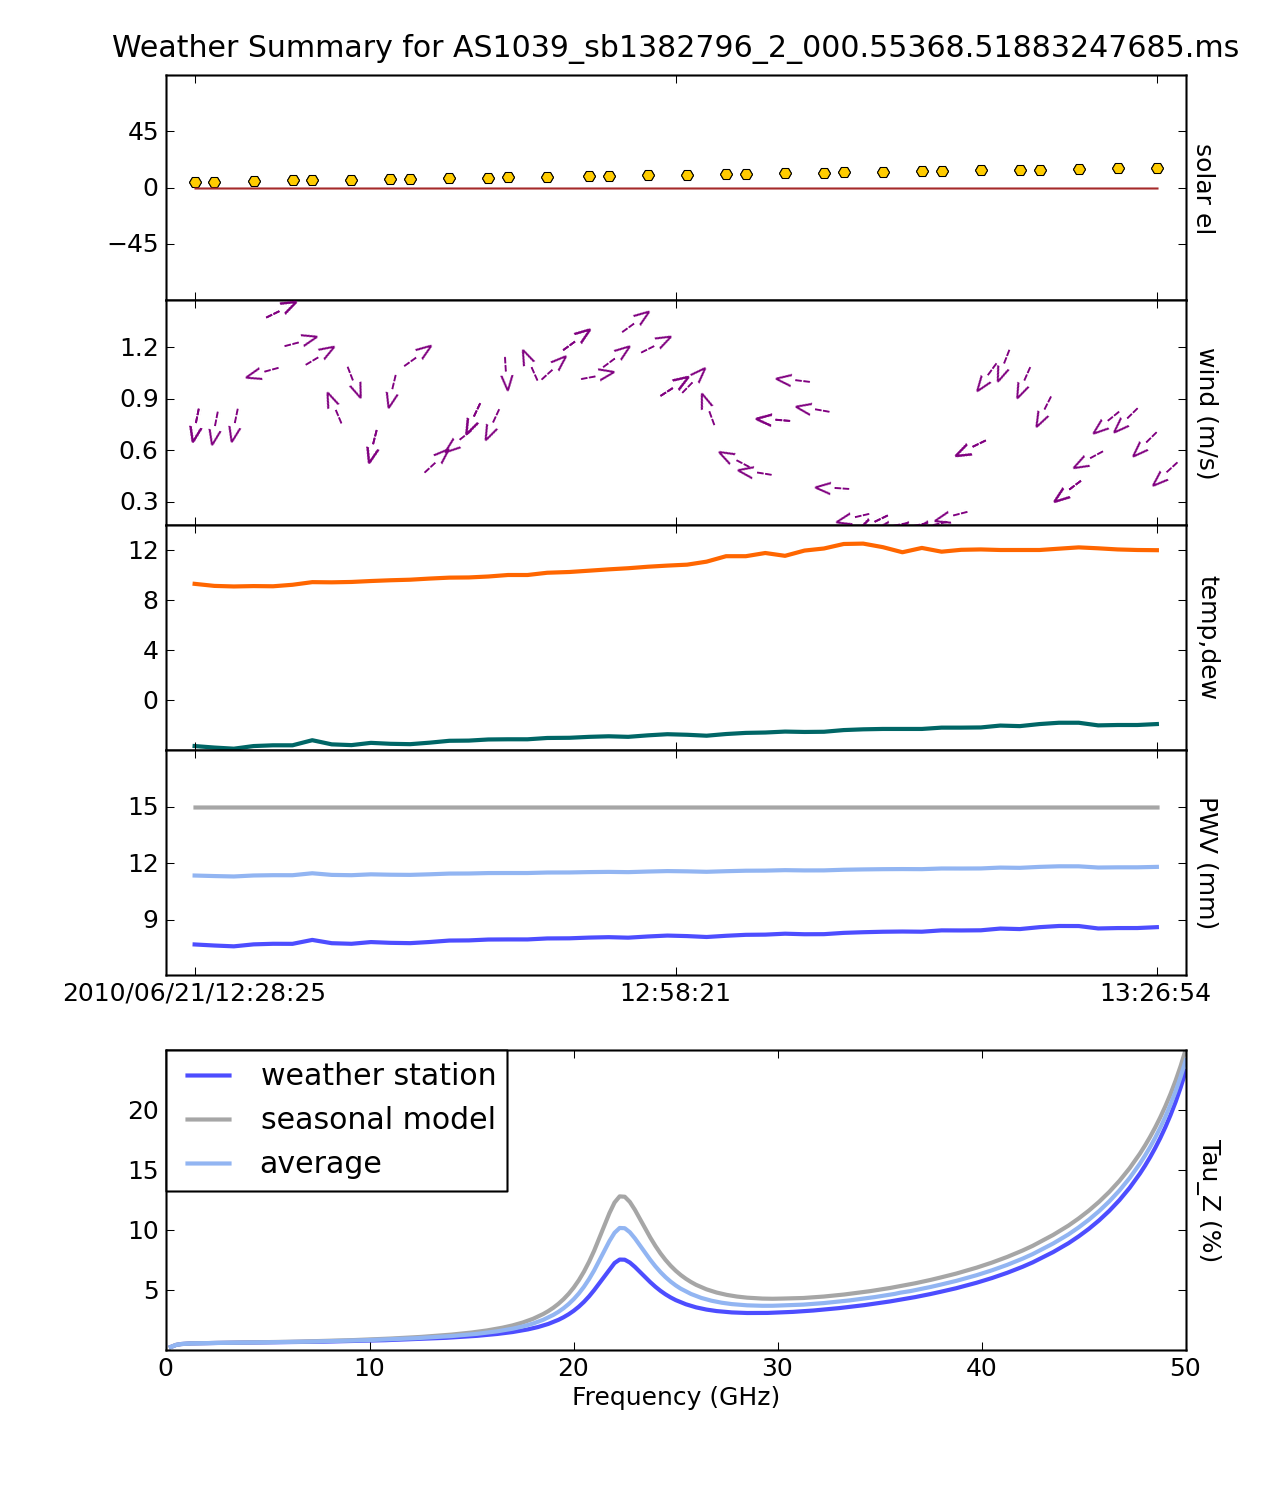
This script will plot weather | This script will plot weather information contained in the MS (see example below) as well as estimate the zenith opacity for each spectral window. This script is only intended for use with the EVLA-- it contains hardcoded site parameters and EVLA-specific models. Feel free to contact Josh Marvil (jmarvil + 'at' + nrao.edu) with questions or comments. | ||
The plot will contain the following subfigures: | |||
*The Sun's elevation, calculated from the date and time of the observation | |||
*Wind speed and direction, as read from the weather table | |||
*Temperature and Dewpoint, as read from the weather table | |||
*Estimates of Precipitable Water Vapor (PWV), based upon: | |||
**A Seasonal model based on VLA measurements between 1998-2005 (See VLA Test Memo #232) | |||
**A calculation involving temperature and dewpoint (See VLA Scientific Memo #176) | |||
**The average of the above two methods (currently accepted as the best predictor) | |||
*Zenith optical depth from 1-50 GHz, calculated for each of the above three estimates of PWV, averaged over time. This calculation uses the atmospheric toolkit available within casa (see help(at) within CASA for more info) | |||
This can be run from within CASA as a Script in the following way: | |||
#place Script_plotWX.py in your working directory | |||
#open Script_plotWX.py in a text editor | |||
#find this line near the top of the script: myMS='MSname.ms' | |||
#replace MSname.ms with the name of your measurement set, and save | |||
#in CASA, execute the script: | |||
<source lang="python"> | |||
# In CASA | |||
execfile 'Script_plotWX.py' | |||
</source> | |||
Or, this script can be run within CASA as a function: | |||
#place Script_plotWX.py in your working directory | |||
#in CASA, import the function definition and call the function, replacing MSname.ms with the name of your measurement set: | |||
<source lang="python"> | <source lang="python"> | ||
# In CASA | # In CASA | ||
from Script_plotWX import plotWX | from Script_plotWX.py import plotWX | ||
myTau = | myTau = plotWX('MSname.ms') | ||
</source> | </source> | ||
Revision as of 18:58, 26 January 2011
Edit this file to contribute or update
Overview
This is a collection of Python scripts to help process and analyze EVLA data. Although they are not officially supported, some authors may choose to provide contact information. A brief description on how to run each script is provided by the author. If you would like to contribute, and do not have access to the CASA Guides Wiki, you may email Miriam Krauss (mkrauss at nrao.edu).
Plotting the weather table, obtaining observation-specific opacity information

Download script: File:Script plotWX.py
This script will plot weather information contained in the MS (see example below) as well as estimate the zenith opacity for each spectral window. This script is only intended for use with the EVLA-- it contains hardcoded site parameters and EVLA-specific models. Feel free to contact Josh Marvil (jmarvil + 'at' + nrao.edu) with questions or comments.
The plot will contain the following subfigures:
- The Sun's elevation, calculated from the date and time of the observation
- Wind speed and direction, as read from the weather table
- Temperature and Dewpoint, as read from the weather table
- Estimates of Precipitable Water Vapor (PWV), based upon:
- A Seasonal model based on VLA measurements between 1998-2005 (See VLA Test Memo #232)
- A calculation involving temperature and dewpoint (See VLA Scientific Memo #176)
- The average of the above two methods (currently accepted as the best predictor)
- Zenith optical depth from 1-50 GHz, calculated for each of the above three estimates of PWV, averaged over time. This calculation uses the atmospheric toolkit available within casa (see help(at) within CASA for more info)
This can be run from within CASA as a Script in the following way:
- place Script_plotWX.py in your working directory
- open Script_plotWX.py in a text editor
- find this line near the top of the script: myMS='MSname.ms'
- replace MSname.ms with the name of your measurement set, and save
- in CASA, execute the script:
# In CASA
execfile 'Script_plotWX.py'
Or, this script can be run within CASA as a function:
- place Script_plotWX.py in your working directory
- in CASA, import the function definition and call the function, replacing MSname.ms with the name of your measurement set:
# In CASA
from Script_plotWX.py import plotWX
myTau = plotWX('MSname.ms')
Importing, listing, plotting, and applying online flags

Download script: File:Readflags.py
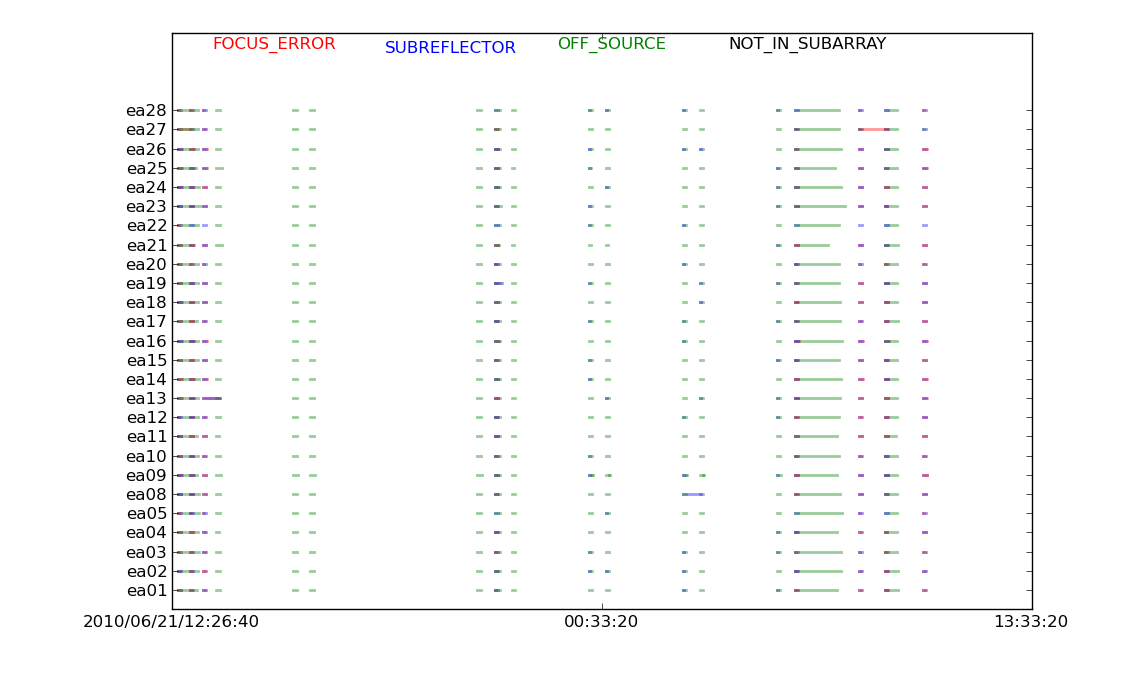
This script reads the Flags.xml table in the SDM directory, and parses the online antenna flags so that they can be listed, plotted, and applied to the MS. Note that the tbuff parameter is a padding value (in seconds) for creating the flag time ranges.
Here, flags are read in and listed, then plotted and applied. The plot file is saved to a file for future reference.
# In CASA
from Readflags import listflags, readflags, plotflags, useflags
myFlags = readflags('mySDMfile', tbuff=1.5)
listflags(myFlags)
plotflags(myFlags)
pl.savefig('mySDMfile_onlineFlags.png')
useflags('myVis.ms', myFlags)
Listing observation information directly from the SDM files
Download script: File:List sdm.py
This script lists information directly from the SDM directory's XML tables and prints this information to the CASA log. Formatting is similar to the task listobs; however, list_sdm is much faster for larger datasets, and can be run before (or while) importing to an MS.
It will also return a dictionary keyed on scan number. The dictionary contains the following information, which can be useful for scan selection prior to import:
       'baseband'   list of baseband name(s)
       'chanwidth'  list of channel widths (Hz)
       'end'        observation end time (UTC)
       'field'      field ID
       'intent'     scan intent(s)
       'nchan'      list of number of channels
       'nsubs'      number of subscans
       'reffreq'    list of reference frequencies (Hz)
       'source'     source name
       'spws'       list of spectral windows
       'start'      observation start time (UTC)
       'timerange'  start time - end time range (UTC)
# In CASA
from List_sdm import list_sdm
myScanDict = list_sdm('mySDMfile')
Representative log output:
2011-01-02 02:26:32 INFO listsdm	================================================================================
2011-01-02 02:26:32 INFO listsdm	   SDM File: AS1039_sb1382796_2_000.55368.51883247685
2011-01-02 02:26:32 INFO listsdm	================================================================================
2011-01-02 02:26:32 INFO listsdm	   Observer: Michael P. Rupen
2011-01-02 02:26:32 INFO listsdm	   Facility: EVLA, D-configuration
2011-01-02 02:26:32 INFO listsdm	      Observed from 2010/06/21/12:27:08.17 to 2010/06/21/13:26:55.70 (UTC)
2011-01-02 02:26:32 INFO listsdm	      Total integration time = 3587.53 seconds (1.00 hours)
2011-01-02 02:26:32 INFO listsdm
2011-01-02 02:26:32 INFO listsdm	Scan listing:
2011-01-02 02:26:32 INFO listsdm	  Timerange (UTC)           Scan FldID  FieldName       SpwIDs         Intent(s)
2011-01-02 02:26:32 INFO listsdm	  12:27:08.17 - 12:28:05.36    1     0  J2038+5119      [0, 1]  CALIBRATE_PHASE
2011-01-02 02:26:32 INFO listsdm	  12:28:05.36 - 12:29:05.20    2     0  J2038+5119      [2, 3]  CALIBRATE_PHASE
2011-01-02 02:26:32 INFO listsdm	  12:29:05.20 - 12:30:05.04    3     0  J2038+5119      [0, 1]  CALIBRATE_PHASE
2011-01-02 02:26:32 INFO listsdm	  12:30:05.04 - 12:36:04.05    4     1  V407 Cyg+4amin  [0, 1]  OBSERVE_TARGET
2011-01-02 02:26:32 INFO listsdm	  12:36:04.05 - 12:37:23.83    5     0  J2038+5119      [0, 1]  CALIBRATE_PHASE
2011-01-02 02:26:32 INFO listsdm	  12:37:23.83 - 12:50:21.71    6     1  V407 Cyg+4amin  [0, 1]  OBSERVE_TARGET
2011-01-02 02:26:32 INFO listsdm	  12:50:21.71 - 12:51:41.49    7     0  J2038+5119      [0, 1]  CALIBRATE_PHASE
2011-01-02 02:26:32 INFO listsdm	  12:51:41.49 - 12:53:01.27    8     2  J2048+4310      [2, 3]  CALIBRATE_PHASE
2011-01-02 02:26:32 INFO listsdm	  12:53:01.27 - 12:59:00.29    9     3  V407 Cyg+1amin  [2, 3]  OBSERVE_TARGET
2011-01-02 02:26:32 INFO listsdm	  12:59:00.29 - 13:00:20.07   10     2  J2048+4310      [2, 3]  CALIBRATE_PHASE
2011-01-02 02:26:32 INFO listsdm	  13:00:20.07 - 13:06:19.08   11     3  V407 Cyg+1amin  [2, 3]  OBSERVE_TARGET
2011-01-02 02:26:32 INFO listsdm	  13:06:19.08 - 13:07:38.86   12     2  J2048+4310      [2, 3]  CALIBRATE_PHASE
2011-01-02 02:26:32 INFO listsdm	  13:07:38.86 - 13:13:37.88   13     3  V407 Cyg+1amin  [2, 3]  OBSERVE_TARGET
2011-01-02 02:26:32 INFO listsdm	  13:13:37.88 - 13:14:57.66   14     2  J2048+4310      [2, 3]  CALIBRATE_PHASE
2011-01-02 02:26:32 INFO listsdm	  13:14:57.66 - 13:19:56.84   15     4  J0137+3309      [0, 1]  CALIBRATE_PHASE UNSPECIFIED CALIBRATE_BANDPASS CALIBRATE_AMPLI
2011-01-02 02:26:32 INFO listsdm	  13:19:56.84 - 13:21:56.52   16     4  J0137+3309      [2, 3]  CALIBRATE_PHASE UNSPECIFIED CALIBRATE_BANDPASS CALIBRATE_AMPLI
2011-01-02 02:26:32 INFO listsdm	  13:21:56.52 - 13:24:56.02   17     5  J0319+4130      [0, 1]  CALIBRATE_PHASE CALIBRATE_BANDPASS UNSPECIFIED
2011-01-02 02:26:32 INFO listsdm	  13:24:56.02 - 13:26:55.70   18     5  J0319+4130      [2, 3]  CALIBRATE_PHASE CALIBRATE_BANDPASS UNSPECIFIED
2011-01-02 02:26:32 INFO listsdm
2011-01-02 02:26:32 INFO listsdm	Spectral window information:
2011-01-02 02:26:32 INFO listsdm	  SpwID  #Chans  Ch0(MHz)  ChWidth(kHz) TotBW(MHz)  Baseband
2011-01-02 02:26:32 INFO listsdm	  0      64      1388.0    2000.0       128.0       BB_4
2011-01-02 02:26:32 INFO listsdm	  1      64      1756.0    2000.0       128.0       BB_8
2011-01-02 02:26:32 INFO listsdm	  2      64      4736.0    2000.0       128.0       BB_4
2011-01-02 02:26:32 INFO listsdm	  3      64      7836.0    2000.0       128.0       BB_8
2011-01-02 02:26:32 INFO listsdm
2011-01-02 02:26:32 INFO listsdm	Field information:
2011-01-02 02:26:32 INFO listsdm	  FldID  Code   Name             RA            Dec             SrcID
2011-01-02 02:26:32 INFO listsdm	  0      D      J2038+5119       20:38:37.03   +051.19.12.663  0
2011-01-02 02:26:32 INFO listsdm	  1      NONE   V407 Cyg+4amin   21:02:09.80   +045.50.32.980  1
2011-01-02 02:26:32 INFO listsdm	  2      D      J2048+4310       20:48:19.53   +043.10.42.073  2
2011-01-02 02:26:32 INFO listsdm	  3      NONE   V407 Cyg+1amin   21:02:09.80   +045.47.32.980  3
2011-01-02 02:26:32 INFO listsdm	  4      Z      J0137+3309       01:37:41.30   +033.09.35.133  4
2011-01-02 02:26:32 INFO listsdm	  5      Z      J0319+4130       03:19:48.16   +041.30.42.103  5
2011-01-02 02:26:32 INFO listsdm
2011-01-02 02:26:32 INFO listsdm	Antennas (26):
2011-01-02 02:26:32 INFO listsdm	  ID    Name   Station   Diam.(m)  Lat.          Long.
2011-01-02 02:26:32 INFO listsdm	  0     ea01   W09       25.0      +000.00.00.0  +000.00.00.0
2011-01-02 02:26:32 INFO listsdm	  1     ea02   E02       25.0      +033.53.51.0  -107.37.25.2
2011-01-02 02:26:32 INFO listsdm	  2     ea03   E09       25.0      +033.54.01.1  -107.37.04.4
2011-01-02 02:26:32 INFO listsdm	  3     ea04   W01       25.0      +033.53.53.6  -107.36.45.1
2011-01-02 02:26:32 INFO listsdm	  4     ea05   W08       25.0      +033.54.00.5  -107.37.05.9
2011-01-02 02:26:32 INFO listsdm	  5     ea08   N01       25.0      +033.53.53.0  -107.37.21.6
2011-01-02 02:26:32 INFO listsdm	  6     ea09   E06       25.0      +033.54.01.8  -107.37.06.0
2011-01-02 02:26:32 INFO listsdm	  7     ea10   N03       25.0      +033.53.57.7  -107.36.55.6
2011-01-02 02:26:32 INFO listsdm	  8     ea11   E04       25.0      +033.54.04.8  -107.37.06.3
2011-01-02 02:26:32 INFO listsdm	  9     ea12   E08       25.0      +033.53.59.7  -107.37.00.8
2011-01-02 02:26:32 INFO listsdm	  10    ea13   N07       25.0      +033.53.55.1  -107.36.48.9
2011-01-02 02:26:32 INFO listsdm	  11    ea14   E05       25.0      +033.54.12.9  -107.37.07.2
2011-01-02 02:26:32 INFO listsdm	  12    ea15   W06       25.0      +033.53.58.8  -107.36.58.4
2011-01-02 02:26:32 INFO listsdm	  13    ea16   W02       25.0      +033.53.56.4  -107.37.15.6
2011-01-02 02:26:32 INFO listsdm	  14    ea17   W07       25.0      +033.54.00.9  -107.37.07.5
2011-01-02 02:26:32 INFO listsdm	  15    ea18   N09       25.0      +033.53.54.8  -107.37.18.4
2011-01-02 02:26:32 INFO listsdm	  16    ea19   W04       25.0      +033.54.19.0  -107.37.07.8
2011-01-02 02:26:32 INFO listsdm	  17    ea20   N05       25.0      +033.53.59.1  -107.37.10.8
2011-01-02 02:26:32 INFO listsdm	  18    ea21   E01       25.0      +033.54.08.0  -107.37.06.7
2011-01-02 02:26:32 INFO listsdm	  19    ea22   N04       25.0      +033.53.59.2  -107.37.05.7
2011-01-02 02:26:32 INFO listsdm	  20    ea23   E07       25.0      +033.54.06.1  -107.37.06.5
2011-01-02 02:26:32 INFO listsdm	  21    ea24   W05       25.0      +033.53.56.5  -107.36.52.4
2011-01-02 02:26:32 INFO listsdm	  22    ea25   N02       25.0      +033.53.57.8  -107.37.13.0
2011-01-02 02:26:32 INFO listsdm	  23    ea26   W03       25.0      +033.54.03.5  -107.37.06.2
2011-01-02 02:26:32 INFO listsdm	  24    ea27   E03       25.0      +033.54.00.1  -107.37.08.9
2011-01-02 02:26:32 INFO listsdm	  25    ea28   N08       25.0      +033.54.00.5  -107.37.02.8
An entry from the scan dictionary:
CASA <16>: myScanDict
  Out[16]:
{1: {'baseband': ['BB_4', 'BB_8'],
     'chanwidth': [2000000.0, 2000000.0],
     'end': '2010/06/21/12:28:05.36',
     'field': 0,
     'intent': 'CALIBRATE_PHASE',
     'nchan': [64, 64],
     'nsubs': 1,
     'reffreq': [1388000000.0, 1756000000.0],
     'source': 'J2038+5119',
     'spws': [0, 1],
     'start': '2010/06/21/12:27:08.17',
     'timerange': '2010/06/21/12:27:08.17~2010/06/21/12:28:05.36'},