Data flagging with plotms: Difference between revisions
| Line 29: | Line 29: | ||
<div style="float: left; width: 50%; align: left;"> | <div style="float: left; width: 50%; align: left;"> | ||
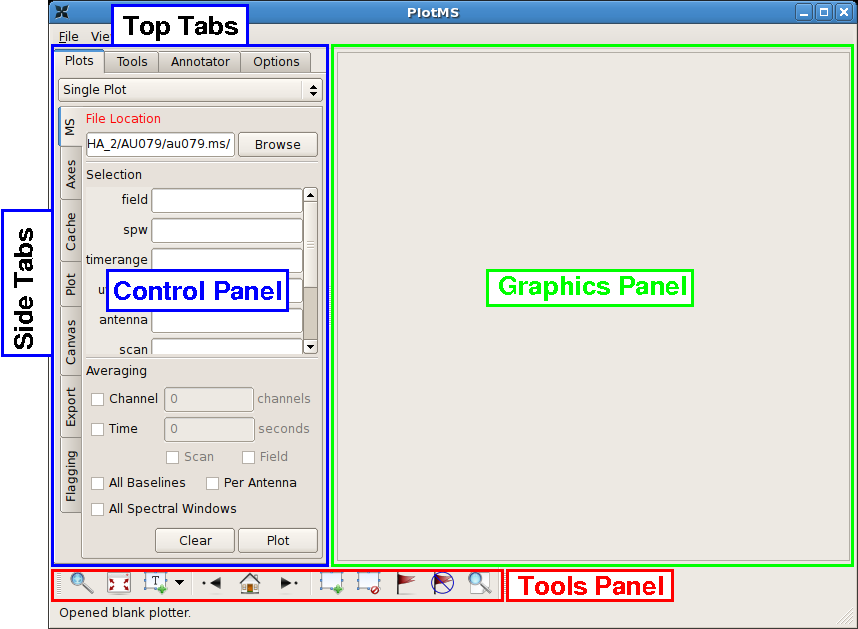
This command brings up the PlotMS window, shown at right. Notice the panel of ''tabs'' located on the left side of the window. Each tab contains a set of related parameters that control the appearance and flagging behavior of the window. | This command brings up the PlotMS window, shown at right. Notice the panel of ''tabs'' located on the left side of the window. Each tab contains a set of related parameters that control the appearance and flagging behavior of the window. For this tutorial, we will be using the following tabs. | ||
* '''MS''', which controls the selection of the measurement set proper and the selection of data within the measurement set. | |||
* '''Axes''', which controls the selection of data and plotting parameters for the (''x'', ''y'') graph. | |||
* '''Flagging''', which controls the how flagging commands are extended (as of 1 Dec 2009, these flagging extensions are very limited but will likely improve as casaplotms continues development). | |||
There is also a row of tabs (Plots, Tools, Annotator, and Options) along the top of the control panel. | |||
In this tutorial, interactive commands in the PlotMS window will be summarized as (Tab)'''Command,''', where (Tab) represents the | |||
Use the | Use the | ||
Revision as of 15:17, 1 December 2009
Casaplotms is (currently) a standalone tool to inspect and edit measurement sets. This tutorial demonstrates how to use casaplotms to edit a multisource continuum data set: VLA program AU079, which consists of L-band (20 cm) continuum observations of galaxies and calibrator sources. It is the same data set used in the Imaging Flanking Fields tutorial, as well as the Data flagging with viewer tutorial.
Loading the Measurement Set into Casaplotms
As described in the Imaging Flanking Fields tutorial, the data may be loaded into CASA using the importvla command. The following commands import the data into the measurement set au079.ms and exit CASA to the command line.
# import the glob command for filename searching with wildcards
from glob import glob

# Define the list of files for reading. Use glob to perform wildcard matching with VLA archive filenames.
fileList = glob('AU079_*.xp?')

importvla(archivefiles=fileList,vis='au079.ms')
exit()
Now start up casaplotms from the command line.
# in bash
casaplotms
|
This command brings up the PlotMS window, shown at right. Notice the panel of tabs located on the left side of the window. Each tab contains a set of related parameters that control the appearance and flagging behavior of the window. For this tutorial, we will be using the following tabs.
There is also a row of tabs (Plots, Tools, Annotator, and Options) along the top of the control panel. In this tutorial, interactive commands in the PlotMS window will be summarized as (Tab)Command,, where (Tab) represents the Use the Browse button to navigate to and select the measurement set (here, au079.ms) |
|
|
--Jack Gallimore 14:38, 1 December 2009 (UTC)
