Averaging data in plotms: Difference between revisions
From CASA Guides
Jump to navigationJump to search
No edit summary |
No edit summary |
||
| Line 1: | Line 1: | ||
You can average your measurement set on the fly with [[plotms]]. The '''averaging''' options can be found under the Data tab, and are mostly intuitive. | You can average your measurement set on the fly with [[plotms]]. The '''averaging''' options can be found under the Data tab, and are mostly intuitive. | ||
{|vspace="100" | |||
|- | |||
| | |||
<div style="float: left; width: 50%; align: left;"> | |||
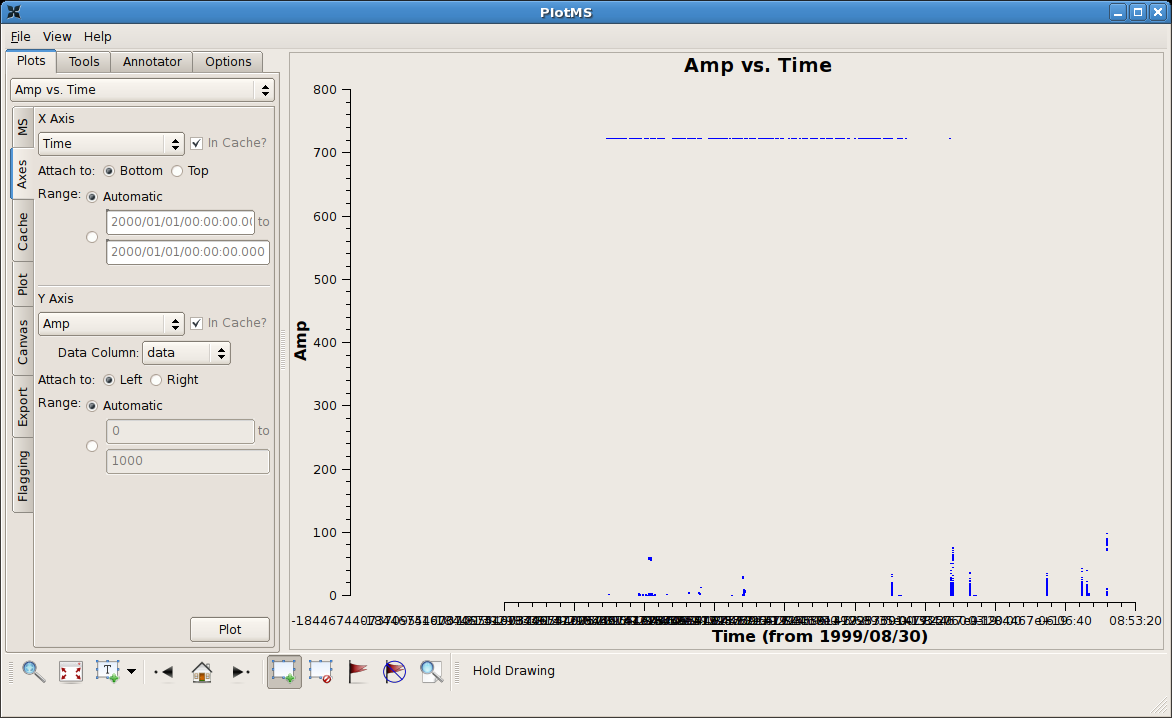
Have a first look at the data by hitting the (MS)'''Plot''' button. By default, the axes will be visibility amplitude vs. time. The ''y''-axis amplitudes aren't yet calibrated, but for the sake of the discussion we'll refer to them as flux densities in Jy. | |||
The ''x''-axis labeling is a little garbled in this development version of the software, but straightaway there appear some wildly discrepant data. For a typical decimeter-wave continuum data set, sources and calibrators are expected to show visibility amplitudes of a few Jy or less; visibilities with amplitudes in the 100s of Jy range are <s>likely</s> bogus. Here's how to flag them. | |||
</div> | |||
<div style="float: right; width: 50%; text-align: center;"> | |||
[[File:casaplotms-add-01.png | 500px]] | |||
''Click to enlarge'' | |||
</div> | |||
|- style="background-color:#eeeeee;" | |||
| | |||
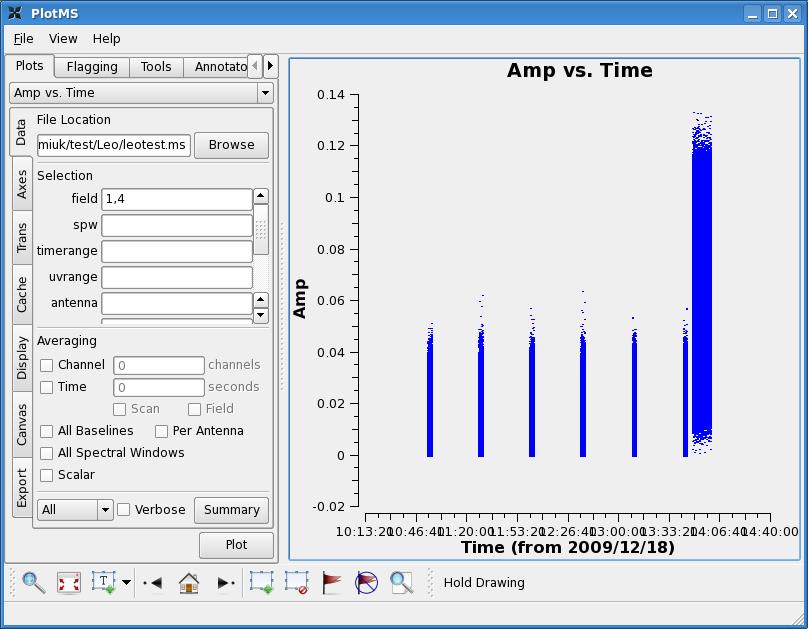
[[File:plotms_timeave0.jpg|thumb|Data with no time averaging.]] | [[File:plotms_timeave0.jpg|thumb|Data with no time averaging.]] | ||
Revision as of 01:21, 19 February 2010
You can average your measurement set on the fly with plotms. The averaging options can be found under the Data tab, and are mostly intuitive.

