Plotweather: Difference between revisions
From CASA Guides
Jump to navigationJump to search
Created page with "'''Return to Analysis Utilities''' This page documents the '''plotWeather''' function of Python module analysisUtils. Compiles and plots the major we..." |
No edit summary |
||
| Line 3: | Line 3: | ||
This page documents the '''plotWeather''' function of Python module [[Analysis Utilities|analysisUtils]]. | This page documents the '''plotWeather''' function of Python module [[Analysis Utilities|analysisUtils]]. | ||
Compiles and plots the major weather parameters from the ALMA weather station as recorded in the specified MS, for the duration of the MS. (Note: plotweather and plotWeather are synonyms.) | Compiles and plots the major weather parameters from the ALMA (or the EVLA) weather station as recorded in the specified MS, for the duration of the MS. (Note: plotweather and plotWeather are synonyms.) | ||
==Examples== | ==Examples== | ||
Revision as of 14:19, 30 April 2012
Return to Analysis Utilities
This page documents the plotWeather function of Python module analysisUtils.
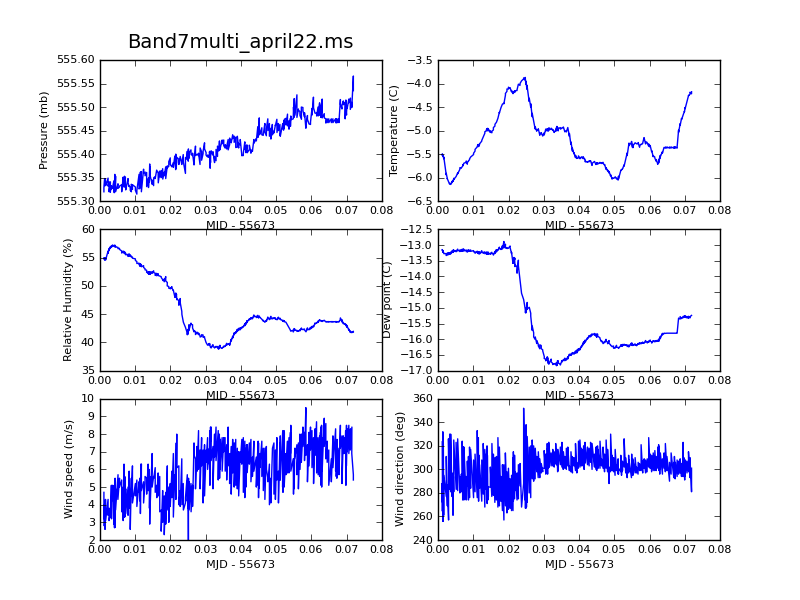
Compiles and plots the major weather parameters from the ALMA (or the EVLA) weather station as recorded in the specified MS, for the duration of the MS. (Note: plotweather and plotWeather are synonyms.)
Examples
# In CASA
au.plotWeather(vis='',figfile='',help=True)
plotWeather(vis='', figfile='')
  Plots pressure, temperature, relative humidity, wind speed and direction.
  The default plot file name will be 'vis'.weather.png.
# In CASA
au.plotWeather('Band7multi_april22.ms')
