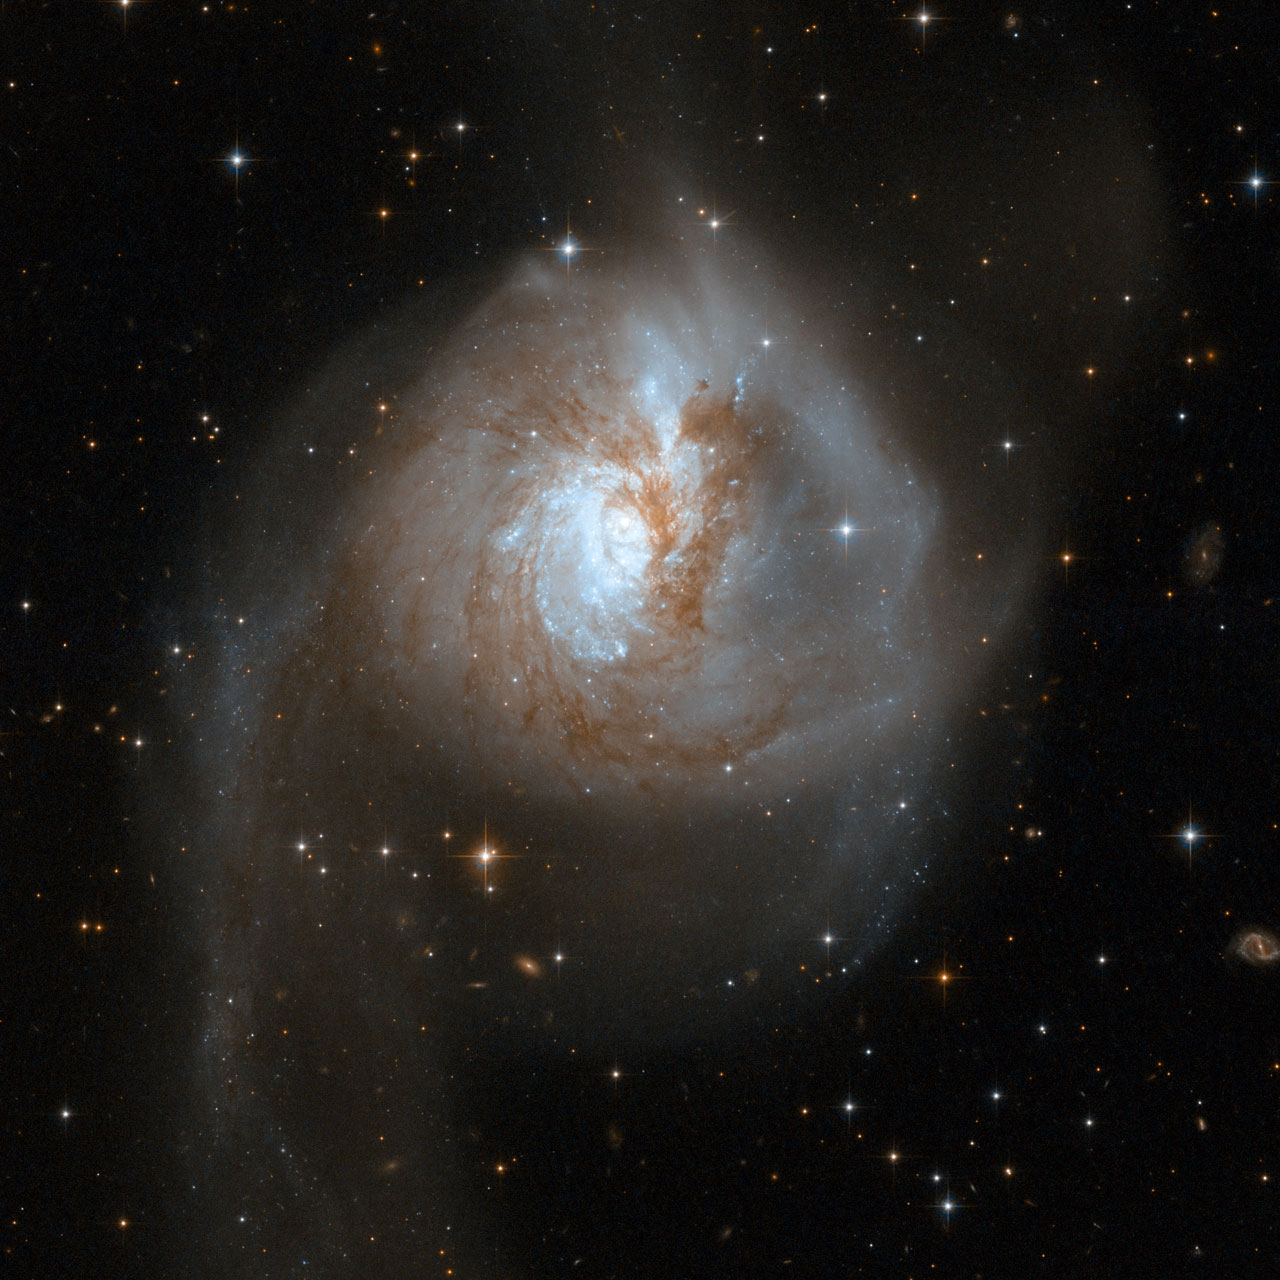
NGC3256Band3 for CASA 3.3: Difference between revisions
No edit summary |
|||
| Line 34: | Line 34: | ||
<source lang="python"> | <source lang="python"> | ||
# In a terminal outside CASA | # In a terminal outside CASA | ||
tar -xvf | tar -xvf RawDataAndTablesForReduction.tgz | ||
</source> | </source> | ||
Revision as of 23:11, 24 May 2011
Science Target Overview

[To be written by Eric]
ALMA Data Overview
ALMA Science verification data on NGC3256 in Band 3 were taken in six different datasets over two consecutive nights: April 16-17, 2011. There are three datasets for April 16th and three for April 17th. These Band 3 observations utilized all four available basebands, which are associated with four different spectral windows: two in the Upper Sideband (USB) and two in the Lower Sideband (LSB). The first spectral window is centered on the CO(1-0) emission line in the galaxy NGC 3256 and is our highest frequency spectral window. There is one additional spectral window in the Upper Side Band (USB), and there are two spectral windows in the Lower Side Band (LSB). These additional spectral windows are used to measure the continuum emission in the galaxy, and may contain other emission lines as well. Each spectral window has a total bandwidth of 2 GHz divided over 128 channels, for a channel width of 15.625 MHz.
In this tutorial, we will guide you step-by-step through the reduction of the ALMA science verification data on NGC3256 and its subsequent imaging. For a similar tutorial on the reduction of ALMA Band 7 data on TW Hydra, see TWHydraBand7.
How to use this Casa Guide
This CASA Guide consists of two parts:
To start the data reduction process from the raw data, begin with the Calibration section: NGC3256 Band3 - Calibration. Once you have completed that section, or if you would like to skip over the calibration process, proceed to NGC3256 Band3 - Imaging.
For both portions of the guide, we will provide you with the full CASA commands needed to carry out each step. Simply copy and paste the commands into your CASA terminal. For a brief introduction to the different ways CASA can be run, see EVLA_Spectral_Line_Calibration_IRC+10216#How_to_Use_This_casaguide page. For further help getting started with CASA, see Getting_Started_in_CASA.
Obtaining the Data
Raw Data
Here we provide you with "starter" datasets, where we have taken the raw data in ALMA Science Data Model (ASDM) format and converted them to CASA Measurement Sets (MS). We did this using the importasdm task in CASA.
Along with the Measurement Sets, we also provide some tables that you will need for the calibration. These include the System Temperature (Tsys) tables, which contain corrections for atmospheric opacity, and Water Vapor Radiometer (WVR) tables, which contain the atmospheric phase corrections determined by the water vapor radiometers on each antenna.
You can download the data here:
[LINK]
Once the download has finished, unpack the file:
# In a terminal outside CASA
tar -xvf RawDataAndTablesForReduction.tgz
Calibrated Data
For those wishing to skip the calibration section, we also provide the fully-calibrated data on the science target.
You can download the data here:
[LINK]
Once the download has finished, unpack the file:
# In a terminal outside CASA
tar -xvf ngc3256band3cal.tgz