CASA Contributed Script: plotweather: Difference between revisions
From CASA Guides
Jump to navigationJump to search
No edit summary |
|||
| (One intermediate revision by the same user not shown) | |||
| Line 3: | Line 3: | ||
[[Image:PlotWX.png|200px|thumb|right|plotWX weather table figure]] | [[Image:PlotWX.png|200px|thumb|right|plotWX weather table figure]] | ||
<span style="color:#FF0000"> NOTE: A revised version of this method is now available in the CASA task 'plotweather'. Please use the new task for calibration purposes. </span> | |||
Download script: [[File:Script_plotWX.py]] | Download script: [[File:Script_plotWX.py]] | ||
Latest revision as of 17:26, 13 December 2012
Plotting the weather table, obtaining observation-specific opacity information

NOTE: A revised version of this method is now available in the CASA task 'plotweather'. Please use the new task for calibration purposes.
Download script: File:Script plotWX.py
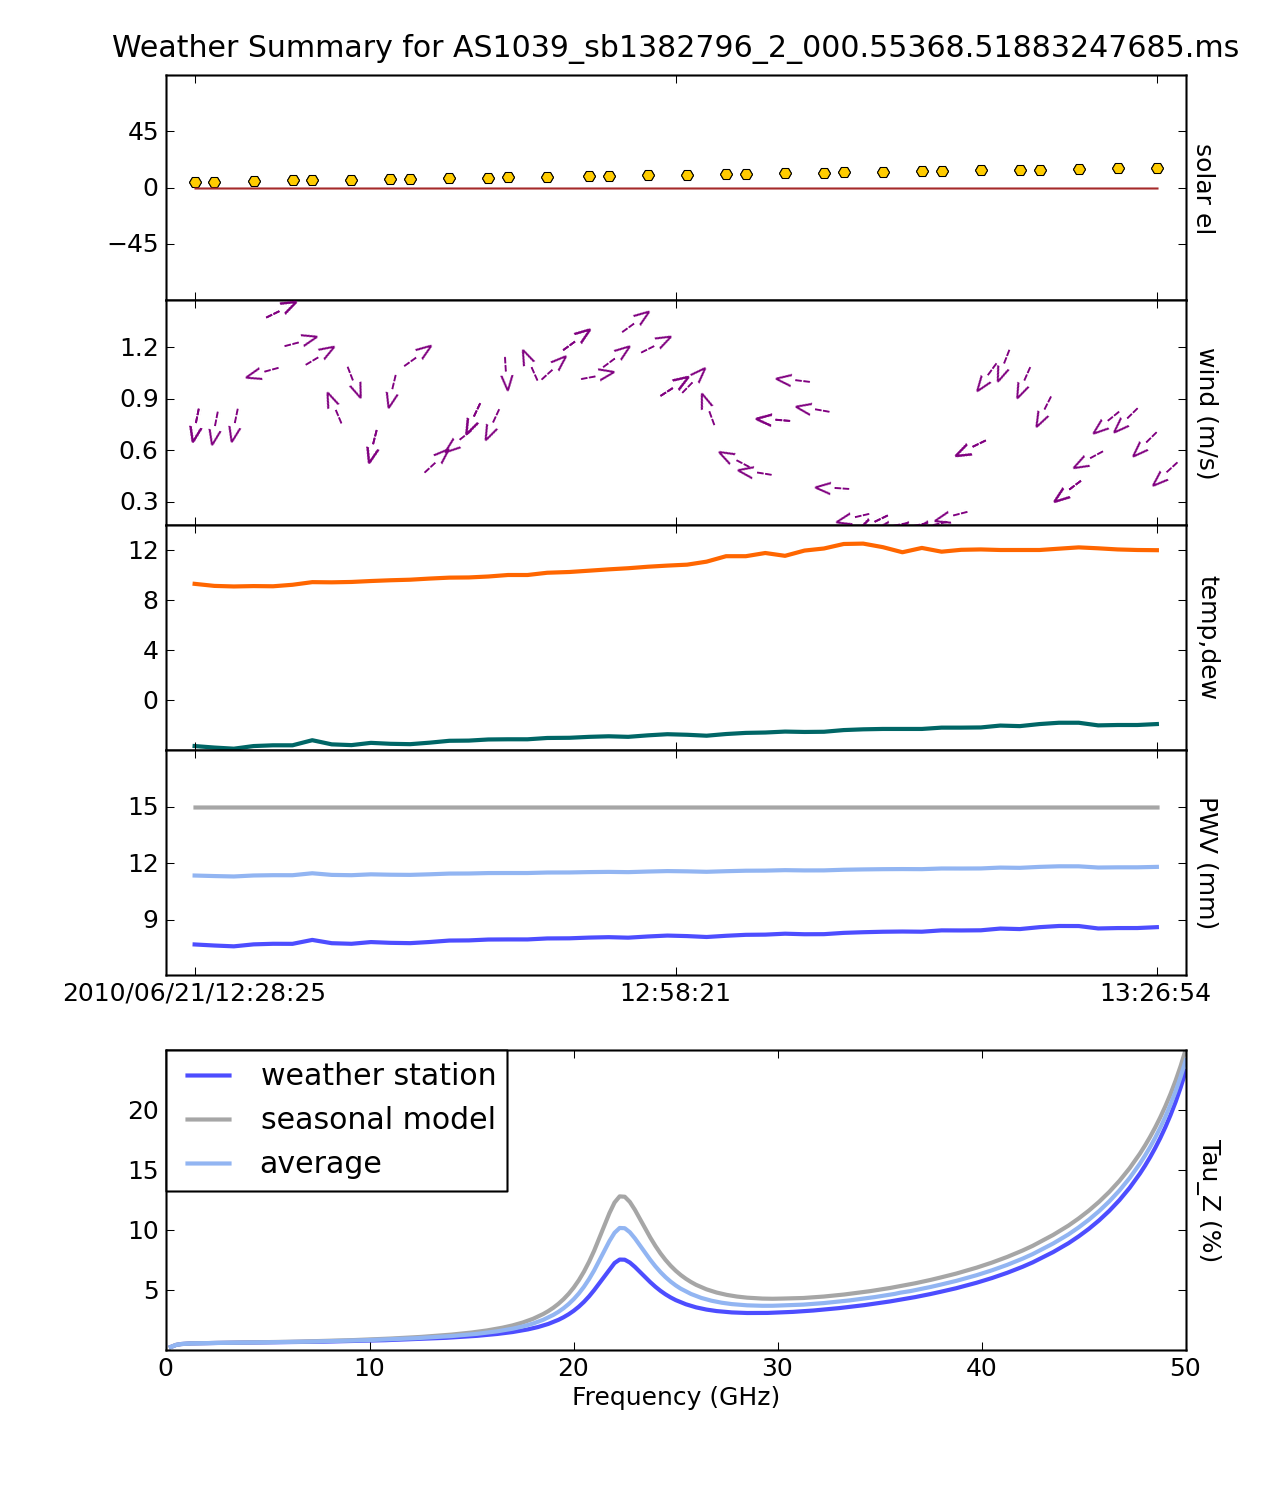
This script will plot weather information contained in the MS (see example below) as well as estimate the zenith opacity for each spectral window. This script is only intended for use with the EVLA-- it contains hardcoded site parameters and EVLA-specific models. Feel free to contact Josh Marvil (jmarvil + 'at' + nrao.edu) with questions or comments.
The plot will contain the following subfigures:
- The Sun's elevation, calculated from the date and time of the observation
- Wind speed and direction, as read from the weather table
- Temperature and Dewpoint, as read from the weather table
- Estimates of Precipitable Water Vapor (PWV), based upon:
- A Seasonal model based on VLA measurements between 1998-2005 (See VLA Test Memo #232)
- A calculation involving temperature and dewpoint (See VLA Scientific Memo #176)
- The average of the above two methods (currently accepted as the best predictor)
- Zenith optical depth from 1-50 GHz, calculated for each of the above three estimates of PWV, averaged over time. This calculation uses the atmospheric toolkit available within casa (see help(at) within CASA for more info)
This can be run from within CASA as a Script in the following way:
- place Script_plotWX.py in your working directory
- open Script_plotWX.py in a text editor
- edit the last line of the script, replacing MSname.ms with the name of your measurement set, and save
- in CASA, execute the script:
# In CASA
execfile 'Script_plotWX.py'
Or, this script can be run within CASA as a function:
- place Script_plotWX.py in your working directory
- in CASA, import the function definition and call the function, replacing MSname.ms with the name of your measurement set:
# In CASA
from Script_plotWX import plotWX
myTau = plotWX('MSname.ms')