Image: Difference between revisions
From CASA Guides
Jump to navigationJump to search
No edit summary |
No edit summary |
||
| (4 intermediate revisions by 2 users not shown) | |||
| Line 1: | Line 1: | ||
{{Simulations Intro}} | {{Simulations Intro 4.0}} | ||
[[Category: Simulations]] | [[Category: Simulations]] | ||
* <tt> | * <tt>simanalyze</tt> just calls a subset of <tt>[[clean]]</tt>, so you should refer to help clean for more information. | ||
* '''vis''' can be one Measurement Set, or a list e.g. "[project.ms,project.sd.ms]" if you want to deconvolve both Single Dish and interferometric data into images. <tt> | * '''vis''' can be one Measurement Set, or a list e.g. "[project.ms,project.sd.ms]" if you want to deconvolve both Single Dish and interferometric data into images. <tt>simanalyze</tt> will first (or only, if you're doing total power only) grid the single dish data, then use the resulting image as '''modelimage''' input to the <tt>clean</tt> task. Various permutations of this are possible. If you run <tt>simanalyze</tt> once only in single dish mode, and create a gridded image, then you can return later and run <tt>simanalyze</tt> again predicting interferometric visibilities, and either specify the single dish measurement set in '''vis''', or only specify the interferometric measurement set there, and specify the existing single dish image directly in '''modelimage'''. | ||
See [[ACA Simulation (CASA 3.4)|ACA Simulation]] for more details. | |||
* '''imsize''' and '''cell''' specify the output image just as in <tt>clean</tt> | * '''imsize''' and '''cell''' specify the output image just as in <tt>clean</tt> | ||
| Line 16: | Line 17: | ||
* '''niter''' and '''threshold''' specify how deeply to clean ('''niter'''=0 is acceptable to create a dirty image) | * '''niter''' and '''threshold''' specify how deeply to clean ('''niter'''=0 is acceptable to create a dirty image) | ||
* <tt> | * <tt>simanalyze</tt>'s default clean parameters are not particularly aggressive and almost certainly not optimal for your application. I recommend that you run <tt>simanalyze</tt> and then clean the measurement set in various ways to determine the best results. Once a deconvolved image exists, as long as you name it $project.image, you can run only the <tt>analyze</tt> subtask of <tt>simanalyze</tt> to calculate difference and fidelity images. | ||
only the <tt>analyze</tt> subtask of <tt> | |||
* <font color="green">Single-dish only NOTE</font>: If you are only simulating a single dish observation, <tt> | * <font color="green">Single-dish only NOTE</font>: If you are only simulating a single dish observation, <tt>simanalyze</tt> does not perform deconvolution, so '''niter''', etc are not relevant. The useful parameters are restricted to '''vis''', '''imsize''', '''cell''', and '''stokes'''. | ||
Latest revision as of 15:18, 2 November 2012
↵ Simulating Observations in CASA
- simanalyze just calls a subset of clean, so you should refer to help clean for more information.
- vis can be one Measurement Set, or a list e.g. "[project.ms,project.sd.ms]" if you want to deconvolve both Single Dish and interferometric data into images. simanalyze will first (or only, if you're doing total power only) grid the single dish data, then use the resulting image as modelimage input to the clean task. Various permutations of this are possible. If you run simanalyze once only in single dish mode, and create a gridded image, then you can return later and run simanalyze again predicting interferometric visibilities, and either specify the single dish measurement set in vis, or only specify the interferometric measurement set there, and specify the existing single dish image directly in modelimage.
See ACA Simulation for more details.
- imsize and cell specify the output image just as in clean
- Cotton-Schwab clean is selected for single fields, and Mosaic gridding for mosaic simulations. For more detail and flexibility see the clean task.
- weighting selects natural, briggs (robust=0.5), or uniform weighting.
- outertaper allows application of an additional uv taper to the outer scales.
- niter and threshold specify how deeply to clean (niter=0 is acceptable to create a dirty image)
- simanalyze's default clean parameters are not particularly aggressive and almost certainly not optimal for your application. I recommend that you run simanalyze and then clean the measurement set in various ways to determine the best results. Once a deconvolved image exists, as long as you name it $project.image, you can run only the analyze subtask of simanalyze to calculate difference and fidelity images.
- Single-dish only NOTE: If you are only simulating a single dish observation, simanalyze does not perform deconvolution, so niter, etc are not relevant. The useful parameters are restricted to vis, imsize, cell, and stokes.
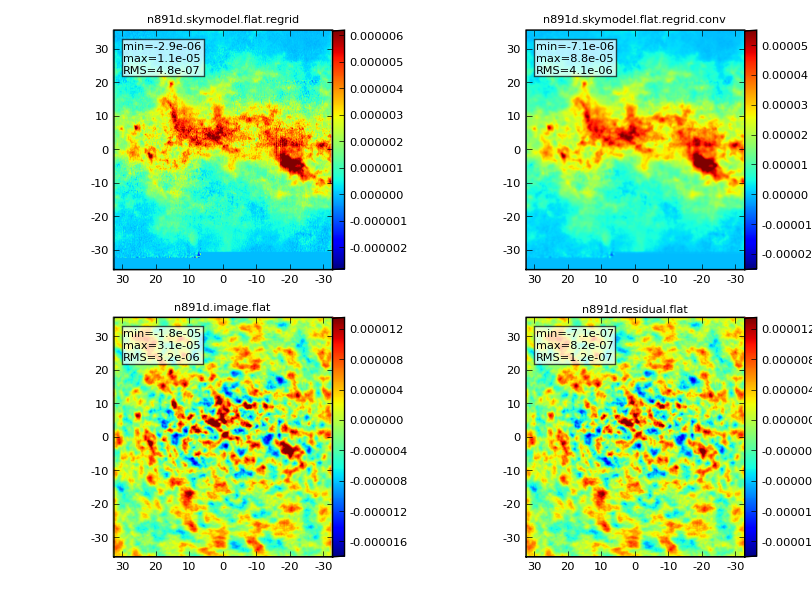
Graphic Output
If you have graphics turned on, you will see output such as below:
