PlotSunDuringTrack: Difference between revisions
From CASA Guides
Jump to navigationJump to search
Created page with "'''Return to Analysis Utilities''' This page documents the plotSunDuringTrack function of Python module analysisUtils. This function will plot the..." |
|||
| (One intermediate revision by the same user not shown) | |||
| Line 15: | Line 15: | ||
<source lang="python"> | <source lang="python"> | ||
CASA <2>: au.plotSunDuringTrack(asdm='uid___A002_X54d35d_X761',plotfile=True) | CASA <2>: au.plotSunDuringTrack(asdm='uid___A002_X54d35d_X761',plotfile=True) | ||
</source> | |||
<code><pre> | |||
Found 21 scans in Scan.xml | Found 21 scans in Scan.xml | ||
Out[2]: 'uid___A002_X54d35d_X761.sun.png' | Out[2]: 'uid___A002_X54d35d_X761.sun.png' | ||
</ | </pre> | ||
</code> | |||
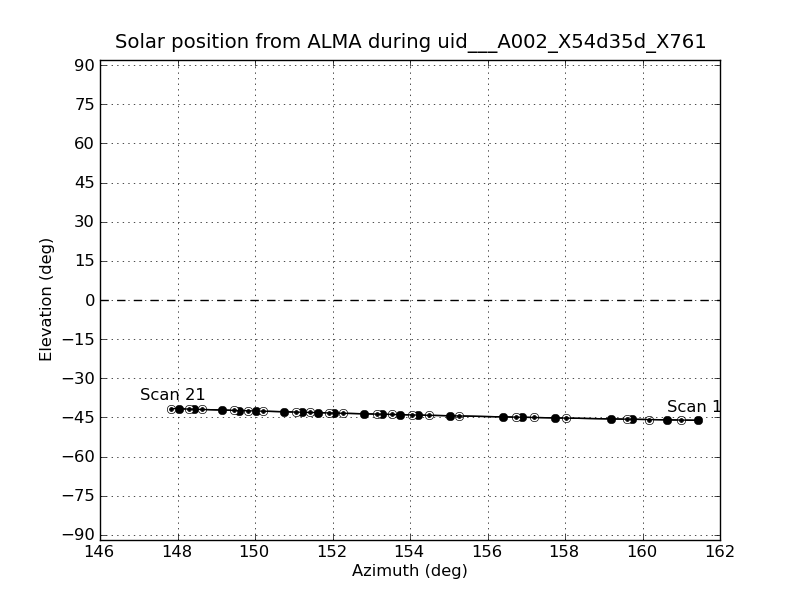
[[File:Uid_A002_X54d35d_X761.sun.png]] | |||
Latest revision as of 05:04, 27 January 2013
Return to Analysis Utilities
This page documents the plotSunDuringTrack function of Python module analysisUtils.
This function will plot the solar azimuth vs. elevation during a dataset, with points for the start and end of each scan, and with the first and final scan labeled. You can specify either the ms or the asdm. It reads the observatory name from the ExecBlock?.xml (ASDM) or the OBSERVATION table (ms). Returns the name of the plotfile.
Usage:
au.plotSunDuringTrack(ms=", asdm=, plotfile=, figfiledir=)
You must give either an ms or an asdm. The plotfile argument can be: True, False, or a string name
ALMA example
CASA <2>: au.plotSunDuringTrack(asdm='uid___A002_X54d35d_X761',plotfile=True)
  Found  21  scans in Scan.xml
  Out[2]: 'uid___A002_X54d35d_X761.sun.png'
