AntennaeBand7: Difference between revisions
| (54 intermediate revisions by 8 users not shown) | |||
| Line 1: | Line 1: | ||
[[Category:ALMA]][[Category:Calibration]][[Category:Spectral Line]] | [[Category:ALMA]][[Category:Calibration]][[Category:Spectral Line]] | ||
{{checked_6.6.1}} | |||
== | == Antennae Band 7 Data Reduction Tutorial == | ||
[[File:604px-Antennae_galaxies_xl.jpg| | |||
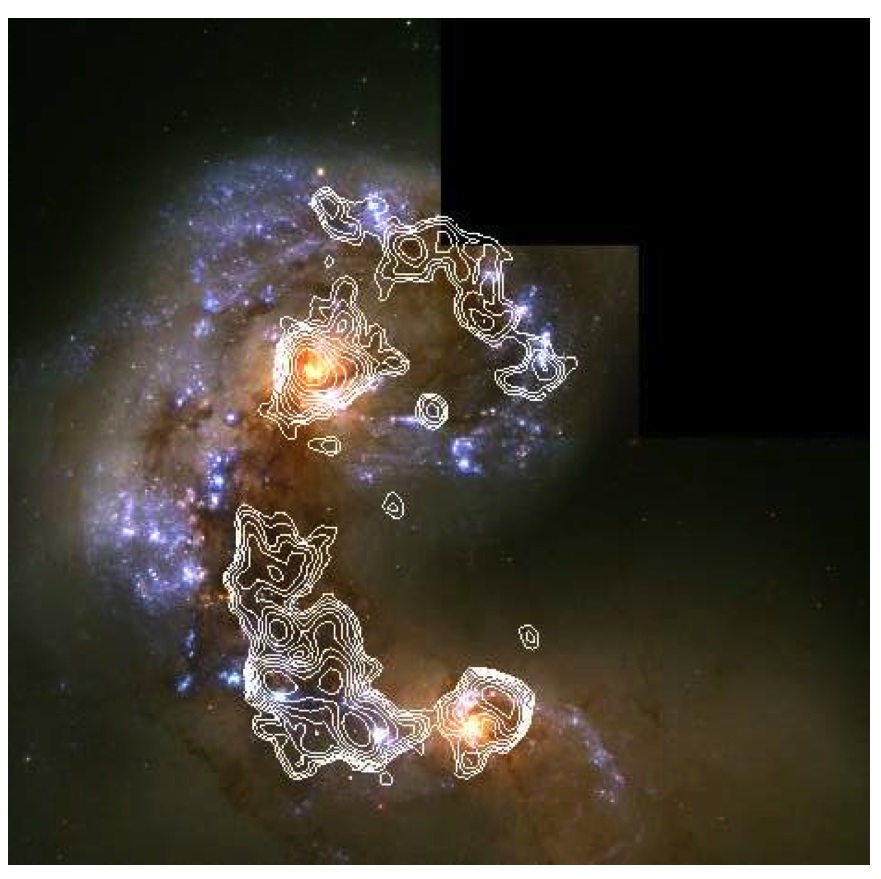
[[File:Wilson00-antennaeco1-0.jpg| | [[File:604px-Antennae_galaxies_xl.jpg|300px|thumb|right|'''Fig. 1.''' HST image of the Antennae. White contours correspond to the CO(1-0) intensity map in Wilson et al. (2000; see also Fig. 2). (Credit: NASA, ESA, and the Hubble Heritage Team STScI/AURA-ESA/Hubble Collaboration). Acknowledgement: B. Whitmore ( Space Telescope Science Institute) and James Long (ESA/Hubble)]] | ||
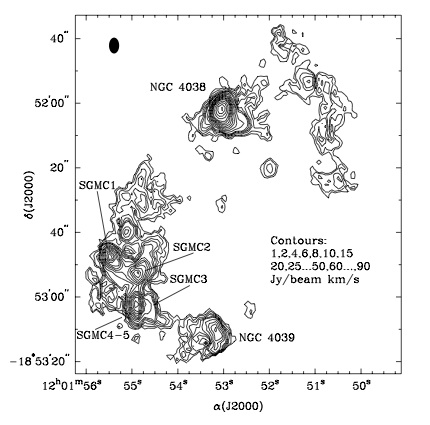
[[File:Wilson00-antennaeco1-0.jpg|300px|thumb|right|'''Fig. 2.''' Caltech millimeter array (OVRO) CO(1-0) integrated intensity map from Wilson et al. (2000). ]] | |||
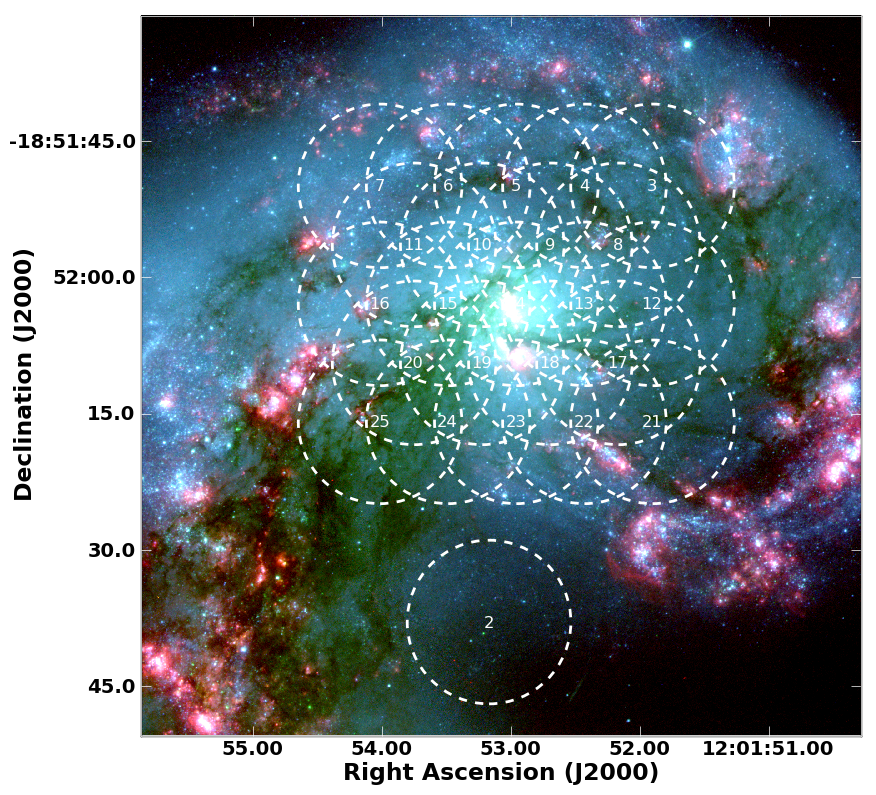
[[File:antennae_foralmaCO3_2_north_withSV.png|300px|thumb|right|'''Fig. 3''' Coverage of the "Northern Mosaic" carried out for ALMA Science Verification overlaid on an HST image. Circles show the FWHM of the primary beam for the individual pointings, which were observed in rapid succession during each of the "Northern" observations.]] | |||
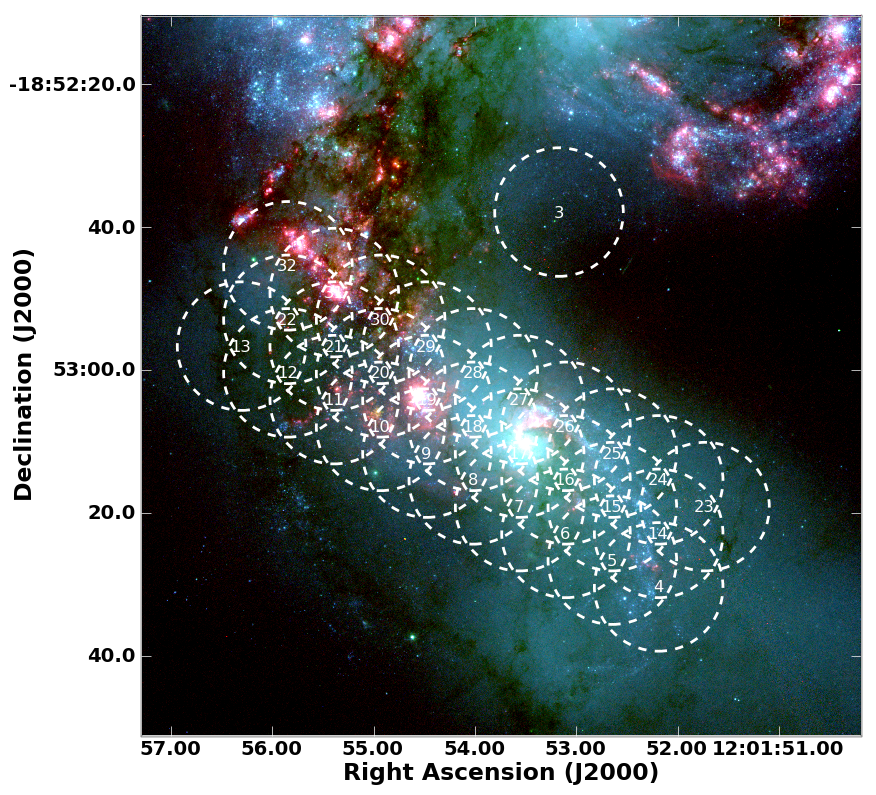
[[File:antennae_foralmaCO3_2_withSV.png|300px|thumb|right|'''fig 4.''' Coverage of the "Southern Mosaic" carried out for ALMA Science Verification overlaid on an HST image. Circles show the FWHM of the primary beam for the individual pointings, which were observed in rapid succession during each of the "Southern" observations.]] | |||
This tutorial has been split into calibration and imaging pages: | |||
# <font size = 3>'''[[AntennaeBand7 Calibration | Calibration]]'''</font size> | |||
#: This section of the tutorial steps you through inspection and calibration of the basic visibility (u-v) data. To complete this part, you will need the data in the first directory: Antennae_Band7_UnCalibratedMSandTablesForReduction. | |||
# <font size = 3>'''[[AntennaeBand7 Imaging | Imaging]]'''</font size> | |||
#: This part of the tutorial focuses on constructing images from the calibrated visibility data. If you wish to skip calibration and proceed directly to this part of the tutorial, you will need the fully-calibrated visibility data in the Antennae_Band7_CalibratedData directory. | |||
== Obtaining the Data == | |||
Download the most recent calibrated data and image products for this guide here: | |||
https://bulk.cv.nrao.edu/almadata/public/casaguides/Antennae_Band7_6.6.1 | |||
*'''Antennae_Band7_CalibratedData''' - The fully-calibrated u-v data, ready for imaging using the latest version of CASA. | |||
*'''Antennae_Band7_ReferenceImages''' - The final continuum and spectral line images using the latest version of CASA. | |||
To download the raw data, click on the region closest to your location: | |||
[http://almascience.nrao.edu/almadata/sciver/AntennaeBand7 North America] | |||
[http://almascience.eso.org/almadata/sciver/AntennaeBand7 Europe] | |||
[http://almascience.nao.ac.jp/almadata/sciver/AntennaeBand7 East Asia] | |||
Here you will find gzipped tar files. The raw data in particular is large. | |||
*'''Antennae_Band7_UnCalibratedMSandTablesForReduction''' - Here we provide you with "starter" datasets, where we have taken the raw data in ALMA Science Data Model (ASDM) format and converted them to CASA Measurement Sets (MS). We did this using the {{importasdm_6.6.1}} task in CASA. Along with the raw data, we provide tables that are needed to calibrate the data, but that cannot currently be generated inside of CASA (for Early Science, these tables will either be pre-applied or supplied with the data). | |||
== Science Target Overview == | |||
The Antennae are a nearby (22 Mpc, Schweizer et al. 2008) pair of merging galaxies, NGC 4038 (RA 12h 01m 53.0s, Dec −18° 52′ 10″) in the north and NGC 4039 (RA 12h 01m 53.6s, Dec −18° 53′ 11″) in the south. These two spiral galaxies started to interact only a few hundred million years ago (Mihos et al. 1993), making the Antennae one of the nearest and youngest examples of a major galaxy merger. The yellow bright components to the south and north of the image center of Figure 1 correspond to the nuclei of the original galaxies and are composed mostly of old stars. Dust filaments, which appear brown in the image, pervade the region between the two nuclei, and star-forming regions surrounded by HII regions (blue) can be seen throughout the system. [http://adsabs.harvard.edu/abs/2000ApJ...542..120W Wilson et al. (2000)] used OVRO to map CO(1-0) emission, a tracer of the bulk molecular gas distribution, with a resolution of 3.15″ x 4.91″ (Figures 1 and 2). Molecular emission is detected throughout the system and is particularly bright in the "interaction region" between the two nuclei, where it appears concentrated in five supergiant molecular complexes (see Figure 2). | The Antennae are a nearby (22 Mpc, Schweizer et al. 2008) pair of merging galaxies, NGC 4038 (RA 12h 01m 53.0s, Dec −18° 52′ 10″) in the north and NGC 4039 (RA 12h 01m 53.6s, Dec −18° 53′ 11″) in the south. These two spiral galaxies started to interact only a few hundred million years ago (Mihos et al. 1993), making the Antennae one of the nearest and youngest examples of a major galaxy merger. The yellow bright components to the south and north of the image center of Figure 1 correspond to the nuclei of the original galaxies and are composed mostly of old stars. Dust filaments, which appear brown in the image, pervade the region between the two nuclei, and star-forming regions surrounded by HII regions (blue) can be seen throughout the system. [http://adsabs.harvard.edu/abs/2000ApJ...542..120W Wilson et al. (2000)] used OVRO to map CO(1-0) emission, a tracer of the bulk molecular gas distribution, with a resolution of 3.15″ x 4.91″ (Figures 1 and 2). Molecular emission is detected throughout the system and is particularly bright in the "interaction region" between the two nuclei, where it appears concentrated in five supergiant molecular complexes (see Figure 2). | ||
==ALMA Data Overview== | == ALMA Data Overview == | ||
This CASA Guide steps through the reduction and imaging of ALMA Science Verification data targeting the CO 3-2 line in the Antennae galaxy. These data were obtained using the ALMA Band 7 receiver and observed in 10 separate blocks, each typically ~1 hour long, during May and June 2011. Each block observed one of two mosaic patterns, which we will refer to as the "Northern" and "Southern" mosaics. Figures 3 and 4 show the coverage of these two mosaics on an optical image of the Antennae. Within an individual observing block, the observations progress through individual pointings of the mosaic in rapid succession. One field was offset from the main body of the galaxy in each mosaic for calibration purposes. | This CASA Guide steps through the reduction and imaging of ALMA Science Verification data targeting the CO 3-2 line in the Antennae galaxy. These data were obtained using the ALMA Band 7 receiver and observed in 10 separate blocks, each typically ~1 hour long, during May and June 2011. Each block observed one of two mosaic patterns, which we will refer to as the "Northern" and "Southern" mosaics. Figures 3 and 4 show the coverage of these two mosaics on an optical image of the Antennae. Within an individual observing block, the observations progress through individual pointings of the mosaic in rapid succession. One field was offset from the main body of the galaxy in each mosaic for calibration purposes. | ||
| Line 29: | Line 61: | ||
*uid://A002/X215db8/X18 | *uid://A002/X215db8/X18 | ||
The observations used two basebands, each associated with one spectral window (see the [https://almascience.nrao.edu/ | The observations used two basebands, each associated with one spectral window (see the [https://almascience.nrao.edu/documents-and-tools/cycle10/alma-technical-handbook ALMA Technical Handbook] for a discussion of the distinction between basebands and spectral windows). The baseband in the lower sideband (LSB) is centered on the CO (3-2) transition, and the baseband in the upper sideband (USB) is used to measure continuum emission. This guide will focus on the reduction of the LSB CO (3-2) data. Each sideband was observed in both a high spectral resolution "Frequency Domain Mode" (FDM) and a lower spectral resolution "Time Domain Mode" (TDM). We will focus on reducing the FDM data, which have an effective total bandwidth of 1.875 GHz (1634 km/s) divided over 3840 channels. The channel width in FDM mode is 488.28 kHz (0.426 km/s); because the data are automatically Hanning smoothed, the actual spectral resolution is twice this. The TDM mode data were observed and used mainly for calibration purposes; we will not directly analyze them in this CASA Guide, though we will use calibration products (system temperature measurements) derived from these data. | ||
When these observations were taken, the ALMA antennas were in a configuration that is intermediate between the Cycle 0 "Extended" and "Compact" configurations. We expect this configuration to yield an angular resolution of about 1 arcsecond near 345 GHz. | When these observations were taken, the ALMA antennas were in a configuration that is intermediate between the Cycle 0 "Extended" and "Compact" configurations. We expect this configuration to yield an angular resolution of about 1 arcsecond near 345 GHz. | ||
Using the data for publication: | '''Using the data for publication''': Please use the acknowledgement given at the bottom of the [https://almascience.nrao.edu/alma-data/science-verification Science Verification Data page]. | ||
We thank the following people for suggesting NGC4038/9 for ALMA Science Verification: Francois Boulanger, Nicole Nesvadba, Cinthya Herrera. We particularly thank Christine Wilson and Junko Ueda for providing both the suggestions and the OVRO (CO(1-0): Wilson et al. 2000) and SMA (CO(3-2): Ueda et al., submitted) data for verification purposes. | We thank the following people for suggesting NGC4038/9 for ALMA Science Verification: Francois Boulanger, Nicole Nesvadba, Cinthya Herrera. We particularly thank Christine Wilson and Junko Ueda for providing both the suggestions and the OVRO (CO(1-0): Wilson et al. 2000) and SMA (CO(3-2): Ueda et al., submitted) data for verification purposes. | ||
== | == Version History == | ||
{| class="mw-collapsible mw-collapsed wikitable" | |||
|+ style="white-space:nowrap; border:1px solid; padding:5px; overflow:auto" | Older Versions of This Guide | |||
< | |- | ||
! '''CASA Version''' !! '''Calibration Guide''' !! '''Imaging Guide''' | |||
|- | |||
| '''CASA 6.5''' || [[AntennaeBand7 Calibration 6.5.4]] || [[AntennaeBand7 Imaging 6.5.4]] | |||
|- | |||
| '''CASA 6.4''' || [[AntennaeBand7 Calibration 6.4]] || [[AntennaeBand7 Imaging 6.4]] | |||
|- | |||
| '''CASA 6.2''' || [[AntennaeBand7 Calibration 6.2]] || [[AntennaeBand7 Imaging 6.2]] | |||
|- | |||
| '''CASA 6.1''' || [[AntennaeBand7 Calibration 6.1]] || [[AntennaeBand7 Imaging 6.1]] | |||
|- | |||
| '''CASA 5.7''' || [[AntennaeBand7 Calibration 5.7]] || [[AntennaeBand7 Imaging 5.7]] | |||
|- | |||
| '''CASA 5.4''' || [[AntennaeBand7 Calibration 5.4]] || [[AntennaeBand7 Imaging 5.4]] | |||
|- | |||
| '''CASA 5.1''' || [[AntennaeBand7 Calibration 5.1]] || [[AntennaeBand7 Imaging 5.1]] | |||
|- | |||
| '''CASA 4.5''' || [[AntennaeBand7 Calibration 4.5]] || [[AntennaeBand7 Imaging 4.5]] | |||
|- | |||
| '''CASA 4.4''' || [[AntennaeBand7 Calibration 4.4]] || [[AntennaeBand7 Imaging 4.4]] | |||
|- | |||
| '''CASA 4.3''' || [[AntennaeBand7 Calibration 4.3]] || [[AntennaeBand7 Imaging 4.3]] | |||
|- | |||
| '''CASA 4.2''' || [[AntennaeBand7 Calibration 4.2]] || [[AntennaeBand7 Imaging 4.2]] | |||
|- | |||
| '''CASA 4.1''' || [[AntennaeBand7 Calibration 4.1]] || [[AntennaeBand7 Imaging 4.1]] | |||
|- | |||
| '''CASA 4.0''' || [[AntennaeBand7 Calibration 4.0]] || [[AntennaeBand7 Imaging 4.0]] | |||
|- | |||
| '''CASA 3.4''' || [[AntennaeBand7 Calibration 3.4]] || [[AntennaeBand7 Imaging 3.4]] | |||
|- | |||
| '''CASA 3.3''' || [[Antennae Band7 - Calibration for CASA 3.3]] <br> '''Be sure to download the 3.3 versions''' <br> '''of the data products described above''' <br> '''if you decide to use this version of the''' <br> '''guides.''' || [[Antennae Band7 - Imaging for CASA 3.3]] | |||
|} | |||
Latest revision as of 18:51, 30 April 2025
Most recently updated for CASA Version 6.6.1 using Python 3.8
Antennae Band 7 Data Reduction Tutorial


This tutorial has been split into calibration and imaging pages:
- Calibration
- This section of the tutorial steps you through inspection and calibration of the basic visibility (u-v) data. To complete this part, you will need the data in the first directory: Antennae_Band7_UnCalibratedMSandTablesForReduction.
- Imaging
- This part of the tutorial focuses on constructing images from the calibrated visibility data. If you wish to skip calibration and proceed directly to this part of the tutorial, you will need the fully-calibrated visibility data in the Antennae_Band7_CalibratedData directory.
Obtaining the Data
Download the most recent calibrated data and image products for this guide here:
https://bulk.cv.nrao.edu/almadata/public/casaguides/Antennae_Band7_6.6.1
- Antennae_Band7_CalibratedData - The fully-calibrated u-v data, ready for imaging using the latest version of CASA.
- Antennae_Band7_ReferenceImages - The final continuum and spectral line images using the latest version of CASA.
To download the raw data, click on the region closest to your location:
Here you will find gzipped tar files. The raw data in particular is large.
- Antennae_Band7_UnCalibratedMSandTablesForReduction - Here we provide you with "starter" datasets, where we have taken the raw data in ALMA Science Data Model (ASDM) format and converted them to CASA Measurement Sets (MS). We did this using the importasdm task in CASA. Along with the raw data, we provide tables that are needed to calibrate the data, but that cannot currently be generated inside of CASA (for Early Science, these tables will either be pre-applied or supplied with the data).
Science Target Overview
The Antennae are a nearby (22 Mpc, Schweizer et al. 2008) pair of merging galaxies, NGC 4038 (RA 12h 01m 53.0s, Dec −18° 52′ 10″) in the north and NGC 4039 (RA 12h 01m 53.6s, Dec −18° 53′ 11″) in the south. These two spiral galaxies started to interact only a few hundred million years ago (Mihos et al. 1993), making the Antennae one of the nearest and youngest examples of a major galaxy merger. The yellow bright components to the south and north of the image center of Figure 1 correspond to the nuclei of the original galaxies and are composed mostly of old stars. Dust filaments, which appear brown in the image, pervade the region between the two nuclei, and star-forming regions surrounded by HII regions (blue) can be seen throughout the system. Wilson et al. (2000) used OVRO to map CO(1-0) emission, a tracer of the bulk molecular gas distribution, with a resolution of 3.15″ x 4.91″ (Figures 1 and 2). Molecular emission is detected throughout the system and is particularly bright in the "interaction region" between the two nuclei, where it appears concentrated in five supergiant molecular complexes (see Figure 2).
ALMA Data Overview
This CASA Guide steps through the reduction and imaging of ALMA Science Verification data targeting the CO 3-2 line in the Antennae galaxy. These data were obtained using the ALMA Band 7 receiver and observed in 10 separate blocks, each typically ~1 hour long, during May and June 2011. Each block observed one of two mosaic patterns, which we will refer to as the "Northern" and "Southern" mosaics. Figures 3 and 4 show the coverage of these two mosaics on an optical image of the Antennae. Within an individual observing block, the observations progress through individual pointings of the mosaic in rapid succession. One field was offset from the main body of the galaxy in each mosaic for calibration purposes.
The observations are broken down into ten individual data sets, as follows:
Northern mosaic (covering the nucleus of NGC 4038):
- uid://A002/X1ff7b0/Xb
- uid://A002/X207fe4/X3a
- uid://A002/X207fe4/X3b9
- uid://A002/X2181fb/X49
Southern mosaic (covering the nucleus of NGC 4039 and part of the interaction region):
- uid://A002/X1ff7b0/X1c8
- uid://A002/X207fe4/X1f7
- uid://A002/X207fe4/X4d7
- uid://A002/X215db8/X1d5
- uid://A002/X215db8/X392
- uid://A002/X215db8/X18
The observations used two basebands, each associated with one spectral window (see the ALMA Technical Handbook for a discussion of the distinction between basebands and spectral windows). The baseband in the lower sideband (LSB) is centered on the CO (3-2) transition, and the baseband in the upper sideband (USB) is used to measure continuum emission. This guide will focus on the reduction of the LSB CO (3-2) data. Each sideband was observed in both a high spectral resolution "Frequency Domain Mode" (FDM) and a lower spectral resolution "Time Domain Mode" (TDM). We will focus on reducing the FDM data, which have an effective total bandwidth of 1.875 GHz (1634 km/s) divided over 3840 channels. The channel width in FDM mode is 488.28 kHz (0.426 km/s); because the data are automatically Hanning smoothed, the actual spectral resolution is twice this. The TDM mode data were observed and used mainly for calibration purposes; we will not directly analyze them in this CASA Guide, though we will use calibration products (system temperature measurements) derived from these data.
When these observations were taken, the ALMA antennas were in a configuration that is intermediate between the Cycle 0 "Extended" and "Compact" configurations. We expect this configuration to yield an angular resolution of about 1 arcsecond near 345 GHz.
Using the data for publication: Please use the acknowledgement given at the bottom of the Science Verification Data page.
We thank the following people for suggesting NGC4038/9 for ALMA Science Verification: Francois Boulanger, Nicole Nesvadba, Cinthya Herrera. We particularly thank Christine Wilson and Junko Ueda for providing both the suggestions and the OVRO (CO(1-0): Wilson et al. 2000) and SMA (CO(3-2): Ueda et al., submitted) data for verification purposes.