PlotPWV: Difference between revisions
From CASA Guides
Jump to navigationJump to search
No edit summary |
|||
| (5 intermediate revisions by the same user not shown) | |||
| Line 5: | Line 5: | ||
If the ASDM_CALWVR table is present in your ms, this function will | If the ASDM_CALWVR table is present in your ms, this function will | ||
extract the PWV values from each ALMA antenna's WVR and create a plot vs. time. | extract the PWV values from each ALMA antenna's WVR and create a plot vs. time. | ||
If | If the ms does not have the ASDM_CALWVR table or it is empty (as in 7m-only datasets), it will then use the ASDM_CALATMOSPHERE table. If you have neither of these tables, but you do have the ASDM, you can | ||
instead use [https://safe.nrao.edu/wiki/bin/view/ALMA/PlotPWVfromASDM plotPWVFromASDM] | instead use [https://safe.nrao.edu/wiki/bin/view/ALMA/PlotPWVfromASDM plotPWVFromASDM] | ||
| Line 11: | Line 11: | ||
<pre> | <pre> | ||
plotPWV(ms, figfile='', plotrange=[0, 0, 0, 0], clip=True) | # In CASA | ||
au.plotPWV(ms, figfile='', plotrange=[0, 0, 0, 0], clip=True) | |||
Read and plot the PWV values from the ms via the ASDM_CALWVR table. | Read and plot the PWV values from the ms via the ASDM_CALWVR table. | ||
Different antennas are shown in different colored points. | Different antennas are shown in different colored points. | ||
| Line 24: | Line 25: | ||
==Examples== | ==Examples== | ||
<source lang="python"> | |||
au.plotPWV('X3c1.ms', figfile=True) | |||
</source> | |||
[[File:X3c1.ms.pwv.png]] | |||
[[File: | |||
Latest revision as of 17:17, 14 April 2014
Return to Analysis Utilities
This page documents the plotPWV function of Python module analysisUtils.
If the ASDM_CALWVR table is present in your ms, this function will extract the PWV values from each ALMA antenna's WVR and create a plot vs. time. If the ms does not have the ASDM_CALWVR table or it is empty (as in 7m-only datasets), it will then use the ASDM_CALATMOSPHERE table. If you have neither of these tables, but you do have the ASDM, you can instead use plotPWVFromASDM
Help on function plotPWV in module analysisUtils:
# In CASA
au.plotPWV(ms, figfile='', plotrange=[0, 0, 0, 0], clip=True)
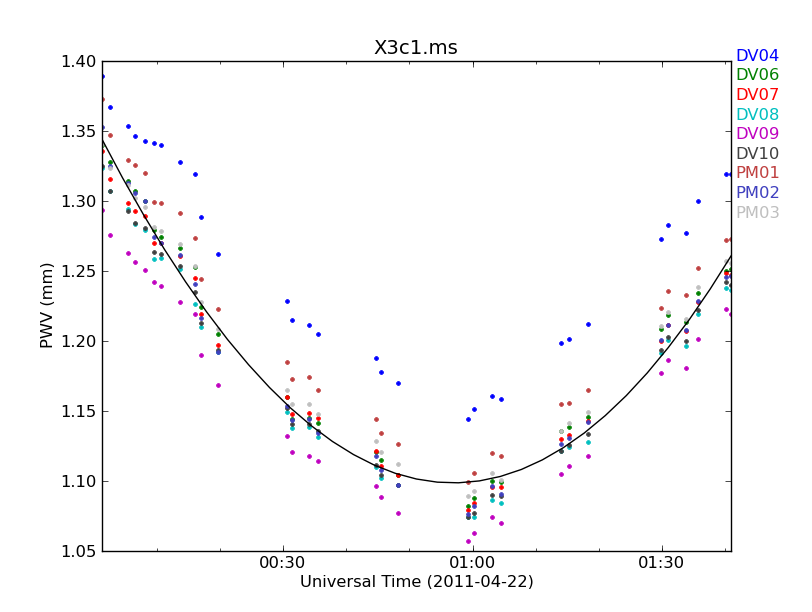
    Read and plot the PWV values from the ms via the ASDM_CALWVR table.
    Different antennas are shown in different colored points.
    Arguments:
    ms:  the measurement set
    plotrange: the ranges for the X and Y axes (default=[0,0,0,0] which is autorange)
    clip:  default=True,  True=do not plot outliers beyond 5*MAD from the median.
    figfile: True, False, or a string
             If figfile is not a string, the file created will be <ms>.pwv.png.
Examples
au.plotPWV('X3c1.ms', figfile=True)
