File:Bandpass phase.DV07.spw0.t1.png: Difference between revisions
From CASA Guides
Jump to navigationJump to search
(Use analysisUtils.plotBandpass to display a simple bandpass solution with specified y-axis scaling.) |
(No difference)
|
Latest revision as of 11:32, 4 January 2012
Use analysisUtils.plotBandpass to display a simple bandpass solution with specified y-axis scaling.
File history
Click on a date/time to view the file as it appeared at that time.
| Date/Time | Thumbnail | Dimensions | User | Comment | |
|---|---|---|---|---|---|
| current | 11:32, 4 January 2012 | 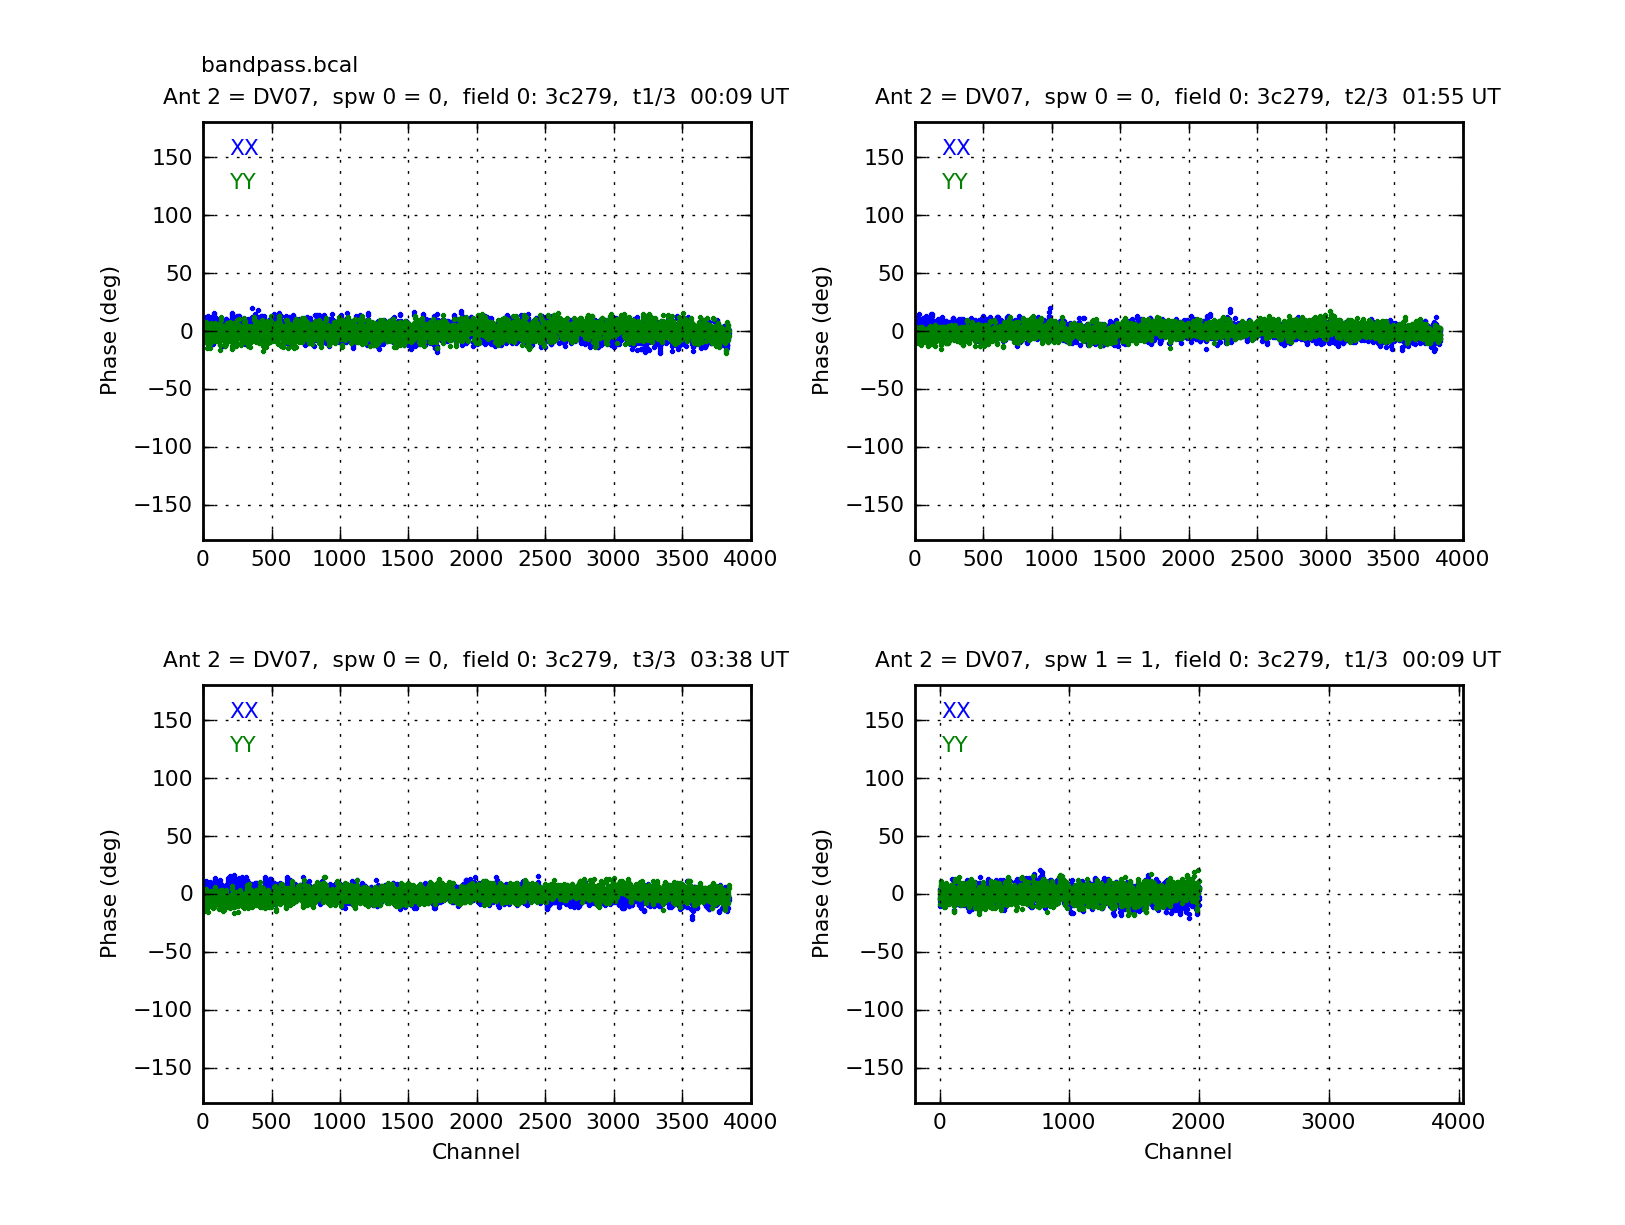 | 1,625 × 1,225 (127 KB) | Jcrossle (talk | contribs) | Use analysisUtils.plotBandpass to display a simple bandpass solution with specified y-axis scaling. |
You cannot overwrite this file.
File usage
The following page uses this file: