File:Pband hanning.png: Difference between revisions
From CASA Guides
Jump to navigationJump to search
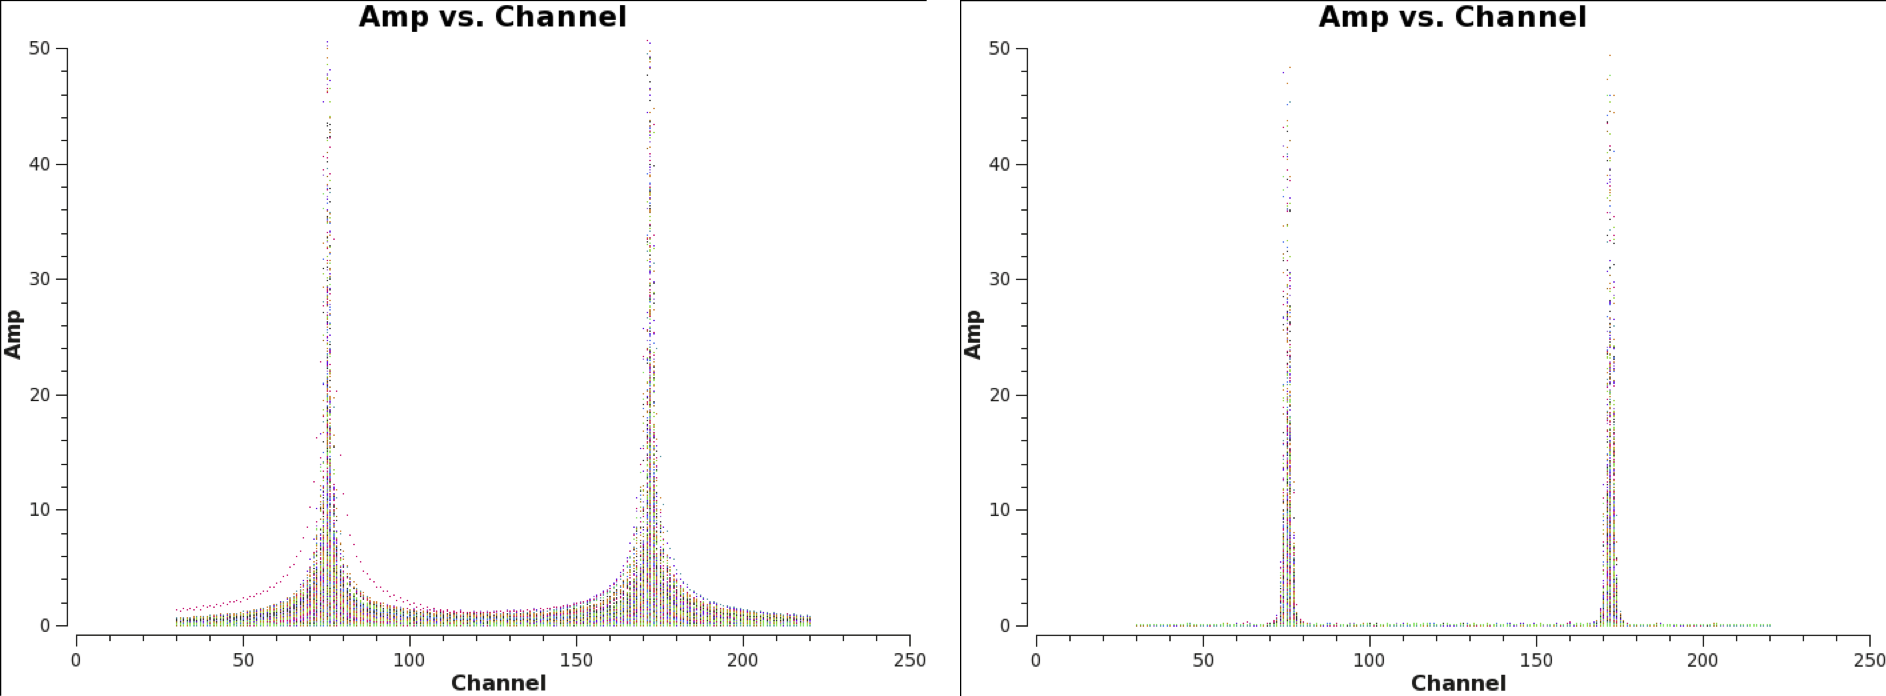
Fig.1. Reducing the effects of Gibbs ringing by Hanning smoothing the data. Shown is only a small fraction of the band, both before and after Hanning smooth. The amplitude scale is the same in both plots. |
(No difference)
|
Latest revision as of 20:32, 18 August 2017
Fig.1. Reducing the effects of Gibbs ringing by Hanning smoothing the data. Shown is only a small fraction of the band, both before and after Hanning smooth. The amplitude scale is the same in both plots.
File history
Click on a date/time to view the file as it appeared at that time.
| Date/Time | Thumbnail | Dimensions | User | Comment | |
|---|---|---|---|---|---|
| current | 20:32, 18 August 2017 | 1,886 × 696 (153 KB) | Bemonts (talk | contribs) | Fig.1. Reducing the effects of Gibbs ringing by Hanning smoothing the data. Shown is only a small fraction of the band, both before and after Hanning smooth. The amplitude scale is the same in both plots. |
You cannot overwrite this file.
File usage
There are no pages that use this file.